www.nat-hazards-earth-syst-sci.net/10/1495/2010/ doi:10.5194/nhess-10-1495-2010
© Author(s) 2010. CC Attribution 3.0 License.
and Earth
System Sciences
Ground motion prediction from nearest seismogenic zones in and
around Greater Cairo Area, Egypt
Abd El-Aziz Khairy Abd El-Aal
National Research Institute of Astronomy and Geophysics, Helwan, Cairo, Egypt
Received: 6 October 2009 – Revised: 27 April 2010 – Accepted: 31 May 2010 – Published: 9 July 2010
Abstract. This paper reviews the likely source characteris-tics, focal source mechanism and fault patterns of the nearest effective seismogenic zones to Greater Cairo Area. Further-more,Mmaxand ground accelerations related to the effective seismic events expected in future from those seismogenic zones are well evaluated. For this purpose, the digital wave-form of earthquakes thanML=3 that occurred in and around Greater Cairo Area from 1997 to 2008 which have been recorded by the Egyptian National Seismological Network, are used to study source characterization, focal mechanism and fault pattern of the seismogenic zones around Greater Cairo Area. The ground motions are predicted from seismo-genic zones to assess seismic hazard in the northeastern part of Greater Cairo, where three effective seismogenic zones, namely Abou Zabul, southeast Cairo trend and Dahshour area, have the largest effect to the Greater Cairo Area. The Mmaxwas determined, based upon an empirical relationship between the seismic moment and the rupture length of the fault during the earthquake. The estimatedMmaxexpected from Abou Zabul, southeast Cairo trend, Dahshour seismic sources are ofMwmagnitudes equal to 5.4, 5.1, and 6.5, re-spectively. The predominant fundamental frequency and soil amplification characteristics at the area were obtained using boreholes data and in-situ ambient noise measurement.
1 Introduction
In Egypt, the population, archaeological sites and sensitive structures are concentrated within a narrow zone around the Nile valley that occupies only 1% of the total area of the country. Nevertheless, both the population and the newly developed areas in this zone are still growing rapidly. In
Correspondence to:
Abd El-Aziz Khairy Abd El-Aal ([email protected])
general, buildings in Egypt are not designed to resist earth-quakes, therefore relatively small events can be the source of huge socio-economic disasters. The event of 12 October 1992 is an example of a small but damaging earthquake in Egypt. Protection of strategic structures like nuclear power plants, dams and big populated cites, in Egypt, from all kinds of hazard, particularly earthquakes, is actually the essential mission of the seismologists and civil engineers in the present and the future.
1496 Abd El-Aziz Khairy Abd El-Aal: Ground motion prediction from nearest seismogenic zones, Egypt sediments to noise sources is in some way related to that for
incident seismic waves. Field and Jacob (1993) supported the theoretical meaning of the assumption. They computed the theoretical response of a horizontally stratified sedimentary layer to ambient noise sources represented as a random dis-tribution (in time, space, and orientation) of impulsive point forces located on the Earth’s surface. In the current research, the H/V Ratio, which was proposed by Nakamura (1989), is applied here to estimate the fundamental frequency and site amplification from microtremor records at the area of inter-est.
Finally, for the assessment of seismic hazard in terms of peak ground acceleration and the response spectra, the stochastic simulation technique proposed by Boore (2003) is used. The radiated energy is assumed to be evenly dis-tributed over a specified duration. He assumed that the to-tal spectrum of the motion at a site is formed from contri-butions from earthquake source, path site, site effect, and instrument. By separating the spectrum into these compo-nents, the models based on the stochastic method can be eas-ily modified to account for specific situations or for improved information about particular aspects of the model. The pre-diction of ground motion or response amplitude as a function of earthquake magnitude and distance is of fundamental im-portance for the assessment of seismic hazard (Abd El-Aal, 2008, 2010).
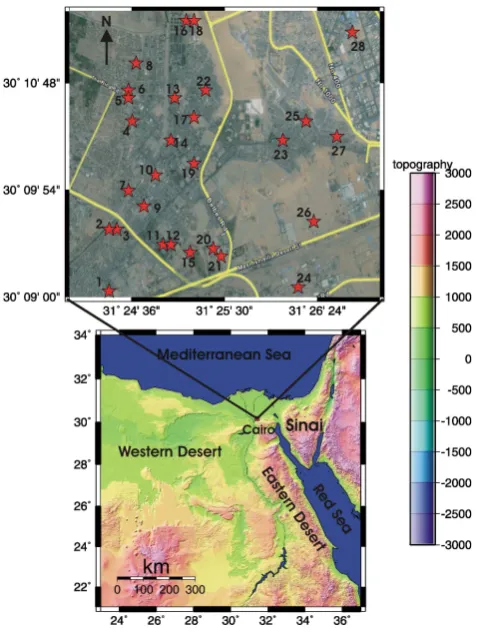
Cairo is the capital of Egypt and the largest city in the Arab World, nicknamed “The City of a Thousand Minarets” for its preponderance of Islamic architecture. With a pop-ulation of 17.2 million spread over 214 km2, Cairo is by far the largest city in Egypt as well as one of the most densely-populated cities in the world. With an additional 10 million inhabitants just outside the city, Cairo resides at the center of the largest metropolitan area in Africa and the eleventh-largest urban area in the world. Cairo is located on the banks and islands of the Nile River in the north of Egypt, immediately south of the point where the river leaves its desert-bound valley and breaks into two branches into the low-lying Nile Delta region. Referring to Cairo often means Greater Cairo Metropolitan Area (GCMA), which is composed of Cairo Governorate, part of Giza and Qalu-obyia Governorates. Since May 2008 Greater Cairo has been divided into four new governorates: Cairo, Helwan, Giza Governorate and the 6 October Governorate. Cairo is a rapidly expanding city, which has led to many environ-mental problems. The draw factor of such important land-marks coupled with a very vibrant megalopolis with an esti-mated 17.2 million inhabitants makes GCMA more vulnera-ble to strong earthquakes. Hence, the prediction of expected ground-motions and their natural variability at the sites lo-cated at a given distance from an earthquake of a given mag-nitude is one of the most critical elements of any seismic hazard analysis for Egypt. For these reasons, the northeast-ern part of Greater Cairo Metropolitan area was selected to be our area of study (Fig. 1).
Fig. 1. Lower panel is a topographic map of Egypt. Upper panel
is satellite image of the northeastern Greater Cairo Area. The red stars in upper panel map indicate to site No. of field seismic mea-surements.
2 Overview of surface and structure geology
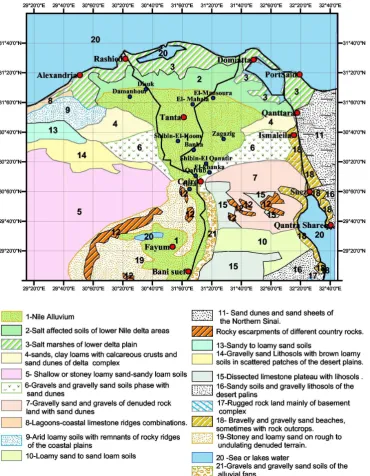
Fig. 2. Map of Surface geology in and around Greater Cairo Area (scale 1:500 000, EGSMA, 1983).
Suez NW-SE fault trend represented by the Qatrani fault of normal type, and the Mediterranean E-W trend represented by Gabal El-Sheeb fault.
3 Method
It has been shown before a methodology (Abd El-Aal, 2010) for estimating the ground motion from the effective instru-mental earthquakes (during the 1992, 1999, and 2002 Cairo earthquakes) to the northeastern Cairo Metropolitan Area. In the current work, a dynamic procedure is applied to calculate
1498 Abd El-Aziz Khairy Abd El-Aal: Ground motion prediction from nearest seismogenic zones, Egypt
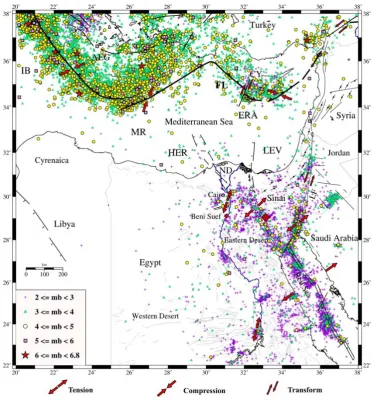
Fig. 3. Tectonic boundaries of the Eastern Mediterranean Region. Seismicity data (2≤Mb<6.8) was compiled (Abou Elenean and Hussein, 2008) from ENSN and NEIC (1997–2007). The following Acronyms represent: AEG – Aegean Sea; Al – Alexandria City; CY – Cyprus; ERA – Eratosthenes Seamount; FL – Florence; IB – Ionian Basin; MR – Mediterranean Ridge; LEV – Levantine Basin; LF – Levant Fault; ND – Nile Delta. Red diamond indicates the location of Abo Zenema area. After Abou Elenean et al. (2010).
3.1 Overview of seismicity, seismotectoics, and seismic networks
The study area undergoes severe extensional stress result-ing from the regional forces of the neighborresult-ing plate bound-aries including the African, Arabian and Eurasian plate mar-gins, the Red Sea rifting system, and the Aqaba-Dead Sea fault system (Fig. 3). In addition, local tectonics structures of the Gulf of Suez and the Nile River affect the tectonic regime of northern Egypt. The major part of the tectonic deformation within Egypt is remote and takes place along the mentioned margins as revealed by the observed high rate of the seismic activity. Nevertheless, low to moderate seis-mic activity occurs along few E-W to NW-SE faults due to the partly transfer of deformation from these boundaries to
earthquake reached 4 billion US dollars. Hence, although this earthquake is classified as a small event (M<6.0), it caused significant injuries, loss of life and damage to property. Sig-nificant damage was found mostly in adobe or non-reinforced masonry buildings and non-engineering reinforced concrete buildings (Japanese Expert Team, 1993). The damage was observed mostly in the buildings that were illegally con-structed or concon-structed by poor construction work. The 12 October 1992 earthquake is the first disastrous event to have occurred in this region since the 1847 event, after a lapse of 145 years.
After the 12 October 1992 earthquake, the Egyptian gov-ernment commissioned the National Research Institute of Astronomy and Geophysics, to organize and install the Egyptian National Seismological Network and the Egyptian Strong Ground Motion Network in an attempt to minimize the earthquake damages and to anticipate the future safe de-velopment of big strategic projects. The targets of these net-works are the protection of the strategic buildings, and new cities, through monitoring local and regional seismic activ-ity. The Egyptian National Seismological Network (ENSN) includes 60 seismic stations distributed in whole the area of Egypt and also involve one main center at Helwan city and five sub-centers at Burg El-Arab, Hurghada, Mersa Alam, Aswan and Kharga (Fig. 4). The sub-centers are recently connected to the main center using satellite communication. The digital data is extracted online from the remote teleme-try stations, via radio, telephone lines and satellite commu-nications by using seismic data analysis software (DAN and ATLAS programs). The received data is analyzed to calcu-late the earthquake parameters and the location of epicen-ter. Since 1996, the National Research Institute of Astron-omy and Geophysics has installed strong motion instrument model IDS-3602A-16 Bit-Digital Accelerographs at differ-ent sites distributed all over Egypt (Fig. 4). On Tuesday, 28 December 1999, The Egyptian National Seismological Network (ENSN) recorded a small earthquake sequence that took place in northern Egypt, about 25 km NE of Cairo. TheMb=4.5 mainshock was felt throughout the great Cairo region and 12 min later was followed by a Mb=3.9 after-shock and 4 h later by a Mb=3.6 aftershock. Also on Sat-urday, 24 August 2002, greater Cairo was hit by a moderate earthquake withMb=4.3 and 3 min later was followed by an Mb=3.8 aftershock. The events were recorded by the stations of the ENSN and Egyptian Strong Ground Motion Network. 3.2 Digital and input data
A set of digital and analog data have been used in this study. The digital data include both waveforms of earth-quakes recorded by the ENSN in the period from 1997 to 2008, and digital data of microtremors measurements which have been conducted in the investigated area. On the other hand, the analog data includes all the well-log and boreholes which have been carried out by Egyptian General
Organiza-Fig. 4. The Egyptian National Seismic Network and the Egyptian
Strong Ground Motion Network installed by National Research In-stitute of Astronomy and Geophysics.
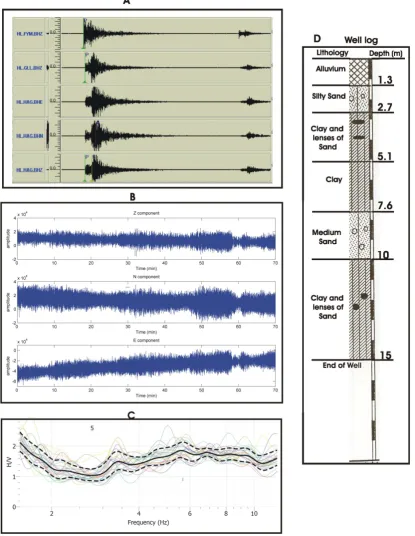
tion for Physical Planning. The first set of data is used to de-termine focal mechanism of the effective events and for ob-taining the source parameters using the inversion technique. Furthermore, the boreholes data with the microtremors data have been used to calculate the predominant frequencies and amplification factors in the studied area. Figure 5 illustrates examples of digital and analog data used in the current study. Waveform data used in this study are from some stations belonging to the ENSN. All instruments are velocity sensors with a 24-bit digital recording system with sampling rate of 100 sample/s. The instrument response is flat, from 1.9 to 38 Hz. The dynamic range is of about 124 dB. For waveform analysis, parts of P-wave and S-wave of velocity records are used.
3.3 Seismogenic zones in and around Greater Cairo Area
1500 Abd El-Aziz Khairy Abd El-Aal: Ground motion prediction from nearest seismogenic zones, Egypt
Fig. 5. Examples of digital and analog data used in the current study. Panel A is the digital waveform for the 24 August 2002 earthquake
and its aftershock. Panel B is the digital waveforms of recorded background noise. Panel C is the H/V result of recorded background noise at site 13. Panel D represents the analog data of borehole at site 9.
be divided into the two tectonic provinces: northern Egypt (north of 27◦N) and southern Egypt. The first province is more seismically active than the second province. It was also demonstrated that these provinces differ in stress patterns too
Table 1. Focal mechanism parameters of the earthquakes with magnitude greater thanML≥3 which occurred in the effective sesimogenic zones in and around Greater Cairo Area.
Earthquake date Coordinates Magnitude Focal mechanism Remarks (ML)
Lat Long Strike Dip Rake
12 Oct 1992 29.77 31.07 5.8 161 58 –40
28 Dec 1999-M 30.29 31.45 4.5 137 72 –39 Mainshock
28 Dec 1999-AF1 30.25 31.5 3.1 130 70 –35 Aftershock
28 Dec 1999-AF2 30.26 31.44 3.3 140 75 –37 Aftershock
29 Jun 2000 29.53 31.6 4 126 45 –64
3 Oct 2000 29.67 31.1 3.4 132 46 –47
9 Dec 2000 30.28 31.09 3.4 103 37 –129
24 Feb 2001 29.67 31.07 3.5 130 75 –72
12 Jun 2001 29.66 31.12 4.1 115 70 –60
17 Dec 2001 29.57 30.88 4.3 82 73 –145 Mainshock
24 Aug 2002-M 30.14 31.35 4.3 89 40 –87 Aftershock
24 Aug 2002-AF1 30.24 31.32 3.8 103 37 –129
27 Jun 2003 29.65 31.14 3 170 45 –26
25 Mar 2004 30.54 31.74 3.7 323 48 –65
28 Nov 2004 30.34 31.67 3.5 310 65 –90
15 May 2005 30.08 31.42 3.1 234 37 –126
7 Jul 2005 29.88 31.84 4.2 125 84 139
31 Jul 2005 29.67 31.13 4.3 92 30 –86
30 Oct 2007 29.78 31.81 4 127 67 –59
21 Jun 2008 29.78 30.64 4 77 76 –139
of Aqaba and Dead Sea) and to the African plate (Gulf of Suez) represents the main source of active tectonics and seis-mic activity. However, according to the fault patterns and focal mechanism for the earthquakes recorded in and around the studied area, three seismogenic zones have been recog-nized which they have the biggest effect to the area. Ta-ble 1 lists the focal mechanism parameters for earthquakes withML≥3 which occurred in the defined seismogenic zones in and around the area of interest. For more details about the seismic sources around Greater Cairo Area see Abd El-Aal (2010).
3.3.1 Fault patterns and focal mechanism of seismogenic zone 1
The area, in which the epicenter of 28 December 1999 earth-quake and its aftershocks located (Abou Zabul area), is con-sidered as a separate seismic zone depending on fault and stress pattern and focal mechanism of recent earthquakes oc-curred in this area (Fig. 6). Along this trend, small to mod-erate historical and recent earthquakes have been observed (Fig. 7). It is clear that the Cairo region has suffered not only from interplate earthquakes but also from inland seismic dis-locations. The most active inland dislocation is the Dahshour area (25 km southwest of Cairo) and Abou Zabul area. The present-day stress field, estimated from several focal mech-anisms and borehole breakouts shows a transtensional stress
regime with a tension axis about N-S to NE-SW in northern Egypt. Three fault trends, E-W, NW-SE, and NE-SW, af-fect the epicentral area. All these faults are normal faults. The stresses which created the structure in the Abou Zabul area were tensional rather than compressional. According to Maamoun and Allam (1980), the presence of earthquake epi-centers in Nile, just in the front of the mouth of Alexandria Canyon may indicate that the course of the canyon is affected by faulting extends in NW-SE direction (Abdel-Fattah and Badawy, 2004).
According to the focal mechanism and radiation pattern of the mainshock and aftershocks of 28 December 1999 earthquake (Fig. 6), the rupture direction propagated toward S137◦E with an averaged rupture velocity around 0.75Vs. The result obtained for rupture direction is in agreement with one of the nodal planes of focal mechanism. From the rup-ture directivity analysis, focal mechanism and geological evi-dence it follows that the investigated event reflects a reactiva-tion of a NW-SE Oligocene deep-seated normal faulting with sinistral movement with fault radius of 344 m, fault length 1460 m.
3.3.2 Fault patterns and focal mechanism of seismogenic zone 2
1502 Abd El-Aziz Khairy Abd El-Aal: Ground motion prediction from nearest seismogenic zones, Egypt
Fig. 6. Focal mechanism and radiation pattern of: 1) 28 December
1999 earthquake and its aftershocks (seismogenic zone 1), 24 Au-gust 2002 earthquake and its aftershock (seismogenic zone 2), and 3) 12 October 1992 earthquake (seismogenic zone 3). Focal mecha-nism based on the polarities of P-wave and lower hemisphere equal area projection is used.
and is characterized by the occurrences of shallow, micro, small, moderate and large earthquakes (Fig. 7). The 24 Au-gust 2002 earthquake is located in this active zone. The predominant factor in terms of seismic hazard is generally related to the occurrence of moderate size earthquakes at short distances rather than large earthquakes that are known to occur at larger distances along the northern Red Sea, the Gulf of Suez and the offshore Mediterranean region (e.g., the Alexandria offshore earthquake in 1955; Mw=6.8; the Shadwan earthquake in 1969;Mw=6.9; as well as the Gulf of Aqaba earthquake in 1995;Mw=7.3). The activity along this trend is mainly attributed to the Red Sea rifting as well as to several active faults. So the seismic activity of this rift is associated with the deep axial trough in its central and
south-Fig. 7. The closest seismogenic zones in and around Greater Cairo
Area. Earthquakes recorded by Egyptian National Seismic Network from 1997 to 2008. Black square represents the location of studied area. Focal mechanism of the earthquakes greater thanML>3 is presented with lower hemisphere projection and dark quadrant de-notes compression.
ern parts (Kebeasy, 1990). The seismic activity is migrated northerly toward the region of Jubal Island at the entrance of the Gulf of Suez, where the activity tends to follow the two different structural trends of the Aqaba-Levant zone and the Gulf of Suez zone. It is clear that the high rate of seismic-ity in the southern end of the Gulf of Suez is related to the crustal movements among the Arabian plate, African plate and the Sinai subplate, as a result of the opening of the Red Sea extension in the Gulf of Suez and the left-lateral strike-slip motion of the Gulf of Aqaba. Daggett et al. (1986) in-dicated that although the southern end of the Gulf of Suez is seismically active, the activity does not extend along the length of the gulf. So there is a seismic gap in the Gulf of Suez.
3.3.3 Fault patterns and focal mechanism of seismogenic zone 3
On 12 October 1992, a damaging earthquake of magnitude Mb=5.8, hit the Capital of Egypt. This event took place in Dahshour area, 25 km to the southwest of Cairo City. Many aftershocks followed the mainshock. The similarity between the mechanisms as well as the spatial distribution of the geo-logical faults around Cairo suggest seismic activity along the extension of the stress field of the Red Sea rift system to the area around the city of Cairo. This situation affects the level of seismic hazard in the Cairo area.
The seismogenic zone, in which the 12 October 1992 earthquake was located, is considered as one of the most ac-tive seismogenic zones to greater Cairo metropolitan area. According to the temporal distribution of the last decade re-ported seismicity in Northern Egypt, Abou Elenean (1997) used the epicentral distribution, seismicity level and the similarity of focal mechanisms, considered the area south-west of Cairo (Dahshour area) as a seismogenic zone. Tectonically, the faults of this area are trending E-W, parallel to the Mediterranean trend, or NW-SW, parallel to the Gulf of Suez trend. The NW-SE and E-W directions accord with the surface features, which appeared immediately after the occurrence of 1992 earthquake with a fault length 13.8 km (Figs. 6 and 7). In the Dahshour seismogenic zone, there are three main lithological categories that can be distinguished: 1) unconsolidated Quaternary sediments in Fayoum basin, the Nile Delta and along the Nile River; 2) Limestone and clastic sediments of Paleogene, and 3) Neogene formation which consists mainly of clastic sediments of Miocene age, covering most of the northern part of the western desert.
3.4 Source parameters and nonlinear least square inversion technique
Several workers have attempted to determine source param-eters for small and moderate earthquakes and suggested that fairly complete source information can be extracted from a single seismic station given certain conditions. Source pa-rameters are very useful in ground motion evaluation and in the assessment of seismic hazard. In the current work, the nonlinear least square inversion technique has been used to estimate the dynamic source parameters for three effective events from seismogenic zones around the studied area. Seis-mic moment, size of the rupture plane, source dislocation and stress drop have been estimated using the S-wave dis-placement spectrum. The instrument response from the orig-inal seismograms was removed to obtain true ground motion (displacement). At each station the vertical, N-S and E-W components are rotated to great circle projection to get radial and transverse components. The S-wave spectrum is com-puted from the transverse component and corrected for atten-uation and path effects using the average attenatten-uation relation
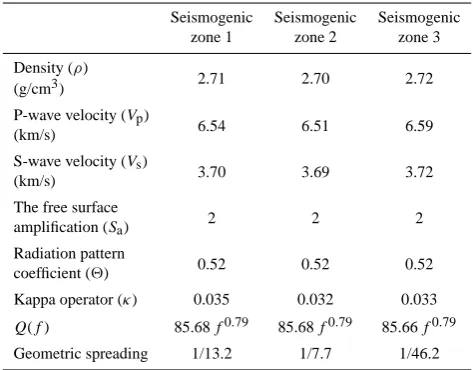
Table 2. Modelling parameters for the application of the source
parameters, Mmax and PGA estimation from different seismogenic zones in and around Greater Cairo Area.
Seismogenic Seismogenic Seismogenic zone 1 zone 2 zone 3
Density (ρ)
2.71 2.70 2.72
(g/cm3)
P-wave velocity (Vp)
6.54 6.51 6.59
(km/s)
S-wave velocity (Vs)
3.70 3.69 3.72
(km/s)
The free surface
2 2 2
amplification (Sa)
Radiation pattern
0.52 0.52 0.52
coefficient (2)
Kappa operator (κ) 0.035 0.032 0.033
Q(f) 85.68f0.79 85.68f0.79 85.66f0.79
Geometric spreading 1/13.2 1/7.7 1/46.2
for greater Cairo. The amplitude level at low frequencies is constant, while it decays for higher frequencies with decay constant asω2.
The displacement spectrum is approximated by two straight lines, the first represents a constant amplitude level uo at low frequencies and the second is the approximation of decay spectrum at higher frequencies. The intersection of these two straight lines gives the corner frequencyfc. The source parameters are computed usinguo and fc applying the circular source model of Brune (1970, 1971). Using this model and Hanks and Wyss (1972), the relation between seismic momentM0anduowith average S-wave velocity is given as:
M0=4π rρ (Vs)3nu˜ o/2Sa (1)
whereris the hypocentral distance,Vsis shear wave veloc-ity,ρis the density,uois low frequency spectral level,2is averaged radiation pattern andSais the free surface amplifi-cation (Table 2).
The source radius (R)depends onfc, and the relation is as follows:
R=VsKs/2πfcs (2)
whereKs is model constant, andfcs is corner frequency for the shear wave.
The area of the rupture plane is calculated after obtaining the radius of the source (R) as
A=π R2 (3)
1504 Abd El-Aziz Khairy Abd El-Aal: Ground motion prediction from nearest seismogenic zones, Egypt
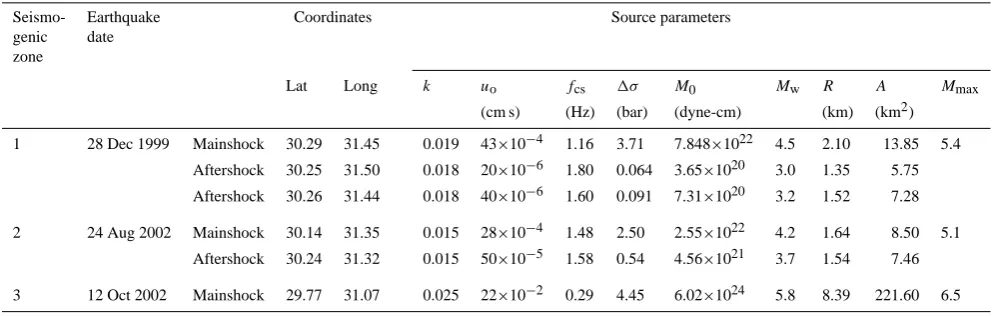
Table 3. Source parameters of the effective earthquakes from different seismogenic zones.
Seismo- Earthquake Coordinates Source parameters
genic date zone
Lat Long k uo fcs 1σ M0 Mw R A Mmax
(cm s) (Hz) (bar) (dyne-cm) (km) (km2)
1 28 Dec 1999 Mainshock 30.29 31.45 0.019 43×10−4 1.16 3.71 7.848×10²² 4.5 2.10 13.85 5.4
Aftershock 30.25 31.50 0.018 20×10−6 1.80 0.064 3.65×10²⁰ 3.0 1.35 5.75
Aftershock 30.26 31.44 0.018 40×10−6 1.60 0.091 7.31×10²⁰ 3.2 1.52 7.28
2 24 Aug 2002 Mainshock 30.14 31.35 0.015 28×10−4 1.48 2.50 2.55×10²² 4.2 1.64 8.50 5.1
Aftershock 30.24 31.32 0.015 50×10−5 1.58 0.54 4.56×10²¹ 3.7 1.54 7.46
3 12 Oct 2002 Mainshock 29.77 31.07 0.025 22×10−2 0.29 4.45 6.02×1024 5.8 8.39 221.60 6.5
inversely proportional to the rigidity and area of the rupture plane:
D=M0/µA (4)
whereµis the shear modulus.
The stress drop is determined using the relationship:
1σ=7M0/16R3 (5)
In turn,M0(expressed in Nm) is directly related to moment magnitudeMwby the Hanks and Kanamori (1979) formula:
Mw=2/3logM0−10.7 (6)
The source parameters, such as the seismic moment (M0), the fault radius (R), the stress drop (1σ), and the moment magnitude (Mw) were determined for the three studied main shocks occurred recently (12 October 1992,Mb=5.8; 28 De-cember 1999, Mb=4.5 and its aftershocks; 24 August 24, 2002,Mb=4.3 and its aftershocks) from the analysis of the S-wave amplitude displacement spectra. A MATLAB code was written to estimate these parameters. The analyzed data for main shocks of 1999 and 2002 earthquakes coming from ten short-period stations installed in hard rock sites and char-acterized by a good signal to noise ratio. They were located within epicentral distances ranging from 30 to 200 km. Data for the 1992 earthquake came from two broadband stations. Table 3 illustrates the estimated model parameters obtained from spectral analysis using nonlinear least square inversion technique.
3.5 Mmaxestimation
Seismic hazard analyses, both probabilistic and determinis-tic, require an assessment of the future earthquake potential in a region. Specifically, it is often necessary to estimate the size of the largest earthquakes that might be generated by a particular fault or earthquake source. It is rare, however,
that the largest possible earthquakes along individual faults have occurred during the historical period. Thus, the future earthquake potential of a fault is commonly evaluated from estimates of fault rupture parameters that are, in turn, related to earthquake magnitude.
The methods available for estimatingMmaxcan be classi-fied according to four procedures: 1) in the case of the pres-ence of paleoseismological studies, the results of these stud-ies indicate the maximum magnitude; 2) when the seismic history is available, the maximum magnitude is estimated using the statistical procedure proposed by Kijko (2004); 3) when consistent data regarding fault type and its total length were available, it is assumed that portions from 20% to 40% of the total fault length could rupture in one earthquake and then the maximum magnitude is estimated; 4) in any remain-ing case, the maximum magnitude is estimated by addremain-ing 0.5 magnitude unit to the largest known magnitude in the zone.
1978; Slemmons, 1977, 1982; Acharya, 1979; Bonilla et al., 1984; Slemmons et al., 1989). Other studies relate magni-tude and seismic moment to rupture length, rupture width, and rupture area as estimated from the extent of surface deformation, dimensions of the aftershock zone, or earth-quake source time functions (Hanks and Wyss, 1972: Hanks and Kanamori, 1979; Reiter, 1990; Wells and Coppersmith, 1994).
In this study, the procedure 3 has been used for estimat-ing the maximum magnitudeMmax for each seismic zone. The relationship between moment magnitude Mw (Hanks and Kanamori, 1979) with the log of the rupture areaAto the largest events (though with a different offset than is gen-erally used for smaller events, Wells and Coppersmith, 1994) could be written as:
Mmax=logA+4.2 (7)
For an infinitely long rupture with a finite widthW, and a constant stress drop, slip should scale asW, so moment scales with areaAas AW, so moment magnitude which is 2/3 of the log of the moment should scale withAas 2/3 logAfor fixedW. Then to get the logAmagnitude area relationship in Eq. (7) for fixedWwe would need stress drop1σ to scale as 1σ∼A1/2. The second scaling relation, the Hanks-Bakun relation (Hanks and Bakun, 2002), used a bilinear scaling relationship of:
Mmax=logA+3.98 A≤557km2 (8) Mmax=4/3logA+3.07 A >557km2 (9) whereAis the total ruptured area that can be calculated by the relation of Fukao and Kikuchi (1987):
A=π (Vrt /2)2 (10)
whereVris the rupture velocity (typicallyVris in the range 0.7–0.9Vs, Vs being the shear wave velocity), t represents the rupture duration. Vrt /2 represents the fault radius (r0). Moreover, 25% as a maximum portion of the fault length that can be ruptured in one earthquake is chosen in this study and this choice is in good agreement with the results from the paleo-seismological studies (Maamoun et al., 1984). The Mmaxexpected from seismogenic zones 1, 2, and 3 are 5.4, 5.1, and 6.5, respectively (Fig. 8).
3.6 Synthetic earthquake model and peak ground acceleration calculations forMmax
Evaluation of the seismic hazard at the investigated sites re-quires the prediction of the strong ground motion that will be generated by the potentially dangerous earthquakes. For the area having limited seismic record, synthetic ground mo-tion models is the alternative (as the study area lacks ground motion records). Modeling of strong motion helps to es-timate future hazard of the region and study the local soil effects in local scale. For the greater Cairo metropolitan
Fig. 8. Location map ofMmaxexpected from effective seismogenic zones in and around Greater Cairo Area.
1506 Abd El-Aziz Khairy Abd El-Aal: Ground motion prediction from nearest seismogenic zones, Egypt
Table 4. The estimated A0 and F0 and the PGA predicted from the effective seismogenic zones at the investigated sites in the area of interest.
Site Long Lat A0 F0 PGA from PGA from PGA from
seismic source 1 seismic source 2 seismic source 3
(Hz) gal(cm/s2) gal(cm/s2) gal(cm/s2)
1 31.40561 30.1504 3.2 5.31 5.85E+01 8.92E+01 2.65E+01
2 31.40721 30.15913 3.45 1.7 6.30E+01 9.62E+01 2.86E+01
3 31.408 30.159 3.23 4.8 5.90E+01 9.01E+01 2.68E+01
4 31.40938 30.17463 2.24 1.6 4.09E+01 6.25E+01 1.86E+01
5 31.4096 30.1645 2.58 1.2 4.71E+01 7.19E+01 2.14E+01
6 31.4096 30.1778 2.32 3 4.24E+01 6.47E+01 1.92E+01
7 31.4096 30.1783 1.87 4.2 3.42E+01 5.21E+01 1.55E+01
8 31.4112 30.1825 2.65 2.3 4.84E+01 7.39E+01 2.19E+01
9 31.4117 30.1624 2.4 1.57 4.39E+01 6.69E+01 1.99E+01
10 31.4137 30.1672 3.25 6.5 5.94E+01 9.06E+01 2.69E+01
11 31.4139 30.1582 1.76 5.5 3.22E+01 4.91E+01 1.46E+01
12 31.4156 30.1574 1.65 2.3 3.01E+01 4.60E+01 1.37E+01
13 31.4178 30.1772 1.46 1.9 2.67E+01 4.07E+01 1.21E+01
14 31.4185 30.172 2.75 1.66 5.02E+01 7.67E+01 2.28E+01
15 31.41965 30.15673 2.52 1.4 4.60E+01 7.03E+01 2.09E+01
16 31.4205 30.188 3.1 4.4 5.66E+01 8.64E+01 2.57E+01
17 31.4215 30.1756 2.75 1.3 5.02E+01 7.67E+01 2.28E+01
18 31.4215 30.188 3.15 1.79 5.76E+01 8.78E+01 2.61E+01
19 31.4226 30.1686 3.33 2.4 6.08E+01 9.28E+01 2.76E+01
20 31.4242 30.1565 3 2.22 5.48E+01 8.36E+01 2.48E+01
21 31.425 30.1558 1.67 1.5 3.05E+01 4.66E+01 1.38E+01
22 31.425 30.1776 2.75 4.3 5.02E+01 7.67E+01 2.28E+01
23 31.4361 30.1688 2.61 1.7 4.77E+01 7.28E+01 2.16E+01
24 31.43656 30.15105 1.64 2.1 3.00E+01 4.57E+01 1.36E+01
25 31.4373 30.1722 2.33 2.3 4.20E+01 6.41E+01 1.91E+01
26 31.4389 30.16055 2.74 3.8 5.01E+01 7.64E+01 2.27E+01
27 31.444 30.1701 2.24 2.1 4.09E+01 6.25E+01 1.86E+01
using MATLAB code which was created for this purpose. The presence of deep sedimentary basin in the studied area suggests that the site response should be important. Conse-quently, the obtained fundamental frequency has lower val-ues (1–8 Hz). However, low frequency ground motions atten-uate more gradually with distance and can excite vibrations in large engineered structures, such as tall buildings and long bridges.
The microtremor measurements were carried out at 27 sites (Fig. 1) distributed within the area of interest. These measurements were acquired using high sensitiv-ity seismometers of Trillium – 40 equipped with three-component digital seismograph data logger (Taurus model of NANOMETRICS): two horizontal motions (in longitudi-nal and transverse directions) and one vertical motion. These noise measurements were recorded for 60 min of continuous recording at every site with sampling rate of 100 Hz. Some of these measurements were repeated during the night to mini-mize artificial noises due to traffic and human activities.
for noise (Parolai et al., 2004). Hence, the number of stable windows could be varying from one site to another within the area but it was greater than 10 windows.
Previous results suggest that the H/V technique is very ef-fective in determining the fundamental frequency at the site of interest, while it gives the lower bound of the amplifica-tion at that site. It is noticed that, F0 values ranges from 1 to 8 Hz. These low values reflect the thick section of soft sediments (fine sands and sabkha) prevailing at the area. The obtained results from background noise are in strongly agree-ment with the obtained results from boreholes data. The PGA values obtained form the synthetic ground motion model us-ing regional seismotectonic parameters vary from 12 gal to 96 gal (Table 4). The site No. 2 gives the highest PGA value of 96 gal by taking hypocentral distance of 7.7 km.
4 Validation of the model parameters
One important step of our analysis includes the validation of the stochastic model parameters at the free-field station that recorded the earthquake and the one derived in the present study which was based on the geometric spreading func-tion for eastern North America derived by Atkinson and Boore (1995). To verify its applicability for Egypt, Abd El-Aal (2010) compared recorded PGA and simulated PGA computed with the used stochastic method for a significant earthquake. On 24 August 2002, at 23:01 local time, one sig-nificant earthquake in greater Cairo occurred, its magnitude wasMb=4.3, focal coordinates were 30.14◦N, 31.35◦E and focal depth was 19 km. The earthquake was felt over a very large area. This event was recorded by strong ground motion stations. Abd El-Aal (2010) simulated the event at location of the station, namely TURA, where strong motion instruments exist, taking into consideration the local site condition of the station. The station was located at coordinates 29.93◦N and 31.33◦E on a limestone hard rock. The recorded and simu-lated PGAs at that station resulting form this earthquake were 2.25 gal (cm/s2) and 2.23 gal (cm/s2), respectively. Compar-isons are made for horizontal-component peak ground accel-erations. The observed motions are in reasonable agreement with the predictions where no amplification or at least very small observed. This is due to the location of station ampli-fication is sited on hard rock. It was found a big similarity between recorded and simulated values. In general, the local match between synthetic computations and the few observa-tions available for the 24 August 2002 earthquake encour-ages the extension of the applicability of our calculations to the rest of the area, where no surveys or observations are available.
Immediately after the 24 August 2002 earthquake, Na-tional Research Institute of Astronomy and Geophysics (2002) announced the effect and damages and recorded PGA related to this event in a technical report submitted to the Egyptian Government. Critical to these estimates is
estab-lishing the similarities/differences between the TURA site (for example), where records of the mainshock exist, and the investigated sites, where there are no mainshock records but where several buildings collapsed during the earthquake. Models based on natural noise measurements and litholo-gies are compared at the two sites (recorded and investigated sites). Below 15 m depth, the sites are nearly identical from a seismic response perspective. Abd El-Aal (2010) concluded, however, that the ground motions were probably higher at the investigated sites than at the TURA site (hard rock), partic-ularly in the range of periods from 0.1 to 1.0 s, and that this difference is mainly due to the softer sediments (higherS slowness) in the upper 15 m at studied sites. A correction to the acceleration map reported by National Research Institute of Astronomy and Geophysics (2002) is essentially required for the whole Greater Cairo Area, taking into consideration the site amplification factors, because the strong ground mo-tion instruments are sited at hard rock sites in and around the greater Cairo where the amplification is negligible in com-parison to the soft sites. For more details about this study, refer to the work of Abd El-Aal (2010).
Generally, amplifications in simulations of rock sites are assumed to be equal to one. However, it is hard to accept the rock sites, at which the 24 August 2002 earthquake was recorded by strong ground motion stations in and around greater Cairo, are representative of the studied area. At such sites, the seismic motions are amplified due to the presence of fractured structure and thin weathered layers. As seen in Table 4, the amplification values for the investigated sites are about 3.45 up to 6.5 Hz, and at higher frequencies, the val-ues change into de-amplification due to the high near surface attenuation.
5 Results and discussion
The fundamental frequency, site amplification, PGA, and pseudo spectral acceleration at the northeastern part of greater Cairo from the effective three different seismogenic zones in and around the area of interest, have been esti-mated (Table 4). The estiesti-mated motions are based on cor-recting motions recorded during the mainshock of 24 August 2002, 7.7 km from the investigated sites for the relative site response of the sites. Shear-wave slownesses and damping based on analysis of background noise measurements at the investigated sites were used in the site response analysis. It was estimated that the motions at the studied sites were prob-ably larger, by factors ranging from 1.46 to 3.45, than that computed and illustrated by National Research Institute of Astronomy and Geophysics (2002).
1508 Abd El-Aziz Khairy Abd El-Aal: Ground motion prediction from nearest seismogenic zones, Egypt
Fig. 9. Panels A, B, and C are the simulated PGA predicted from seismogenic zones 1, 2 ,and 3 at the highest amplification site (site 2),
respectively. Panels E, F, and G are the simulated PGA predicted from the seismogenic zones 1, 2 and 3 at the lowest amplification site (site 13).
Fig. 10. Surface maps show the peak ground accelerations (PGAs), in the area of interest, predicted from the different seismogenic zones.
Fig. 11. Panels A, B, and C are the PSA predicted from the seismogenic zones 1, 2, and 3 at the high amplification site (site 2), respectively.
Panels E, F, and G are the PSA predicted from the seismogenic zones 1, 2, and 3 at the low amplification site (site 13).
of PGA (Fig. 10) due to sources located at an epicentral dis-tance of 13.2, 7.7, and 46.2 km at most shows that the high-est accelerations are concentrated in soft soil sites. The haz-ard maps denote ground motion on surface; thus, the cur-rent analysis considers the amplification of soils or basins responses. These factors can change the ground motions and should be considered in the analysis of any site with ground conditions different from rock.
The pseudo spectral acceleration (PSA) is an important characterization of seismic ground motion in earthquake en-gineering. Response spectra are defined on the basis of the response of a single degree of freedom damped oscillator to the earthquake acceleration (Jennings, 1983). The response spectra of an accelerogram serve a two-fold function char-acterizing the ground motion as a function of frequency and providing a tool for determining earthquake resistant design criteria. The response spectrum (0.5%, 1%, 5%, 10%, and 20% damped pseudo-acceleration) for frequencies of 0.1 to 25 Hz was simulated for the effective seismic sources in and around studied area at high and low amplification sites in the area (Fig. 11). The presented results could be used as a basis for design motion specification of critical structure and for the nonlinear analysis (structural, site response, landslides, and liquefaction).
Earthquakes that are located within a circle of 100 km around the studied area can generate ground acceleration up to 64, 96, and 29 gal (V–VI, VI–VII and IV–V, MSK) in the highly populated area within the studied area
respec-tively. These values are rather high for the existing built en-vironment and could cause severe damage and huge socio-economic losses due to the great socio-economic importance of the area. Distant earthquakes, located as far away as the Gulf of Aqaba, Cyprus and Crete (200±800 km), can gen-erate ground acceleration up to 20 gal (IV) in the area of our interest. The energy in this case is carried by long-period sur-face waves that would be a source of danger mainly for tall buildings, long bridges and lifelines.
From an engineering point of view, infrastructure design-ing is interested in the frequency range 1–10 Hz. So the high ground motion amplification factors at that frequency range play an important role in the seismic disasters. In order to mitigate the seismic risk (earthquake damages) the influence of the site effects (ground motion amplification factor and its corresponding resonance frequency) should be taken into account during the construction.
6 Conclusions
1510 Abd El-Aziz Khairy Abd El-Aal: Ground motion prediction from nearest seismogenic zones, Egypt a quantitative evaluation of the nature of ground shaking at
the investigated area that could be induced by future maxi-mum earthquakes, in order to provide the engineers and plan-ners with complete information on which they must base their decisions. For this purpose, the effective seismogenic zones around the studied area, Mmax, the path and site ef-fects were essentially taken into consideration during calcu-lations. Then, the shear wave excitation from nearest seis-mogenic zones to the northeastern part of the greater Cairo, utilizing stochastic method, was simulated. The stochas-tic method was applied to simulate expected acceleration records from different effective seismogenic zones around the investigated area and to assess the distribution of ground motion within the meizoseismal area of the 24 August 2002 earthquake, where no records are available. The sedimentary basin, in which the investigated area is located in, focuses and amplifies the seismic waves as they pass through. The impedance contrast controls the amount of wavefield ampli-fication within the basin. Reverberation of S-waves within the basin lead to a long duration and a large coda amplitude. It was demonstrated that the ground motion will be consid-erably amplified by the soil layer and this must be taken into consideration during the construction of the buildings. It was concluded that large modifications of seismic waves are due to variations of material properties near the Earth’s surface and by both surface and buried topography. The resulted haz-ard maps are essential for developing useful public policy that may influence land-use planning, building regulations, insurance rate assessment and emergency preparedness.
Acknowledgements. The author is grateful to National Research Institute of Astronomy and Geophysics (NRIAG). The author is also greatly indebted to the Egyptian General Organization for Physical Planning for providing maps, boreholes data and all the useful data sets. The manuscript is highly improved by the suggestions that were given by the reviewers.
Edited by: M. E. Contadakis
Reviewed by: R. Carbonell, G. Karakaisis, and I. Kalogeras
References
Abd El-AaL, A. K.: Simulating Time-Histories and Pseudo-Spectral Accelerations from the 1992 Cairo Earthquake at the Proposed El-Fayoum New City Site Egypt, Acta Geophys., 56, 1025–1042, doi:10.2478/s11600-008-0054-6, 2008.
Abd El-AaL, A. K.: Modeling of seismic hazard at the northeastern part of greater Cairo metropolitan area, Egypt, J. Geophys. Eng., 7, 75–90, doi:10.1088/1742-2132/7/1/007, 2010.
Abdel-Fattah, A. K. and Badawy, A.: Source characteristics and tectonic implications of moderate earthquake, northeastern Cairo prefecture, Acta Geophys. Pol., 52, 29–43, 2004.
Abou Elenean, K. M.: A study of the seismotectonics of Egypt and relation to the Mediterranean and Red Seas tectonics, Ph.D. the-sis, Faculty of Science, Ain Shams University, Egypt, 1997.
Abou Elenean, K. M. and Hussein, H. M.: The October 11, 1999 and November 08, 2006 Beni Suef earthquakes, Egypt, Pure Appl. Geophys., 165, 1391–410, 2008.
Abou Elenean, K. M., Mohamed, A. E., and Hussein, H. M.: Source parameters and ground motion of the Suez-Cairo shear zone earthquakes, Eastern Desert, Egypt, Nat. Hazards, 52, 431–451, 2010.
Acharya, H. K.: Regional variations in the rupture-length magni-tude relationships and their dynamical significance, B. Seismol. Soc. Am., 69, 2063–2084, 1979.
Aki, K.: Local site effects on strong ground motion, Proc. Earth-quake Eng. Soil Dyn. II, 103–155, 1988.
Atkinson, G. M. and Boore, D. M.: Ground motion relations for eastern North America, B. Seismol. Soc. Am., 85, 17–30, 1995. Badawy, A.: Status of the crustal stress as inferred from earthquake
focal mechanisms and borehole breakouts in Egypt, Tectono-physics, 343, 49–61, 2001.
Bonilla, M. G., Mark, R. K., and Lienkaemper, J. J.: Statistical relations among earthquake magnitude, surface rupture length, surface rupture displacement, B. Seismol. Soc. Am., 74, 2379– 411, 1984.
Borcherdt, R. D.: Effects of local geology on ground motion near San Francisco Bay, B. Seismol. Soc. Am., 60, 29–61, 1970. Boore, D. M.: Stochastic simulation of high frequency ground
mo-tions based on seismological models of the radiated spectra, B. Seismol. Soc. Am., 73, 1865–1894, 1983.
Boore, D. M.: Prediction of ground motion using the stochastic method, Pure Appl. Geophys., 160, 635–676, 2003.
Brune, J. N.: Tectonic stress and the spectra of seismic shear waves from earthquakes, J. Geophys. Res., 75, 4997–5009, 1970. Brune, J. N.: Correction, J. Geophys. Res., 76(20), 5002,
doi:10.1029/JB076i020p05002, 1971.
Coppersmith, K. J.: Seismic source characterization for engineering seismic hazard analysis, in: Proc. 4th International Conference on Seismic Zonation, Vol. I, Earthquake Engineering Research Institute, Oakland, California, 3–60, 1991.
Daggett, P. H., Morgan, p., Boulos, F. K., Hennin, S. F., El Sherif, A. A., El Sayed, A. A., Basta, N. Z., and Melek, Y. S.: Seismicity and active tectonics of the Egyptian Red Sea margine and the northern Red Sea, Tectonophysics, 125, 313–324, 1986. EGSMA: Geological map of greater Cairo area with scale
1:100 000, Egyptian Geological Survey and Mining Authority, 1983.
El Hadidy, S.: Crustal structure and its related causative tectonics in Northern Egypt using geophysical data, Ph.D. thesis, Ain Shams University Cairo, Egypt, 1995.
Field, E. H., Jacob, K. H., and Hough, S. H.: Earthquake site re-sponse estimation, a weak-motion case study, B. Seismol. Soc. Am., 82, 2283–2307, 1992.
Field, E. H. and Jacob, K. H.: The theoretical response of sedimen-tary layers to ambient seismic noise, Geophys. Res. Lett., 20, 2925–2928, 1993.
Fukao, Y. and Kikuchi, M.: Source retrieval for mantel earthquakes by iterative deconvolution of long-period P-wave, Tectono-physics, 144, 249–269, 1987.
Hanks, T. C. and Kanamori, H.: A moment-magnitude scale, J. Geophys. Res., 84, 2348–2350, 1979.
62, 561–589, 1972.
Hanks, T. C. and Bakun, W. H.: A bilinear source-scaling model or M-logA observations of continental earthquakes, B. Seismol. Soc. Am., 92, 1841–6, 2002.
Japanese Expert Team: Report of Japan Disaster Relief Team on the earthquake in Arab Republic of Egypt of October 12, 1992, 1993.
Jennings, P. C.: Engineering seismology, in: Proceedings of the International School of Physics “Enrico Fermi”, Course LXXXV, edited by: Kanamori, H. and Boschi, E., 138–173, 1983. Kanai, K.: The requisite conditions for predominant vibration of
ground, B. Earthquake Res. Inst. Tokyo Univ., 31, p. 457, 1957. Kebeasy, R. M.: Seismicity of Egypt, in: Geology of Egypt, edited
by: Said, R., A. A. Balkema, Rotterdam, 51–59, 1990.
Kijko, A.: Estimation of the maximum earthquake magnitude,
mmax, Pure Appl. Geophys., 161, 1655–81, 2004.
Maamoun, M. and Allam, A.: A study of the seismicity of the east Mediterranean region, 7th Ann. Meet., EGS-ESC, Budapest, 1980.
Maamoun, M., Megahed, A., and Allam, A.: Seismicity of Egypt, B. Helwan Inst. Ast. Geophys., 4, 109–160, 1984.
Moustafa, S.: Assessment of ground motion variation for seis-mic hazard mitigation in the vicinity of Cairo metropolitan area, Ph.D. thesis, Ain Shams Univ. Cairo, Egypt, 2002.
Nakamura, Y.: A method for dynamic characteristics estimation of subsurface using microtremor on the ground surface, Quarterly Report of RTRI, 30–1, 25–33, 1989.
National Research Institute of Astronomy and Geophysics: Tech-nical report for August 24, 2002 Cairo earthquake, Internal re-port submitted to Egyptian Government and Egyptian Ministry of Housing, Utilities and Urban Communities, 2002.
Ohnaka, M.: Earthquake-source parameters related to magnitude, Geophys. J. Roy. Astr. S., 55, 45–66, 1978.
Parolai, S., Bindi, D., Boumbach, M., Grosser, H., Milkereit, C., Karakisa, S., and Z¨unb¨ul, S.: Comparison of different site re-sponse estimation techniques using aftershocks of the 1999 Izmit earthquake, B. Seismol. Soc. Am., 94, 1096–1108, 2004. Reiter, L.: Earthquake Hazard Analysis, New York: Columbia
Uni-versity Press, 254 pp., 1991.
Said, R.: The geology of Egypt, Elsevier Publication Amsterdam, 1990.
Schwartz, D. P.: Geology and seismic hazards: moving into the 1990’s, in: Earthquake Engineering Soil Dynamics II – Recent Advances in Ground Motion Evaluation, edited by: Van Thun, J. L., American Society of Civil Engineers Geotechnical Special Publication, New York, 20, 1–42, 1988.
Schwartz, D. P. and Coppersmith, K. J.: Seismic hazards-new trends in analysis using geologic data, in Active Tectonics, National Academy Press, Washington, DC, 215–230, 1986.
Slemmons, D. B.: State of the art for assessing earthquake haz-ard in the United States, in: Report 6 – Faults and earthquake magnitude, US Army Corps of Engineers, Waterways Experi-ment Station, Vicksburg, Mississippi, Miscellaneous Paper, S-73-1, 129 pp., 1977.
Slemmons, D. B.: Determination of design earthquake magnitudes for microzonation, in: Proc. of the Third International Earth-quake Microzonation Conf., US National Science Foundation, Washington, DC, 1, 119–130, 1982.
Slemmons, D. B., Bodin, P., and Zang, X.: Determination of earth-quake size from surface faulting events, Proc. of the International Seminar on Seismic Zonation, Guangzhou, China, State Seismo-logical Bureau, Beijing, 13, 1989.