A Modified Optimization Model for the Location
Selection of Distribution Transformer Used in
Rural Power Network
Chao Tang*College of Engineering Technology, Southwest University, Chongqing, China Email: [email protected]
Shiping Zhu
College of Engineering Technology, Southwest University, Chongqing, China
Jiao Li
University Library, Southwest University, Chongqing, China
Daojun Zhang and Jun Yang
State Grid Chongqing Yongchuan District Power Supply Co. Ltd, Yongchuan, Chongqing, China
Abstract—The rural power networks play a very important role in the power network in China. The rural networks built in the old days are usually not standardized, and therefore, a lot of problems emerged these days. Such as, most of the transmission line is aged, the insulation ability of the transmission line degraded, the household voltage is relatively low, the distribution network line loss is very high, and so on. As the rural power network mainly distributes in the hilly and mountainous land, the altitude of the load points has an important impact to the location of distribution transformer. Meanwhile, because of the existence of the sag, the length of the transmission line is not a straight-line distance. Therefore, this paper modified the traditional optimization model used in the location of distribution transformer, introduced the line correction coefficient (α) which was connected with the sag, improved the line distance computational formula according to the altitude of the load points, and put forward the modified optimization model which is called M-TLOM. Then, an optimized location system of distribution transformer (DTLOS 1.0) based on the Visual Basic 6.0 was developed. The instance analysis indicated that, the modified model could reduce the loss of distribution network.
Index Terms—rural power network, distribution transformer, location selection, model research, modified optimization model
I. INTRODUCTION
The rural power networks play a very important role in the power network in China. The rural networks built in the old days are usually not standardized, and therefore, a lot of problems have emerged these days. Such as, most of the transmission lines have been aged, the insulation
ability of the transmission line has been degraded, the household voltages have been relatively low, and the loss of distribution network lines has been very high, and so on. Moreover, making some branches and connections without any order, current leakage, as well as the fire risk have existed in many places, especially in the rural areas of mainland China. In order to ensure the safety of electrical power supply, the electric network retrofit for the rural areas and the remote peasant households needs to be performed urgently.
As for the rural power network retrofit and new construction, it is quite important to reduce the electrical power loss and keep the normal power supply voltage from the economic and reliable points of view. To keep the deviation of 380V power supply voltage within the rated voltage range of ±7%, and the deviation of 220V power supply voltage within the rated voltage range of-10% to +7%, the distribution transformers are usually located in the center of the load, and the radius of power supply is required to be less than 500m [1-3].
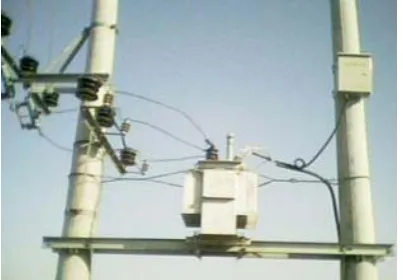
Figure 1. Distribution transformer in rural power network of China
safety (Fig. 1), reliability and economic operation of power networks.
As the core work of distribution transformer planning, the distribution transformer location optimization for rural power network basically indicates the location selection of the distribution transformer according to the local economic and technical index, which has to satisfy the electricity consumption of the load points in the planning area. The goal of the distribution transformer location optimization is to minimize the loss of the distribution network while ensuring the stability and reliability of power supply [4, 5]. The distribution transformer location optimization, which is closely related to the future electricity demand forecasting for the load points, the requirements of the distribution network planning, and the electric power system operating index, has a great influence on the economic benefit of the electric power department and social benefit.
At present, many researches have been done on the location optimization model and the optimization algorithms of the substation [6-9]. The location optimization model of the substation mainly includes the following categories [10-12].
1) According to the difference of planning stage numbers, the substation planning model can be divided into single-stage optimization model and multi-stage optimization model.
2) According to the various disposal methods of the planning for economic and reliable index, the substation planning model can be divided into economic index model and reliable index model.
3) According to the various disposal methods for the uncertainties, the substation planning model can be divided into certain planning model and uncertain planning model (also called flexible planning model).
There are many algorithms for the location optimization of the substation, including unisource continuous location method, multisource continuous location method, mixed integer branch and bound method, random endpoint method, non-linear planning method, simulated annealing algorithm, genetic algorithm, Tabu search method, ant colony algorithm, particle swarm optimization algorithm, differential evolution algorithm, expert system, knowledge-based system and intelligent decision support system and so on [13-15].
In Chongqing province of China, as the rural power network mainly distributes in hills and mountainous regions, the altitude of the load points has an important impact on the location of distribution transformer, at the same time, because of the existence of the sag, the length of the transmission line is not a straight-line distance.
However, less attention has been paid to the location optimization of the distribution transformer. Therefore, it is very urgent to carry on the studies on the field mentioned above. Actually, the location optimization model and optimization algorithm of the distribution transformer can take example by those of the substation.
For the reasons above, this paper has modified the traditional model used for the location optimization of distribution transformer, introduced the line correction
coefficient (α) which was connected with the sag, improved the line distance computational formula according to the altitude of the load points, and put forward the modified optimization model (M-TLOM). Then, we have developed an optimized location system (DTLOS 1.0) of distribution transformer based on Visual Basic 6.0. The instance analysis indicates that, the modified model could reduce the loss of distribution network.
II. LOCATION OPTIMIZATION MODEL OF THE
DISTRIBUTION TRANSFORMER AND ITS MODIFICATION
With certain economic number of the distribution transformer, the geographical position determination is decided by the information of the load points supplied by the distribution transformer, including the geographical position and electricity consumption of the load points. The relation between the distribution transformer and load points can be considered as supply and demand problems, which is to build a mathematical optimization model for the goal of minimizing the annual economic loss of the whole distribution network and under the premise of satisfying the load demand of the whole distribution network. That all the loads are reasonably distributed to all the transformers can be considered as a transportation problem model, but the problem of distributing the load points for the transformer is not a general transportation problem [16]. Firstly, general transportation problems are problems with balanced supply and demand, but considering the demand for the reliability of power supply, the power supply capacity of the transformer must exceed the demand for power supply. Therefore, this transportation problem is a problem that the “supply” is more than the “demand”. Secondly, in general transportation problems, the goods for demand place can be provided by any supplying place, but in the supply problem of the transformer, the supply centre of a load capacity is certain, that is to say, the power can only be supplied by one transformer. Therefore, the supply problem of the transformer is a sole transportation problem of a supplying place [17].
A. Traditional Model of Distribution Transformer Location Optimization
There are various types of transformer location optimization model (hereafter referred to TLOM) has various types. Usually, the following two basic traditional models are used.
(1) TLOM 1
Assume that there are m transformers supplying power for n load points in the planning area, the numbers of the transformers are A1, A2,···, Am, their active capacities are respectively S1, S2,···,Sm, the numbers of the load points are B1, B2,···,Bn, and their load demands are respectively P1, P2,···,Pn. TLOM 1 is as follows, which is presented in a reference [5].
1 1
min
m n ij j iji j
NF
δ β
P d
= =
=
∑∑
1
1 ( 1,2, , ) . .
cos
i m
ij i
j i j nsr
j n
s t
P S
δ
η
φ
=
∈
= =
≤
∑
∑
"
(2) Where NF is the annual economic loss of the distribution network; δij is a symbol parameter (when transformer i supplies power for load point j, δij is 1, otherwise 0); β is the annual economic loss coefficient of the unit load and unit distance of the distribution network; Pj is the power of load point j; nsri is the set of all the load points whose power is supplied by transformer i; Si is the capacity of transformer i; η is the load rate; cosφ is the load power factor.
dij is the distance between transformer i and load point j. Assume that (ui, vi) is the projection coordinate of transformer i and (xj, yj) is the projection coordinate of load point j.
2 2
(
)
(
)
ij i j i j
d
=
u
−
x
+
v
−
y
(3)
(2) TLOM 2
Among the objective functions of TLOM 1, the transmission line loss is in direct proportion to the load capacity of the load point, but actually, the loss of a section of the transmission line is in direct proportion to the quadratic load capacity of the load point, namely
2
2 2 2
2
3 3
P d
NF I R P d P d
s U s
U
ρ ρ β
⎛ ⎞
= =⎜ ⎟ = =
⎝ ⎠ (4)
In the formula, U is the voltage class, ρ is the resistivity, s is the cross section area of the conductor and d is the conductor length.
2 2
(
)
(
)
ij i j i j
d
=
u
−
x
+
v
−
y
(5) Therefore, TLOM 2 is as follow [6],
2
1 1
min
m n ij j iji j
NF
δ β
P d
= =
=
∑∑
(6)
B. Modified Model of Distribution Transformer Location Optimization
In TLOM 1 and TLOM 2, only the relative position of the load points horizontal coordinate and the influence of the future electricity consumption have been considered, but the landform factor of the planning area has been ignored. In fact, in some regions, especially mountainous and hilly regions, the altitude of the load points has a very important impact on the final result of location optimization, so the distance calculation formula should be modified.
Because of the existence of the conductor sag, the conductor arrangement is not according to a straight-line distance. If the parameter is not be modified, the computational cost of the distribution network planning will be far lower than the actual cost. Therefore, the line correction coefficient (α) should be introduced into the objective functions of the modified model.
Here, this paper puts forward a modified-transformer location optimization model (hereafter referred to M-TLOM) [10].
2
1 1
min
m n ij j iji j
NF
δ βα
P d
= =
′
=
∑∑
(7)
1
1 (
1, 2, , )
. .
cos
i m
ij i
j i
j nsr
j
n
s t
P
S
δ
η
φ
=
∈
=
=
≤
∑
∑
"
(8) Where d'ij is still the distance between transformer i
and load point j. Assume that hi is the altitude of
transformer i and zj is the altitude of load point j, then the
computational formula of d'ij is
2 2 2
( ) ( ) ( )
ij i j i j i j
d′ = u −x + v −y + h −z (9)
Because the influence of the altitudes has been considered in the conductor length of the modified model, the optimization model is more appropriate for mountainous or hilly areas, but it has little effect on the line loss reduction of the distribution network planning in flat areas.
C. Model Solution
In the transformer location model solution process, generally, two methods will be chosen: random endpoint method and alternate iterating method. The solution process of the random endpoint method is: selecting m points in k points appropriate for transformation location as the destination points (transformer), then supplying power to n load points. The location result with the least annual economic loss is the optimized location. This method is only appropriate for discrete location optimization, in other words, the final location of the transformer is decided after the determination of the appropriate locations.
location algorithm is generally adopted for the model solution.
The process of model solution is as follows.
First of all, determine partial derivatives with NF, which is,
⎪
⎪
⎪
⎩
⎪⎪
⎪
⎨
⎧
=
∂
∂
=
∂
∂
=
∂
∂
0
0
0
h
NF
v
NF
u
NF
(10) The solution for the single source continuous location model is as follows,2 1 2 1 2 1 2 1 2 1 2 1
(
)
(
)
(
)
(
)
(
)
(
)
i i i i i i n j j j j n j j j n j j j j n j j j n j j j j n j j j jP x
d
u
P
d
P y
d
v
P
d
P z
d
h
P z
d
βα
βα
βα
βα
βα
βα
= = = = = =⎧
⎪
⎪
=
⎪
⎪
⎪
⎪
⎪
⎪
=
⎨
⎪
⎪
⎪
⎪
⎪
⎪
=
⎪
⎪⎩
∑
∑
∑
∑
∑
∑
(11) As we can see in the formulas above, the same term included in every formula, the finite element direct iteration algorithm was used, and the iterative process is,①the initial value of
(
u v h
, ,
)
is the weighted coordinate value of the load point,2 1 (0) 2 1 2 1 (0) 2 1 2 1 (0) 2 1
(
)
(
)
(
)
(
)
(
)
(
)
i i i i i i n j j j n j j n j j j n j j n j j j n j jP x
u
P
P y
v
P
P z
h
P
βα
βα
βα
βα
βα
βα
= = = = = =⎧
⎪
⎪
=
⎪
⎪
⎪
⎪
⎪
⎪
=
⎨
⎪
⎪
⎪
⎪
⎪
⎪
=
⎪
⎪⎩
∑
∑
∑
∑
∑
∑
(12)② the solution of
(
)
(k 1)
,
(k 1),
(k 1)u
+v
+h
+is, 2 ( ) 1 ( 1) 2 ( ) 1 2 ( ) 1 ( 1) 2 ( ) 1 2 ( ) 1 ( 1) 2 ( ) 1
(
)
(
)
(
)
(
)
(
)
(
)
i i i i i i n j j k j j k n j k j j n j j k j j k n j k j j n j j k j j k n j k j jP x
d
u
P
d
P y
d
v
P
d
P z
d
h
P
d
βα
βα
βα
βα
βα
βα
= + = = + = = + =⎧
⎪
⎪
=
⎪
⎪
⎪
⎪
⎪
⎪
=
⎨
⎪
⎪
⎪
⎪
⎪
⎪
=
⎪
⎪⎩
∑
∑
∑
∑
∑
∑
(13) where k jd
is the distance from load point
j
to)
,
,
(
u
(k)v
(k)h
(k), the calculating expression is,
2 ) ( 2 ) ( 2 ) (
)
(
)
(
)
(
j k j k j k kj
u
x
v
y
h
z
d
=
−
+
−
+
−
If the coordinate of transformer is coincide with the
coordinate of the load point, that is 0
=
0
k j
d
⎪ ⎪ ⎪ ⎪ ⎪ ⎪ ⎪ ⎪ ⎩ ⎪ ⎪ ⎪ ⎪ ⎪ ⎪ ⎪ ⎪ ⎨ ⎧ ⎟⎟ ⎟ ⎟ ⎟ ⎠ ⎞ ⎜⎜ ⎜ ⎜ ⎜ ⎝ ⎛ − − − − = ⎟⎟ ⎟ ⎟ ⎟ ⎠ ⎞ ⎜⎜ ⎜ ⎜ ⎜ ⎝ ⎛ − − − − = ⎟⎟ ⎟ ⎟ ⎟ ⎠ ⎞ ⎜⎜ ⎜ ⎜ ⎜ ⎝ ⎛ − − − − =
∑
∑
∑
∑
∑
∑
∑
∑
∑
≠ ≠ ≠ + ≠ ≠ ≠ + ≠ ≠ ≠ + 0 0 0 0 0 0 2 0 2 0 ) 1 ( 0 0 0 0 0 0 2 0 2 0 ) 1 ( 0 0 0 0 0 0 2 0 2 0 ) 1 ( / 1 / 1 / 1 j j j j j j j j j j j j j j j j j j j k j j j j j j j j j j j j j j jj j j
j k j j j j j j j j j j j j j j j j j j j k F d z z P P d z z P d P z h F d y y P P d y y P d P y v F d x x P P d x x P d P x u
βα
βα
βα
βα
βα
βα
βα
βα
βα
βα
βα
βα
(14) Where,⎟
⎟
⎠
⎞
⎜
⎜
⎝
⎛
−
−
−
=
∑
∑
∑
≠ 0 ≠ 0 ≠ 0
0 2 0 2 0 2
0
,
,
j
j j j j j j
j j j j j j j j j j j j
d
z
z
P
d
y
y
P
d
x
x
P
F
βα
βα
βα
(15)
Fj0 is the direction of fast decreasing.
III. CASE ANALYSIS
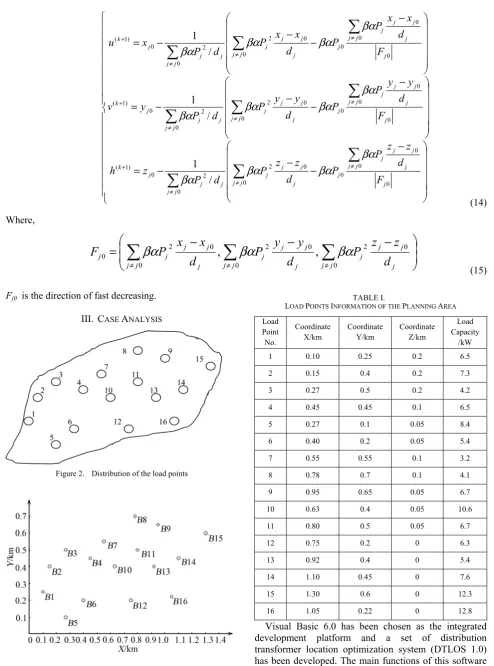
Figure 2. Distribution of the load points
Figure 3. Load points distribution in horizontal coordinate
TABLE I.
LOAD POINTS INFORMATION OF THE PLANNING AREA Load Point No. Coordinate X/km Coordinate Y/km Coordinate Z/km Load Capacity /kW 1 0.10 0.25 0.2 6.5
2 0.15 0.4 0.2 7.3
3 0.27 0.5 0.2 4.2
4 0.45 0.45 0.1 6.5
5 0.27 0.1 0.05 8.4
6 0.40 0.2 0.05 5.4
7 0.55 0.55 0.1 3.2
8 0.78 0.7 0.1 4.1
9 0.95 0.65 0.05 6.7
10 0.63 0.4 0.05 10.6
11 0.80 0.5 0.05 6.7
12 0.75 0.2 0 6.3
13 0.92 0.4 0 5.4
14 1.10 0.45 0 7.6
15 1.30 0.6 0 12.3
16 1.05 0.22 0 12.8
In a distribution supply area of a district, Chongqing Municipality, there are 16 load points with the respective numbers of 1-16. The distribution of the load points is shown in Figure 2. According to the requirements of local distribution network planning, the area needs to be equipped with two distribution transformers. Now, the location selection of distribution transformers is made for the system.
Through establishing a coordinate system, select the origin of the coordinate, obtain the relative geometric position of load points, abscissa X and ordinate Y, and assign the altitude coordinate of the lowest point in the planning area as 0, obtain the altitude coordinate Z of the load points.
The relative coordinate of 16 load points in the power supply system is shown in Figure 3.
The load capacities and coordinate information of various load points in the planning area are shown in Table 1.
The transformer location optimization is analyzed as follows respectively through TLOM 2 and M-TLOM according to the geographical position and electricity consumption of the load points.
A. Location Selection for Traditional Model of Distribution Ttransformer Location Optimization
The optimization results of using traditional model of distribution transformer location optimization and iterating optimization algorithm are shown in Figure 4. As we can see that, transformer A1 (0.249, 0.281) supplies power for load points B1-B7 while transformer A2 (0.992, 0.403) supplies power for load points B8-B16. Combining the actual geographical position, the altitudes of the transformers can be obtained, then the coordinate of transformer A1 becomes (0.249,0.281,0.1) and the coordinate of transformer A2 becomes (0.992, 0.403, 0).
Figure 4. Transformer location results of the traditional model
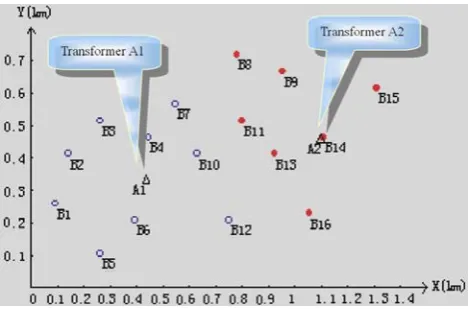
B. Modified Model of Distribution Transformer Location Optimization M-TLOM Location Selection
The optimization results of using traditional model of M-TLOM and iterating optimization algorithm are shown in Figure 5. Considering the altitude influence, the planning result is: transformer A1 (0.441, 0.321) supplies power for load points B1-B7, B10, and B12 while transformer A2 (1.095, 0.445) supplies power for load points B8, B9, B11, and B13-B16.
Combining the actual geographical position, the altitudes of the two transformers can be obtained, then the coordinate of transformer A1 becomes (0.441, 0.321, 0.05) and the coordinate of transformer A2 becomes (1.095, 0.445, 0).
Figure 5. Transformer location results of the modified model
C. Model Solution
The planning area adopts aluminum wires with resistivity ρ of 30 Ω·mm2·km-1 and cross section area s of 25 mm2 as distribution conductors. U is 220V and singlet line distribution is used for the load points, then the economic loss coefficient of the unit load and unit distance of the distribution network is
6 1 2
2 8.26 10 km V
3U s ρ
β= = × − Ω ⋅ − ⋅ −
(16) The computational conductor distance and line loss are shown in Table 2. P'j is line loss electric power of load point j.
The selection of line correction coefficient does not have direct influence on location results, so in order to better explain the loss reduction superiority, the influence of the line correction coefficient α should not be considered when line loss is being compared.
From Figure 2, it can be seen that based on the location results of the traditional model of distribution transformer location optimization, the total line loss of all the load points is
1920.87W
t
P
Σ=
(17)Based on the location results of M-TLOM, the total line loss of all the load points is
1830.99W
mP
Σ=
(18)It is thus clear that compared with the traditional model, the total line loss of all the load points based on the location results of M-TLOM has reduced
1920.87 1830.99 4.68% 1920.87
t m t P P P
P Σ Σ
Σ
− −
Δ = = =
be achieved and the economic benefit of the distribution network can be increased.
TABLE II.
LINE LOSS OF LOAD POINTS Load
Point No.
Load Capacity
Traditional Model
Modified Model α
Leaving αout of Consideration
α In Consideration of α
Bj Pj/kW dj/km P'j/W dj/km P'j/W dj/km P'j/W 1 6.5 0.182 63.64 0.379 132.31 0.417 145.54
2 7.3 0.184 81.12 0.337 148.14 0.370 162.95
3 4.2 0.241 35.18 0.289 42.13 0.318 46.34
4 6.5 0.262 91.52 0.138 48.28 0.152 53.11
5 8.4 0.189 110.23 0.280 162.94 0.308 179.24
6 5.4 0.178 42.96 0.128 30.83 0.141 33.91
7 3.2 0.403 34.11 0.258 21.85 0.284 24.03
8 4.1 0.378 52.54 0.418 57.97 0.459 63.77
9 6.7 0.256 94.74 0.256 94.95 0.282 104.45
10 10.6 0.365 339.20 0.205 190.16 0.225 209.18
11 6.7 0.220 81.90 0.304 112.86 0.335 124.14
12 6.3 0.316 103.56 0.336 110.11 0.369 121.13
13 5.4 0.072 17.36 0.181 43.56 0.199 47.92
14 7.6 0.118 56.18 0.007 3.30 0.008 3.63
15 12.3 0.366 456.87 0.257 320.96 0.283 353.05
16 12.8 0.192 259.76 0.230 310.64 0.252 341.71
Total 114 3.922 1920.87 4.003 1830.99 4.402 2014.10
IV. CONCLUSIONS
With the development of electric power industry and the introduction of electricity market mechanism in our country, power planning is gradually introducing the intellectual technology. As the last link for the electric system reaching households, the distribution network is directly related to the economic benefit of electric power department and electro-safety of households, so more and more attention have been paid to the importance of distribution network planning.
The main conclusions of this paper are as follows, (1) Based on the analysis on the traditional model of distribution transformer location selection, the distance calculation formula should be modified, the sag line correction coefficient should be introduced, and then M-TLOM has been put forward. Visual Basic 6.0 has been chosen as the integrated development platform and a set of distribution transformer location optimization system (DTLOS 1.0) based on the modified model has been developed.
(2) The simulated results show that compared with the traditional model, the total line loss of all the load points based on the location results of M-TLOM has reduced by
4.68%. It is can be seen that to perform the distribution transformer location selection through the modified model can achieve the goal of further reducing line loss of the distribution network and also greatly promote the practicality of the distribution transformer location optimization system based on the modified model.
The research achievements of this paper have important significance for the modification of distribution network location selection and the improvement of the economic operation of distribution network in China.
ACKNOWLEDGMENT
This work was supported by the scientific research funding which is offered by the State Grid Chongqing Yongchuan District Power Supply Co. Ltd, the National Natural Science Foundation of China (Project for Young Scientists Fund, Grant No. 51107103) and the Natural Science Foundation Project of CQ CSTC (Grant No. cstcjjA90013).
REFERENCES
[1] Yang Binwen and Huang Tingting, “Location selection in rural networks and its installation,” Journal of Electric Power, Vol. 24, pp. 142-150, 2009.
[2] Xia Daozhi: Power system analysis (Electric Power Press, China 2008).
[3] Willis H L, Tram H and Engel M V, “Optimization applications to power distribution,” IEEE Computer Applications in Power, Vol. 8, pp. 12-18, 1995.
[4] Seyed AmirHossein Khoshsolat, Nuraini Abdul Aziz and Napsiah Ismail, “Repositioning of electric distribution substations using fuzzy decision making,” Energy Procedia, Vol. 14, pp.476-481, 2012.
[5] Zhou Quan, Study of Intelligent Decision Support System and Its Algorithm for Distribution Network Planning Based on GIS[D]. Chongqing: Chongqing University, 2004. [6] Liu Wenxia, A Study on Urban Distribution Network Planning Optimal Algorithm, Assessment System and Intelligent Technology[D]. Hebei: North China Electric Power University, 2009.
[7] D.M. Jovanovic, “Lanning of optimal location and sizes of distribution transformers using integer programming,” International Journal of Electrical Power & Energy Systems, Vol. 25, pp. 717-723, 2003.
[8] Wang Jingna, Model Research and System Development of Distribution Transformer Location Optimization[D]. Chongqing: Southwest University, 2012.
[9] M.A.S. Masoum, P.S. Moses, and S. Deilami, “Load management in smart grids considering harmonic distortion and transformer derating,” IEEE PES Conference of Innovative Smart Grid Technologies (ISGT), MIDNIGHT EST, pp. 1-7, 2010 January 08.
[10]Michael Kuss, Tony Markel, and William Kramer, Application of Distribution Transformer Thermal Life Models to Electrified Vehicle Charging Loads Using Monte-Carlo Method, the 25th World Battery, Hybrid and Fuel Cell Electric Vehicle Symposium & Exhibition, Shenzhen, China, pp. 1-8, November 5 - 9, 2010.
[12]Zhang Li, “Another Discussion of Energy-saving and Capability Optimization of Distribution Transformer,” Building Electricity, Vol. 01, pp. 7-12, 2010.
[13]G. Gheorghe, C. Gheorghe, and B. Elena-Crenguta, “Strategies for Power/Energy Saving in Distribution Networks,” Advances in Electrical and Computer Engineering, Vo. 10, pp. 61-64, 2010.
[14]N.S. Beniwala, D.K. Dwivedib, and H.O. Guptaa, “Creep life assessment of distribution transformers,” Engineering Failure Analysis, Vol. 17, pp. 1077-1085, 2010.
[15]J.C. Olivares-Galvan, P.S. Georgilakis, and R. Escarela-Pérez, “Selection of copper against aluminium windings for distribution transformers,” IET Electric Power Applications, Vol. 4, pp. 474-485, 2010.
[16]Hongxia Xie, Liping Shi, and Hui Xu, “Transformer Maintenance Policies Selection Based on an Improved Fuzzy Analytic Hierarchy Process,” Journal of Computers, Vol. 8, pp. 1343-1350, 2013.
[17]M. Tavakoli Bina, and A. Kashefi, “Three-phase unbalance of distribution systems: Complementary analysis and experimental case study,” International Journal of Electrical Power & Energy Systems, Vol. 33, pp. 817-826, 2011.
Chao Tang was born in Sichuan, China in 1981. He received the B.Eng. (2004), M.Sc. (2007), and PhD degrees in electrical engineering from Chongqing University, China. Now, he is an associate professor in the College of Engineering and Technology in Southwest University, China. From August 2008 to August 2009, as a visiting Ph.D. student, he started the space charge research works of oil-paper insulation in University of Southampton, UK. His research activities are mainly in the field of on-line monitoring of insulation condition and fault diagnosis for high voltage apparatus.
Shiping Zhu was born in Sichuan, China, 1969. he received his PhD degree in China Agriculture University in 2003. Now he is a professor in the College of Engineering and Technology in Southwest University, China.
His main research interest is Rapid determination using Fourier transform near infrared spectroscopy and computer image processing.
Jiao Li was born in Chongqing, China, 1981, received M.S. degree of compute application from Chongqing University, China in 2008, and received PhD degree in 2012 in the same university. She is a librarian in Southwest University. In the past five years, she has published over 10 technical papers in refereed journals and conference proceedings. Her current research interests include material science and computer security.
Daojun Zhang is now engineer in the State Grid Chongqing Yongchuan District Power Supply Co. Ltd, Yongchuan, Chongqing, China.