Vol. 05, Issue 10 (October. 2015), ||V1|| PP 43-47
Evaluation of Uranium Concentration in Soil Samples of Basrah
Governorates using ICP-Mass Techniques
Thaer M. Salman, and Sawsan Sh. Fleifil
Physics Department , Education College for pure sciences, Basrah University, Basrah, Iraq
Abstract: Naturally occurring radionuclides such as uranium, thorium and their decay products (226Ra, 222Rn) are present in a number of geological settings in Basrah Governorates. The uranium concentration of 78 soil samples using ICP-Mass (inductively coupled plasma mass spectrometry) was found to be ranging from 1.2 ppm in Eastern star1 to 15.75 ppm in AL-Liheise10 i n soils. The results are presented and compared with other studies . The measurements of uranium concentration of soils samples measured had a uranium content of less than 100 ppm, a concentration that characterizes overburden and tailings quality, rather than minable reserves. This paper presents and evaluates the concentration of uranium in Basrah Governorates .The study further reveals that 78 surface soil samples have uranium below detection limit.
Keywords: - Uranium, Soil samples,ICP-Mass, Basrah Governorates
I.
INTRODUCTION
Uranium is a very widely distributed element in the earth's crust, is presented naturally everywhere in soil,sand and rock in various concentration from one place to another. Uranium is a radioactive and chemical element, represents by (U) symbol, and it is a heavy metal with a very high density (18.95 g /cm3, 1.7 times
higher than lead’s density of 11.35 g /cm3). Metallic uranium has a high melting point (1132 oC) and boiling point (4131 0C), has a tensile strength similar to most steels and it is chemically very reactive [1]. Natural
uranium consists of three isotopes. Their concentrations by mass are 238U 99.276%, 235U 0.718% and 234U 0.0056% [2-4].
Uranium is a naturally occurring element with an average abundance in the earth crust of about 2 mg per kg (range 0.1 to 20 mg per kg). It is more abundant than silver or gold. It has adverse effects on the human health. The major health effect of uranium is its chemical toxicity, rather than its radiological hazard [5-8]. The chemical toxicity was thought to be similar to lead. The elemental and isotopic abundances of uranium have been extensively used to explore biogeochemical and physical processes in diverse fields of the Earth
sciences [9]. Low uranium concentrations ([U]) and low abundances of 234U in most natural samples, however, constrain many applications due to measurement limitations. Alpha spectrometry methods have been used to quantify uranium radionuclides for five decades [10,11] but large sample size requirements and the advent of techniques with vastly improved throughput and analytical precision have pushed alpha-counting techniques toward obsolescence.
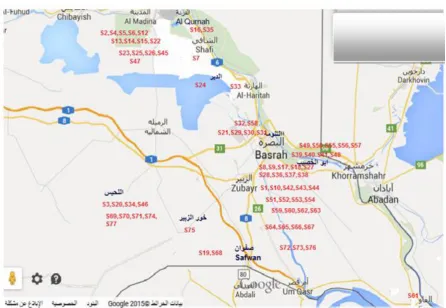
Fig. 1. Basra Governorate, dots represent the places where samples taken from, numbering in station number (S) ( Basra map is from Google earth).
II.
EXPERIMENTAL
TECHNIQUE
In Basra governorate, the samples from 91 stations and locations were collected during April 2014. The measurements of Boron concentration soil samples were carried out by using ICP/Mass method[13]: Inductively Coupled Plasma Mass Spectrometry or ICP-MS is an analytical technique used for elemental determinations. The technique was commercially introduced in 1983 and has gained general acceptance in many types of laboratories. Geochemical analysis labs were early adopters of ICP-MS technology because of its superior detection capabilities, particularly for the rare-earth elements (REEs). ICP-MS has many advantages over other elemental analysis techniques such as atomic absorption and optical emission spectrometry, including ICP Atomic Emission Spectroscopy (ICP-AES), including: Detection limits for most elements equal to or better than those obtained by Graphite Furnace Atomic Absorption Spectroscopy (GFAAS),Higher throughput than GFAAS. The ability to handle both simple and complex matrices with a minimum of matrix interferences due to the high-temperature of the ICP source. Superior detection capability to ICP-AES with the same sample throughput. The ability to obtain isotopic information.
2.1. Plasma-source MS.
improve sensitivity and precision and detection capabilities [14,15]. 2.2. Collection of soil samples
Soil Samples were taken from seventy eight locations of study Basrah Governorates soil, the samples taken from depth 10-15cm. Then the samples were cleaned, dried in an oven at 70 0C for few hours finally they were powdered and sifted by using special sieve, 75 µmin diameter.
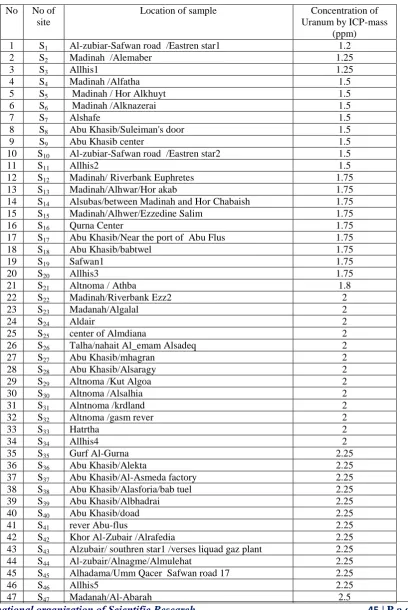
Table 1: Measurments of Uranium concentration in soil samples from different areas of Basrah Governorate by using ICP-Mass
No No of site
Location of sample Concentration of Uranum by ICP-mass
(ppm) 1 S1 Al-zubiar-Safwan road /Eastren star1 1.2
2 S2 Madinah /Alemaber 1.25
3 S3 Allhis1 1.25
4 S4 Madinah /Alfatha 1.5
5 S5 Madinah / Hor Alkhuyt 1.5
6 S6 Madinah /Alknazerai 1.5
7 S7 Alshafe 1.5
8 S8 Abu Khasib/Suleiman's door 1.5
9 S9 Abu Khasib center 1.5
10 S10 Al-zubiar-Safwan road /Eastren star2 1.5
11 S11 Allhis2 1.5
12 S12 Madinah/ Riverbank Euphretes 1.75
13 S13 Madinah/Alhwar/Hor akab 1.75
14 S14 Alsubas/between Madinah and Hor Chabaish 1.75
15 S15 Madinah/Alhwer/Ezzedine Salim 1.75
16 S16 Qurna Center 1.75
17 S17 Abu Khasib/Near the port of Abu Flus 1.75
18 S18 Abu Khasib/babtwel 1.75
19 S19 Safwan1 1.75
20 S20 Allhis3 1.75
21 S21 Altnoma / Athba 1.8
22 S22 Madinah/Riverbank Ezz2 2
23 S23 Madanah/Algalal 2
24 S24 Aldair 2
25 S25 center of Almdiana 2
26 S26 Talha/nahait Al_emam Alsadeq 2
27 S27 Abu Khasib/mhagran 2
28 S28 Abu Khasib/Alsaragy 2
29 S29 Altnoma /Kut Algoa 2
30 S30 Altnoma /Alsalhia 2
31 S31 Alntnoma /krdland 2
32 S32 Altnoma /gasm rever 2
33 S33 Hatrtha 2
34 S34 Allhis4 2
35 S35 Gurf Al-Gurna 2.25
36 S36 Abu Khasib/Alekta 2.25
37 S37 Abu Khasib/Al-Asmeda factory 2.25
38 S38 Abu Khasib/Alasforia/bab tuel 2.25
39 S39 Abu Khasib/Albhadrai 2.25
40 S40 Abu Khasib/doad 2.25
41 S41 rever Abu-flus 2.25
42 S42 Khor Al-Zubair /Alrafedia 2.25
43 S43 Alzubair/ southren star1 /verses liquad gaz plant 2.25
44 S44 Al-zubair/Alnagme/Almulehat 2.25
45 S45 Alhadama/Umm Qacer Safwan road 17 2.25
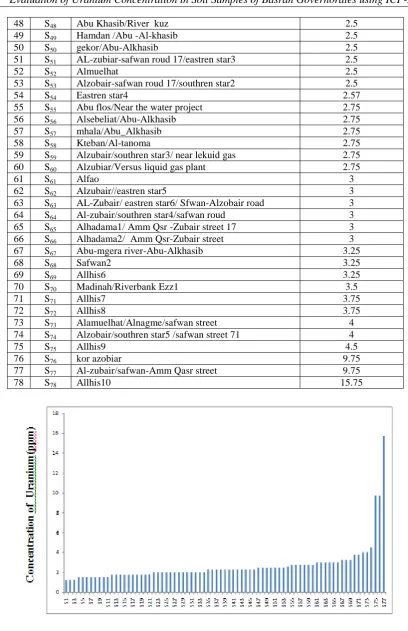
Fig. 2. Uranium Concentration in soil samples from different areasof Basrah Governorate analysis by ICP- mass
III.
RESULTS AND DISCUSSION
The results for Uranium concentration in Soil samples determined in the present study are
48 S48 Abu Khasib/River kuz 2.5
49 S49 Hamdan /Abu -Al-khasib 2.5
50 S50 gekor/Abu-Alkhasib 2.5
51 S51 AL-zubiar-safwan roud 17/eastren star3 2.5
52 S52 Almuelhat 2.5
53 S53 Alzobair-safwan roud 17/southren star2 2.5
54 S54 Eastren star4 2.57
55 S55 Abu flos/Near the water project 2.75
56 S56 Alsebeliat/Abu-Alkhasib 2.75
57 S57 mhala/Abu_Alkhasib 2.75
58 S58 Kteban/Al-tanoma 2.75
59 S59 Alzubair/southren star3/ near lekuid gas 2.75 60 S60 Alzubiar/Versus liquid gas plant 2.75
61 S61 Alfao 3
62 S62 Alzubair//eastren star5 3
63 S63 AL-Zubair/ eastren star6/ Sfwan-Alzobair road 3 64 S64 Al-zubair/southren star4/safwan roud 3 65 S65 Alhadama1/ Amm Qsr -Zubair street 17 3
66 S66 Alhadama2/ Amm Qsr-Zubair street 3
67 S67 Abu-mgera river-Abu-Alkhasib 3.25
68 S68 Safwan2 3.25
69 S69 Allhis6 3.25
70 S70 Madinah/Riverbank Ezz1 3.5
71 S71 Allhis7 3.75
72 S72 Allhis8 3.75
73 S73 Alamuelhat/Alnagme/safwan street 4
74 S74 Alzobair/southren star5 /safwan street 71 4
75 S75 Allhis9 4.5
76 S76 kor azobiar 9.75
77 S77 Al-zubair/safwan-Amm Qasr street 9.75
presented in Table 1 which are collected from some areas in Basrah Governorate, southern Iraq. For the measurement of Uranium concentration level soils, table 1 and Fig. 2, reflect the fact that, there was some less than level of Uranium concentration in this s o i l samples less than from the U.S Environmental Protection Agency (EPA) . The results for these 77 samples categorized i n t o 7 7 locations, from S1 to S77, shown in Fig. 2. Uranium content found maximum (15.75 ppm) in Allhis10 belt and minimum (1.2ppm) was recorded in Al-zubiar /Eastren star1 belt. Out of the 78 soil samples 3 samples recorded higher which are beginning from 9.75 ppm to 15.75 ppm while the 14 soil samples are beginning from 3 ppm to 4.5 ppm but 44 soil samples which are beginning from 2 ppm to 3 ppm and 22 soils samples are beginning from 1.2 ppm to 2 ppm than the prescribed EPA limit (30 ppm). The maximum contaminant level (MCL) of uranium was determined to be about 30 µg/L by U.S Environmental Protection Agency (EPA)[16].it is important to reliably monitor uranium concentrations in environmental samples. Monitoring uranium content in environmental samples is typically performed using alpha spectrometry and inductively coupled plasma atomic emission spectrometry (ICP-AES). However, due to the relatively low sensitivity of these techniques for uranium, a large number of samples and long measurement times are generally required to obtain reliable results. Moreover, the accuracy of alpha spectrometry allows only a rough estimation of uranium levels. Mass spectrometry, which boasts both high sensitivity and accuracy, is considered one of the best alternatives to the aforementioned methods [12,13].
IV.
CONCLUSION
This study is the first Uranium concentration measurement in oil sources that is performed in the area of Basrah Governorate (Iraq). In general, well soil samples within the investigated area are highly mineralized. The correlation analysis revealed the strong positive association between uranium and some chemical compounds in soil samples. Access to safe soil samples is essential to human well being and is a key public health issue. The maintenance of good quality o f soil samples were achieved both by protecting the raw soil samples supply and soil water treatment. It is possible to protect the raw soil samples supply by means of pollution control measures that prevent undesirable constituents from entering the s o i l samples and by good watershed management practices.
REFERENCES
[1] K.D.Cliff, “Postgraduate Radiological Protection Course”,Lec.L173, Harwel,G. Britain,1982. [2] H. H. Mansour, S. Khdar, H.Y.Abdulla, N. Q. Muhamad, M.M.Othman and S.Qader, Radiation Measurements, 40(2005) 544-547.
[3] K. M. Abumurad, Radiation Measurements, 34 (2001) 537-540.
[4] C.Baixeras, B. Erlandsson, Ll. Font and G. Jonsson, Radiation Measurements, 34 (2004), 441-443. [5] Leggett RW (1989) The behavior and chemical toxicity of U in the kidney: a reassessment. Health Phys,
57:365383.
[6] Taylor DM and Taylor SK (1997) Environmental uranium and human health. Rev Environ Health, 12:147-157.
[7] WHO (1998) Guidelines for drinking water quality. Health criteria and other supporting information addendum to Vol. 2, WHO/EOS/98.1. Geneva: World Health Organization.
[8] M.E. Wrenn, P.W. Durbin, B. Howard, J. Lipsztein, J. Rundo,E.T. Still and D.L.Wills, Metabolism of ingested U and Ra. Health Phys. 48(1985) 601-633.
[9] B.Bourdon,S.P.Turner,G. M.Henderson and C.C.Lundstrom,Introduction to U-series geochemi- stry,in Uranium-Series Geochemistry, Rev Mineral.Geochem. 52(2003)1 – 21.
[10] J. W.Barnes, E. J. Lang and H. A. Potratz, Ratio of ionium to uranium in coral limestone, Science 124 (1956)175 –179
[11] M. Ivanovich, and R.S. Harmon (Eds.),Uranium-Series Disequilibrium:Applications to Earth, Marine, and Environmental Sciences, 2nd (1992) 910. Clarendon, Oxford.
[12] R.Schoenberg, F. Von Blanckenburg, Int. J. Mass Spectrom. 242 (2005) 257. [13] G. Chan, C.Y. Hieftje and G. M. Spectrochim. Acta Part B 61 (2006) 642.
[14] A. G. Coedo, T. Dorado, B. J. Fernandez and F. J. Alguacil, Iso- tope dilution analysis for flow injection ICPMS determination of microgram per gram levels of boron in iron and steel after matrix removal. Anal. Chem. 68, (1996) 991–996.
[15] Q. Jin, H. Q. Zhang ,F. Liang, W.J. Yang and Q. Jin, Determination of trace amounts of boron by microwave plasma porch atomic emission spectrometry using an on-line separation and precon- centration technique. J. Anal. Atom Spectrom. 5 (1996) 331–337.
[16] EPA United States Environmental Protection Agency (2000) Office of water, radionuclide's in drinking water.