Genetic Algorithm Coupled with the Neural
Network for Fatigue Properties of Welding Joints
Predicting
Nan Zhou1, Jixiong Zhang1, Ju Feng1, Shaojie Liu2
1. State Key Laboratory of Coal Resources & Safe Mining, School of Mines, China University of Mining & Technology, Xuzhou 221008, China
2. State Key Laboratory for Geomechanics & Deep Underground Engineering, School of Mechanics & Civil Engineering, China University of Mining & Technology, Xuzhou 221008, China
Email: [email protected], [email protected], [email protected], [email protected]
Abstract—The prediction of fatigue life of metal welded joints plays an important role at lower manufacturing costs and reduces accidents for engineering materials, the response of metal welded joints to fatigue properties has highly non-linear, so it is difficult to establish an accurate theoretical model using traditional method to predict its fatigue life. It is appropriate to consider modeling methods developed in other fields in order to provide adequate models for metal welded joints behavior on fatigue properties. Accordingly, a new system predict method, based on a hybrid genetic algorithm (GA) with the Back-propagation neural network (BPNN), for the simultaneous establishment of a predict model structure of fatigue life of metal welded joints and the related parameters is proposed. Based on the self-learning ability and approximation of non-linear mapping capability of the BPNN, by taking the advantages of the powerful ability of global optimization, implicit parallelism and high stability of the GA, the optimal parameters have been automatically determined, we establish a parameter adaptive optimization of GANN model to fit and predict the fatigue life of metal welded joints. GANN establishes the mapping relationship between the fatigue properties of metal welded joints and a variety of influencing factors, having greatly increased the computational efficiency for the fatigue properties of metal welded joints, also had a higher predict accuracy. The superiority of GANN had been tested by the prediction of the fatigue life of welded joints in different process parameters.
Index Terms—fatigue properties; metal welded joints; predict accuracy; neural network approach; genetic algorithm.
I. INTRODUCTION
During the last two decades, with the development of high technology, spot welding is widely used in many different areas, accelerating the development of modern industry to a large extent. However, compared with the base material, because of the characteristics of welding, for overall structure, welded connections will greatly
and then, causing an accident [1]. If the fatigue life of welding spots can be predicted in the early design, and understanding its distribution during the overall structure, the number of welded joints in the actual process, and the way of handling can be adjusted reasonably, so as to improve the fatigue properties of products, lower manufacturing costs and reduce accidents [2–5].
applied into the research on the fatigue life of metal welded joints.
Among the literatures regarding using the ANN as the forecasting tool, most of them focus on Back-propagation Neural Network (BPNN). Yet, there are two shortcomings of it: first, its correction method for weight is Steepest Descent Method. Thus, its correction for the weights is always limited to the searching space of the steepest descent method and cannot jump off, which may cause worse or early convergence. Second, it quite relies on the parameter setup, such as the number of hidden layers, the neuron number in hidden layers, the learning rate and inertia quantity, etc. However, according to different problems, it always has different set-up methods. Even many literatures have mentioned the settings of networks, yet no one has found an optimal network structure for sure.
As a result, based on the above two weaknesses, some researchers suggest Genetic Algorithms (GAs) to replace the steepest descent method used in BPNN, and others propose proceed the network training based on the optimal network structure produced by the strong searching capacity of GA. GA was first published by John Holland from University of Michigan in 1975. It imitates the genetic evolution of creatures and sets up a system with nature evolution mechanism: crossover, mutation and reproduction. It performs very well in searching the optimal solutions, so it is often used along with BPN in order to have more accurate forecasting results. Many researchers [9-15] used to combine GA and ANN and the results found out that they had better properties compared to traditional ANN.
Driven by importance of predicting fatigue properties of metal welded joints, based on the self-learning ability and approximation of non-linear mapping capability of the BPNN, as well as the powerful ability of global optimization of the GA, the research through optimizing the BPNN by GA, established GANN, which can overcome the disadvantages of BPNN, such as easily falling into local minimum, causing oscillation effects, etc [16, 17]. Through the establishment of the mapping relationship between the fatigue properties of metal welded joints and various parameters, GANN is used to predict the fatigue life of metal welded joints. Section 2 describes a procedure to use the GA to estimate the parameters of BPNN and introduces the evaluating performance index. Section 3 presents the detailed empirical design and its results. Section 4 concludes and discusses the implication of these findings.
II. METHODOLOGY
A. Back-propagation Neural Network
As a linear dynamic system, ANN stores non-linear information into the connection weights of each
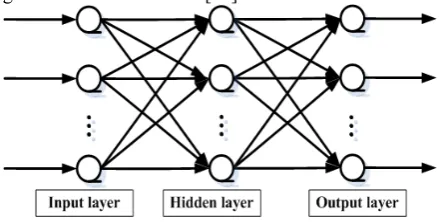
node step by step, with good fault-tolerance and anti-jamming capability, as well as a series of advantages of memory, association, adaption and good robustness. Recently, BPNN (Error Back-propagation) is most commonly used (Fig. 1) [18]. However, because derived from the gradient method, it is easy for BP algorithm to fall into local minimum points, have slow convergence and oscillation effect, which greatly limits its application in engineering [19], resulting in a number of improved algorithm based on BPNN [20].
Figure 1. Illustrative structure of the Back-propagation Neural Network
B. Genetic Algorithm
Genetic algorithm is a method, which simulates the natural evolution, to search the optimal solution [21, 22]. Based on Darwin’s survival of the fittest, the evolution of the principle of survival of the fittest, it repeatedly uses the basic operations of genetics on the groups containing the feasible solution, and constantly creating new groups, so that population evolving, which draws from natural selection and natural genetic mechanism in nature. Meanwhile, in order to achieve the optimal solution to meet the requirements, it searches for the optimal individuals by global parallel searching technology. For GA, it has the advantages of global convergence and the initial value independence, a faster convergence rate; it does not require the objective function to be continuous, and differentiable. In view of these advantages, through GA coupled with BPNN, GANN can be established, and used to solve engineering problems [23, 24].
C. Steps of Genetic Algorithm Coupled with the Neural Network
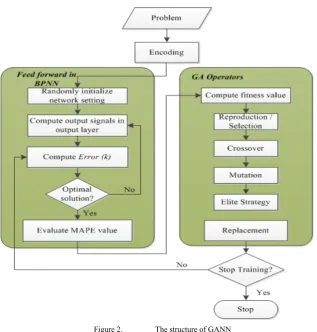
Figure 2. The structure of GANN
Step.1 Based on 3-layer BP network, initial training is
done towards the samples, to determine the range of network connection weight (the basic solution space of network connection weight) [umin −δ1,umax−δ2] (δ δ1, 2 the adjustment parameters).
Step.2 Encode the basic solution space, in which, the
generated code string are composed of control code and weight coefficient code. Control code is mainly for controlling the number of hidden nodes and the string length
l
1are determined by 0.5-1.5 times of the number of input nodes, while the weight coefficient code is mainly the connection weight of the controlled network. String length l2 = × + + × +m l1 l1 l1 n n (m: the number of input nodes; n: the number of output nodes).Step.3 Randomly generate a group, consisting L
individuals, each individual consists of two parts, the first part is 0-1 string, whose length is l1, and the other is a uniform distribution at a range of [umin−δ1,umax−δ2], consisting l2 random numbers.
Step.4 Definite the fitness functions as the Eq. (1), and
calculates the degree of fitness for each individual in a group.
1
2
1 ( , , , )
ˆ [ ( ) ( )]
N n
k
F w v r
y t y t θ =
−
∑∑
(1)operations, while directly copied to the next generation. Other individuals of the group are selected by using roulette wheel.
Step.5.2 Crossover operator. Cross the selected
individuals with the probability
p
c , suppose crossingbetween the individual i and the individual
i
+
1
, then the crossover operator are as Eq. (2).1
1 1
1 1
(1 ) (1 )
t t t
i i i i i
t t t
i i i i i
X c X c X
X c X c X
+
+ +
+ +
⎧ = ⋅ + − ⋅
⎪ ⎨
= − ⋅ + ⋅
⎪⎩ (2) where, t
,
t1i i
X
X
+ are individuals before crossing,1 1
1
,
t t
i i
X
+X
++ are individuals after crossing,c
i are randomuniform distribution at a range of [0, 1].
Step.5.3 Mutation. Mutate the selected ith individual
with the probability of
p
m, then the crossover operator as Eq. (3).1
t t
i i i
X + =X +c (3) where, t
i
X are individual before crossing, Xit 1
+ are
individuals after crossing,
c
i are random uniformdistribution at a range of [ min 1 , max 2 ]
t t
i i
u − −δ X u + +δ X , this will ensure that the mutation of individuals to still be the searching range.
Step.7 According to the individual decoding with
highest degree of fitness in the K generation, the corresponding network connection weight and the number of hidden nodes can be arrived, then, testing the generalization of the model by inputting the detection samples. The illustrative structure of GANN is shown as Fig. 3.
Figure 3. Illustrative structure of GANN
where, j=1,2, ,⋅⋅⋅m are the input nodes of the Basic GANN, k=1,2, ,⋅⋅⋅n are the input nodes of the Modified GANN.
D Evaluating Performance Index
In order to evaluate the accuracy and properties of different forecasting models, this research adopts three evaluating indexes: Percentage Error, Mean Absolute Percentage Error, and Mean Absolute Deviation. The calculating formulas are shown as Eqs. (4), (5) and (6).
1. PE (Percentage Error) 100%
k k
k
F A
PE A
−
= × (4)
2. MAPE (Mean Absolute Percentage Error)
1
1 n 100%
k k
k k
F A
MAPE
n = A
−
=
∑
× (5)3. MAD (Mean Absolute Deviation)
1
1 n
k k
k
MAD F A
n =
=
∑
− (6)where
F
k is the expected value for No.k
, Ak is the actual value for No. k, n is the number of Experiments.The smaller the values of the above three indexes are, the better the forecasting models will be; smaller values
means that the calculating results are closer to the historic data.
III.EXPERIMENTAL DESIGN
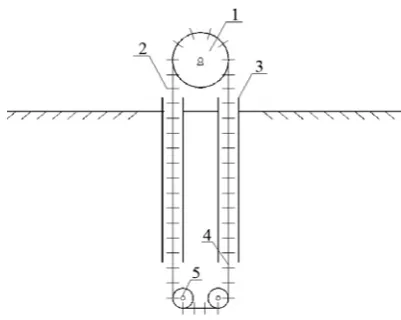
Figure 4. The automatic discharge solid materials system. Note: 1–driving wheel, 2–tray, 3–convey hole, 4–wire rope, 5–guide
wheel.
Fig.4 is an automatic discharge system, which can discharge some solid materials (Gangue, Crushed rock, etc.) from the ground surface to underground, and the applied materials of the system are made by aviation aluminum 7075-T651, the experimental data are use to do the welding experiments, using FSW-3LM-015 type friction stir welding machine. By changing the process parameters to get the best welded joints, and low-cycle fatigue behavior, the data can be obtained from the fatigue experiment. And meanwhile, taking the typical rotation speed of the stir head trs, the speed of welding
s
w , the stress level Δεmax 2 as the dependent variables, the fatigue life N as the independent variable, the experimental data are shown in Table 1 [6].
TABLE I. EXPERIMENTAL DATA
No. trs ( min )r 1
−
⋅ ( min )1
s
w mm⋅ − Δεmax 2 (%) Experimental results N time
A Data Preprocessing Stage
Because of the non-linear system, it has a great relation for the initial value, whether the learning can meet the local and the results of convergence, which requires the state of each neuron be close to zero, when inputting the accumulation of the initial weight value, normalizing the input samples, so that those relatively large input of sample data are still falling into the position where the gradient is large for the transfer function. Using Eq. 7 for normalization, so that all the sample data are at the range of [0, 1].
min
max min
ˆ x x x
x x
− =
−
(7)
where, xmin is the minimal of the test data, xmax is the maximal one, and . ˆx is the option for itself.
B Construction of GANN
Constructing the method based on GANN, first of all, the basic solution space for the connection weight of network is established, with 3-layer BPNN. Input training
samples, according to the previous Step. 1, and obtain
min, max
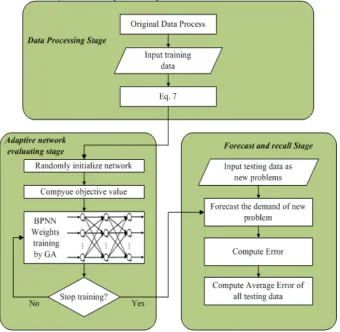
u u , at the same time, the solution space for the connection weight and the searching range for hidden nodes are initially set, set the initial population L=100, during the evolution process of GA, the total generation of evolution K=100, the crossover probability pc=0.8, the mutation probability pm =0.01. After the calculation of the prediction error, the modified of genetic BP neural network is structured, initially setting the solution space of the connection weight, the number of searching range for hidden nodes are [4, 12], the initial population L=100, the total generation of evolution K=100, the crossover probability pc =0.8, the mutation probability pm =0.01. Utilizing the predict of life expectancy trends of the metal welded solder joints based on a combination of GANN, two combined networks are separately trained. An overall architecture of the stages is shown in Fig. 5.
Figure 5. Framework of three main stages in the research.
C Empirical Results
After simulating fifteen groups of test data
0 10 20 30 40 50 60 70 80 1
1.2 1.4 1.6 1.8
Generation
S
um
-S
quar
ed E
rr
o
r
0 10 20 30 40 50 60 70 80
0.4 0.6 0.8 1
Generation
F
it
tnes
s
Figure 6. Error iterative and Fitness curve & Error of approximation curve of GANN
In order to facilitate the comparison of methods, the
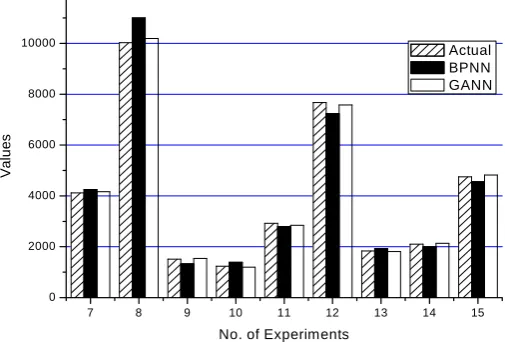
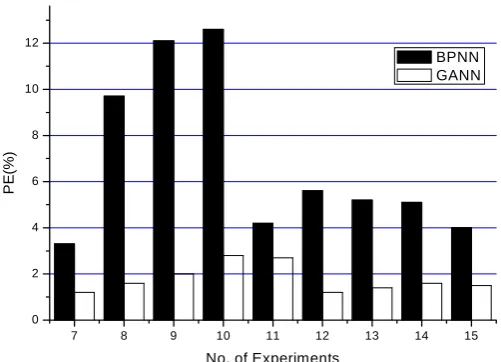
research results done by the BPNN are simultaneously given by the research, the comparison with the work done by GANN are also shown in Table 2, Fig. 7 and Fig. 8.
TABLE II. ERROR COMPARISON OF THE PREDICT RESULTS
No. Experimental results
N time
BPNN GANN Value PE (%) Value PE (%) 7
8 9 10 11 12 13 14 15
4116 10028
1514 1233 2922 7670 1837 2100 4753
4252 11003
1330 1388 2799 7240 1932 1993 4562
3.3 9.7 12.1 12.6 4.2 5.6 5.2 5.1 4.0
4164 10192
1545 1198 2843 7577 1811 2133 4823
1.2 1.6 2.0 2.8 2.7 1.2 1.4 1.6 1.5 MAPE (%) 6.867 1.778
MAD 266.2 64.33
GANN reduces the MAPE and MAD of BPNN from 6.867% to 1.778% and from 266.2 to 64.33 separately. This indicates GANN can improve the predict accuracy of the BPNN. Based on the above results, it is clear that, compared with BPNN, the results of GANN are
obviously better, which reduces the predict error effectively, and for the fatigue life of welded joints, the predict values fit well with the actual values, and shows a good prediction, fully demonstrating the advantages of GANN.
7 8 9 10 11 12 13 14 15
0 2000 4000 6000 8000 10000
Val
u
es
No. of Experiments
Actual BPNN GANN
7 8 9 10 11 12 13 14 15 0
2 4 6 8 10 12
PE
(%
)
No. of Experiments
BPNN GANN
Figure 8. Comparison of the PE between BPNN and GANN
IV CONCLUSIONS AND FUTURE RESEARCH
In this research, we presented a new model to help fatigue properties of metal welded joints predicting. The automatic discharge solid materials system can follow this forecasting to make plans and to cooperate related manufacture activities such as material management and manufacture scheduling.
Based on the improved method of BPNN by GA, this paper used the good global search ability of GA, to compensate the defects of BPNN, which is easy to fall into local minimum point, and considering the predict error of a single GANN. A combined network is designed, as well as a modified GANN is trained by the error samples, improving the predict accuracy. After using the method to the research on the fatigue properties of welded joints, the experimental result shows that the performance of GANN is superior to Back Propagation Network. Also, the model can obviously provide a very effective and accurate forecast. It indicated that: GANN is a kind of possible way, which can be used to predict the fatigue life of metal welded joints, especially for the real context of multiple factors involved in the complex process of combination. In establishing the mapping relationship between the fatigue properties of metal welded joints and a variety of factors, the method of GANN has shown its superiority, providing a new ideas and theoretical basis for the research on the fatigue properties of metal welded joints.
For future study, we will research the relation between the fatigue properties of metal welded joints and the practical factors, hoping to set up a more accurate mathematical model, and propose a new heuristic algorithm to improve the predict accuracy. The relation
ACKNOWLEDGMENT
This work was supported by the Innovation Project of graduate students of Jiangsu Province (CXZZ11-0308), National Natural Science Foundation of China (51074165 and 50834004) and the Fundamental Research Funds for the Central Universities (JGX101870).
REFERENCES
[1] J. L. Otegui. “Fatigue damage leads to a serious traffic accident,” Engineering Failure Analysis, vol. 9, iss. 1, pp.
109-122, February 2002.
[2] H. Adib, J. Gilgert, and G. Pluvinage. “Fatigue life duration prediction for welded spots by volumetric method,” International Journal of Fatigue, vol. 26, iss. 1,
pp. 81-94, January 2004.
[3] G. Kepplinger, F. Ruprechter, G. Stangl, A. Dunst, and M. Hofer, “Life fatigue estimation of welding seams based on notch strains,” International Journal of Fatigue, vol. 28,
iss. 5-6, pp. 547-553, May-June 2006.
[4] M. Vural, A. Akkuş, and B. Eryürek, “Effect of welding nugget diameter on the fatigue strength of the resistance spot welded joints of different steel sheets,” Journal of Materials Processing Technology, vol. 176, iss. 1-3, pp.
127-132, June 2006.
[5] Ó. Martín, M. López, P.D. Tiedra and M.S. Juan: Prediction of magnetic interference from resistance spot welding processes on implantable cardioverter-defibrillators. Journal of Materials Processing Technology. vol. 206, pp. 256–262, 2008.
[6] J. M. Park, and H. T. Kang, “Prediction of fatigue life for spot welds using back-propagation neural networks,”
Materials & Design, vol. 28, iss. 10, pp. 2577-2584, 2007. [7] D. Yan, D. Zhou, C. Huang and Z. Wu, “Modeling and
predicting of LCCC solder Joint 3-D shape by minimum potential energy theory,” Journal of Guilin University of
Journal of Materials processing technology, vol. 202, pp.
464–474, 2008.
[9] V. Srinivas, and K. Ramanjaneyulu, “An integrated approach for optimum design of bridge decks using genetic algorithms and artificial neural networks,” Advances in Engineering Software, vol. 38, iss. 7, pp. 475-487, July
2007.
[10]K.-j. Kim, and I. Han, “Genetic algorithms approach to feature discretization in artificial neural networks for the prediction of stock price index,” Expert Systems with Applications, vol. 19, iss. 2, pp. 125-132, August 2000.
[11]A. Sedki, D. Ouazar, E. El Mazoudi, “Evolving neural network using real coded genetic algorithm for daily rainfall–runoff forecasting Original Research Article,”
Expert Systems with Applications, vol 36 (3),
pp.4523-4527, 2009.
[12]K. J. Kim, and I. Han, “Genetic algorithms approach to feature discretization in artificial neural networks for the prediction of stock price index,” Expert Systems with Application, vol. 19, pp. 125–132, 2000.
[13]R. J. Kuo, and J. A. Chen, “A decision support system for order selection in electronic commerce based on fuzzy neural network supported by real-coded genetic algorithm,” Expert Systems with Application, vol. 26, pp. 141–154, 2004.
[14]R. S. Sexton, and J. N. Gupta, “Comparative evaluation of genetic algorithm and back propagation for training neural networks,” Information Sciences, vol. 129, pp. 45–59, 2000.
[15]D. Srinivasan, “Evolving artificial neural networks for short term load forecasting,” Neural Computing, vol. 23,
pp. 265–276, 1998.
[16]F. Chen, “Genetic algorithms and artificial neural network-Training artificial neural network by EGA-GDR,” Journal of Chemical Industry and Engineering, vol. 47, pp.280–
286, 1996.
[17]L.K. Charles, Y. lgor and N. Keith, “Solving inverse initial–value boundary–value problems via genetic algorithm,” Engineering Application of Artificial Intelligence, vol. 13, pp. 625–633, 2000.
[18]S. Pierre, “Application of artificial intelligence techniques to computer network topology design,” Engineering Applications of Artificial Intelligence, vol. 6, iss. 5, pp.
465-472, October 1993.
[19]P. T. Quinlan, “Structural change and development in real and artificial neural networks,” Neural Networks, vol. 11,
iss. 4, pp. 577-599, June 1998.
[20]R. J. Kuo, “Multi-sensor integration for on-line tool wear estimation through artificial neural networks and fuzzy neural network,” Engineering Applications of Artificial Intelligence, vol. 13, iss. 3, pp. 249-261, June 2000.
[21]J. Rezaeian, N. Javadian, R. Tavakkoli-Moghaddam, F. Jolai, “A hybrid approach based on the genetic algorithm
and neural network to design an incremental cellular manufacturing system,” Applied Soft Computing, Vol 11
(6), pp. 4195-4202, 2011.
[22]S. Chatterjee, A. Bhattacherjee, “Genetic algorithms for feature selection of image analysis-based quality monitoring model: An application to an iron mine,”
Engineering Applications of Artificial Intelligence, Vol 24
(5), pp. 786-795, 2011.
[23]Y. V. Pehlivanoglu, O. Baysal, “Vibrational genetic algorithm enhanced with fuzzy logic and neural networks,”
Aerospace Science and Technology, vol. 14 (1), pp. 56–64,
2010.
[24]C.W.M. Yuen, W.K. Wong, S.Q. Qian, L.K. Chan, E.H.K. Fung, “A hybrid model using genetic algorithm and neural network for classifying garment defects” Expert Systems with Applications, Vol 36 (2), pp. 2037-2047, 2009.
[25]H. M. Gomes, A. M. Awruch, and P. A. M. Lopes, “Reliability based optimization of laminated composite structures using genetic algorithms and Artificial Neural Networks,” Structural Safety, vol. 33, iss. 3, pp. 186-195, May 2011.
Nan Zhou is currently a Ph.D. candidate at the State Key Laboratory of Coal Resources & Safe Mining and School of Mines of China University of Mining & Technology (CUMT). He has several journal publications in solid materials in mining. His research interests include mine engineering mechanics, solid materials in mining.
Jixiong Zhang received a Ph.D. in Mechanics at the School of Sciences of CUMT in 2008. He is currently a Ph.D. supervisor at the State Key Laboratory of Coal Resources & Safe Mining and School of Mines of CUMT. He has already 20 journal publishes. His research interests include mine engineering mechanics, solid materials in mining.
Feng Ju is currently a Ph.D. candidate at the State Key Laboratory of Coal Resources & Safe Mining and School of Mines of China University of Mining & Technology (CUMT). He has several journal publications in solid materials in mining. His research interests include mine engineering mechanics, solid materials in mining.