Nitrous Oxide
Chamber
Methodology
Guidelines
Acknowledgements
This manual has been commissioned by the New Zealand Government to support the goals and objectives of the Global Research Alliance on Agricultural Greenhouse Gases, but its contents rely heavily on the contributions from individual scientists in Alliance member countries. The
participation of these scientists and their institutions is gratefully acknowledged, and warm thanks are extended for their contribution to this document.
We thank the two international peer reviewers for their expert review and invaluable comments on these Guidelines and Dave Hansford for professional editorial services.
Publisher details
Ministry for Primary Industries Pastoral House, 25 The Terrace
PO Box 2526, Wellington 6140, New Zealand Tel: +64 4 894 0100 or 0800 00 83 33 Web: www.mpi.govt.nz
Copies can be downloaded in a printable pdf format from http://www.globalresearchalliance.org
The document and material contained within will be free to download and reproduce for educational or non-commercial purposes without any prior written permission from the authors of the individual chapters. Authors must be duly acknowledged and material fully referenced. Reproduction of the material for commercial or other reasons is strictly prohibited without the permission of the authors.
ISBN 978-0-478-40584-2 (print) ISBN 978-0-478-40585-9 (online)
Disclaimer
Nitrous Oxide Chamber
Methodology Guidelines
Version 1.1
Editors
C. A. M. de Klein
AgResearch, Invermay Research Centre, Private Bag 50034, Mosgiel, New Zealand
M. J. Harvey
NIWA, Private Bag 14-901, Kilbirnie, Wellington, New Zealand
Nitrous Oxide Chamber Methodology Guidelines Cecile de Klein & Mark Harvey (eds)
1 Introduction – Cecile de Klein & Mark Harvey (New Zealand) 2 Chamber design – Tim Clough (New Zealand) et al.
3 Deployment protocol – Philippe Rochette (Canada) et al.
4 Air sample collection, storage and analysis – Frank Kelliher (New Zealand) et al. 5 Automated GHG measurement in the field – Peter Grace (Aucstralia) et al. 6 Data analysis considerations – Rod Venterea (US) et al.
Table of Contents
List of Figures 6
List of Tables 7
List of Corrected Errata 7
EXECUTIVE SUMMARY 8
Background 8
Minimum requirements 10
Chamber design ... 10
Deployment protocol ... 11
Sample collection, storage and analysis requirements ... 12
Automated chambers ... 13
Data analysis ... 14
Data reporting ... 14
Safety precautions... 14
Evolving Issues 14 Chamber design ... 15
Deployment protocol ... 15
Data analysis ... 15
1 INTRODUCTION 16 Key discussion points 17 References 18 2 CHAMBER DESIGN 19 Summary table 20 2.1 Introduction 22 2.2 Materials and components 22 2.3 Dimensions 23 2.4 Venting 24 2.5 Seals 27 2.6 Insulation and temperature control 28 2.7 Sampling port 29 2.8 Allowing for plant effects 29 2.9 Headspace mixing 30 2.10 Summary 31 References 31 3 DEPLOYMENT PROTOCOL 34 3.1 Introduction 40 3.2 Sources of uncertainty 40 3.3 Individual chamber deployment 42 3.3.1 Chamber installation and site disturbance ... 42
3.3.2 Chamber deployment duration ... 43
3.3.3 Sequence and grouping of chamber measurements ... 43
3.3.4 Headspace air sampling... 44
3.3.5 Ancillary measurements ... 45
3.4 Cumulative emissions at the plot/field scales 46 3.4.1 Temporal integration ... 46
3.4.2 Spatial integration... 49
3.5 Conclusion 52
4 AIR SAMPLE COLLECTION, STORAGE AND ANALYSIS 56
4.1 Introduction 58
4.2 Collection and storage of air samples 58
4.3 Gas chromatography 61
4.4 Electron capture detector 64
4.5 Calibration of gas chromatography systems 65
4.6 Processing gas chromatography data 66
4.7 Relating N2O sample analyses to N2O fluxes 68
References 71
5 AUTOMATED GREENHOUSE GAS MEASUREMENT IN THE FIELD 73
Summary table 74
5.1 Introduction 78
5.2 Diurnality 78
5.3 Sample frequency 79
5.4 Operating principles 81
5.5 Chamber design 84
5.6 Sampling unit 85
5.7 Conclusion 91
References 91
6 DATA ANALYSIS CONSIDERATIONS 95
Summary table 96
6.1 Selection and use of a flux calculation (FC) method 98
6.1.1 Basic considerations ... 98
6.1.2 Conventional FC schemes ... 100
6.1.3 Advanced FC schemes ... 104
6.1.4 Criteria for selecting FC scheme for particular applications ... 107
6.2 Estimation of cumulative emissions using non-continuous flux data 108 6.2.1 Accounting for spatial variability... 108
6.2.2 Accounting for temporal variability ... 109
6.3 Assessment of minimum detectable flux (MDF) 110 6.4 Statistical considerations for analysing inherently heterogeneous flux data 110 6.4.1 Assessment of normality and transformation... 110
6.4.2 Estimating the mean and variance of log-normally distributed data ... 111
6.4.3 Hypothesis testing ... 113
6.5 Estimation of emission factor (EF) 116 6.6 Conclusion 117 6.7 References 117 7 HOW TO REPORT YOUR EXPERIMENTAL DATA 122 7.1 Introduction 126 7.2 Information to be reported for generating emission factors 126 7.2.1 Experimental site ... 126
7.2.2 Weather and soil conditions ... 127
7.2.3 For N2O emissions determination ... 128
7.2.4 Crop or pasture information ... 128
7.2.5 Treatments ... 129
7.2.6 Statistical analysis ... 129
7.3 Information required to evaluate process-based models 129 7.3.1 Statistical analysis ... 130
8 HEALTH AND SAFETY CONSIDERATIONS 131
10 APPENDICES 137
10.1 Appendix 1 – Water vapour corrections 137
10.2 Appendix 2 – Calculating GC performance (example) 139 10.3 Appendix 3 – Calculating the minimum detection limits of flux calculation
methods (Example) 142
List of Figures
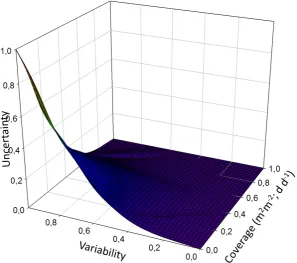
Figure 2.1: Optimum vent tube diameter and length for selected wind speeds and enclosure volumes as described by Hutchinson & Mosier (1981), extracted from Parkin and Venterea (2010) _____________ 26 Figure 3.1: Conceptual representation of the impact of variability (spatial or temporal) and coverage (spatial or temporal) on the uncertainty of the soil cumulative N2O emission estimates. Maximum
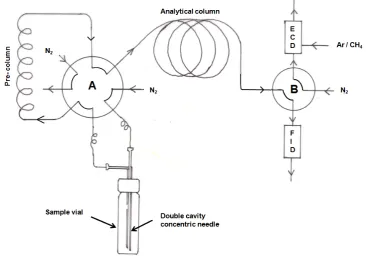
values were attributed the value of “1” __________________________________________________ 41 Figure 4.1: A (12 mL) vial evacuation system, including the pump, vacuum gauge, manifold, valves and needles for penetrating septa, as shown in the upper half of the manifold. The system shown is that used at the Agriculture, Food and Biosciences Institute in Northern Ireland (AFBI) _________________ 59 Figure 4.2: Simplified plumbing diagram, showing the gas sampling valves in the inject mode as
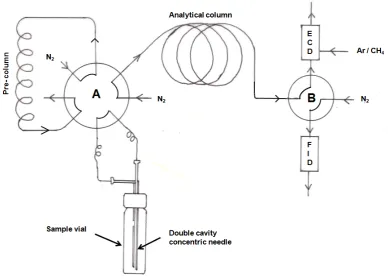
described in the text, including the abbreviations. The system shown is that used at New Zealand’s National Centre for Nitrous Oxide Measurement (NZ-NCNM) _________________________________ 62 Figure 4.3: Simplified plumbing diagram, showing the gas sampling valves in the backflush mode as described in the text, including the abbreviations. The system shown is that used at New Zealand’s National Centre for Nitrous Oxide Measurement (NZ-NCNM) _________________________________ 64 Figure 4.4: The relation between peak area and N2O concentration, determined by calibrating GC4
at the NZ-NCNM on 30 November 2011. On the basis of two regressions compared by an F-statistic, a line (solid) did not fit these data as closely as a quadratic curve (dashed, p < 0.001, N2O concentration
(µL L-1) = -0.036 + 2.569 x 10⁻⁴ peak area + 9.544 x 10⁻⁹ peak area2) _____________________________ 66
List of Tables
Table 2.1: Summary of considerations when designing non-steady state chambers. ________________ 20 Table 3.1: Summary of considerations for optimising chamber deployment. ______________________ 35 Table 3.2: Overview of sources of uncertainty associated with hourly, daily or cumulative flux estimates for individual chambers, and spatially integrated flux estimates for a plot or field. _________________ 42
Table 4.1: Summary of sample collection, storage and analysis requirements. ____________________ 57
Table 5.1: Summary of considerations for deployment of automatic systems. _____________________ 74
Table 5.2: Maximum and minimum deviation from annual N2O fluxes (% deviation from mean) from
three land uses in sub-tropical Queensland, using different sampling frequency permutations
(Rowlings, 2010). ____________________________________________________________________ 81 Table 6.1: Summary of recommendations for data analysis. __________________________________ 96 Table 6.2: Summary of key advantages, disadvantages and recommendations for selection of Flux Calculation (FC) Scheme. ______________________________________________________________ 99 Table 6.3: Summary of recommended methods for estimating the mean and variance of log-normally distributed populations for three sample coefficients of variation (CV) by three sampling intensity ranges. When more than one method is recommended, the methods are presented in order of most, to least, preferable. MM: method of moments, ML: the maximum likelihood method, UMVUE: the uniformly minimum variance unbiased estimator method. ___________________________________________ 113 Table 7.1: Summary overview of reporting requirements. ___________________________________ 123 Table 8.1: A summary list of potential risks associated with chamber methodology, and guidelines on how to reduce them. ______________________________________________________________ 132
List of Corrected Errata
EXECUTIVE SUMMARY
Author for correspondence – Email: [email protected]
Background
For the last 30 years, static (or ‘non-steady state’) chambers have been most commonly used method for measuring N2O fluxes from agricultural soils. The main
advantages of this technique are that it is relatively inexpensive, versatile in the field, and the technology is very easy to adopt. Consequently, much of the knowledge and understanding of N2O emissions that underpins the estimation of national emission
inventories from agricultural soils and efficacies of potential mitigation practices is based on N2O chamber measurements. More than 95% of the thousands of published
N2O emission studies used chamber methodologies – in particular, non-flow-through,
non-steady-state (NSS) chambers.
C.A.M. de Klein1, M.J. Harvey2, M.A.Alfaro3, D.R. Chadwick4,T.J. Clough5,
P. Grace6, F.M. Kelliher5,7, P. Rochette8, R.T. Venterea9
1AgResearch, Invermay Research Centre, Private Bag 50034, Mosgiel, New
Zealand.
2National Institute of Water and Atmospheric Research, P.O. Box 14-901,
Kilbirnie, Wellington 6241, New Zealand.
3INIA Remehue, PO Box 24-O, Osorno, Chile.
4School of Environment, Natural Resources and Geography (SENRGY),
Environment Centre Wales, Deiniol Road, Bangor University, Bangor, LL57 2UW Wales.
5Department of Soil & Physical Sciences, Faculty of Agriculture & Life
Sciences, P.O. Box 84, Lincoln 7647, New Zealand.
6Queensland University of Technology, Brisbane, Queensland, Australia 7AgResearch, Lincoln Research Centre, Private Bag 4749, Christchurch 8140,
New Zealand.
8Soils and Crops Research and Development, Agriculture & Agri-Food Canada,
2560 Hochelaga Blvd, Quebec, Quebec G1V 2J3, Canada.
9USDA-ARS, Soil and Water Research Management Unit, 1991 Upper Buford
Non-steady-state chambers rely on the accumulation of N2O within an open-bottomed
chamber placed on the soil surface. Headspace samples are usually taken once on each sampling day and analysed in the laboratory using gas chromatography to estimate the daily N2O flux of each chamber. Flux measurements are then made from a given
number of chambers over a given time period, and a given sampling frequency, to determine spatially and temporally integrated N2O emissions. The key aspects of
chamber methodologies all have the potential to bias results or bias third-party interpretation of those results, and therefore limit inter-study comparisons and assessment of the reliability and uncertainty associated with the results. The international science community increasingly recognises the need for standardised guidelines on the use of chambers – and associated data reporting – for measuring N2O emissions from agricultural soils.
In 2011/12, the New Zealand Government, in support of the objectives of the Livestock Research Group of the Global Research Alliance on Agricultural Greenhouse Gases, funded an international collaboration to progress the development of guidelines and recommendations. At an initial workshop in New Zealand in May 2011, leading experts from Alliance member countries reviewed the current state of understanding of N2O
chamber methodologies, and developed the outlines for this guideline document. Since then, researchers from around the world have been working together to write the chapters for the different steps in producing and reporting N2O flux data from the
use of chambers.
This document details the current state of knowledge of N2O chamber methodologies
and provides guidelines and recommendations for their use. In developing the
guidelines, each chapter covers one of the key aspects – including design, deployment, air sample collection, storage and sample analysis, data analysis and data reporting – with additional chapters on automated systems and Health and Safety. Each chapter outlines: i) agreed minimum standards, ii) site or system specific requirements and iii) evolving standards. The minimum requirements and evolving standards are
summarised here, and at the start of each chapter. For site- or system-specific requirements please refer to the individual chapters.
The guidelines define minimum requirements, but are not highly prescriptive. They aim to provide practitioners with information on best practice and factors that need to be considered in design and operation of N2O flux measurement programmes. Areas
where there is no current consensus are described as ‘evolving issues’. A major
discussion point that emerged was the difficulty of having to balance limited resources between carefully measuring individual fluxes, versus increasing the number of
Minimum requirements
Chamber design
Chapter 2 of these guidelines discusses chamber design recommendations with a focus on static chambers. Design requirements summarised below seek to maximise flux detectability and minimise any measurement artefacts (chamber biases) associated with poor design.
Design feature Minimum requirements
Materials Inert to N2O, such as stainless steel, aluminum, PVC, acrylic
Area Recommendation is for chamber area: perimeter ratio to be ≥10 cm.
Height Chamber height (cm) to deployment time (h), ratio should be ≥40 cm h-1. Base depth Ratio of insertion depth: deployment time of ≥12 cm h-1. Height above soil
surface should be as close to the soil surface as practical (<5 cm).
Gas tight seal A water trough or rubber/closed-cell foam gasket. Gaskets should have low internal cross-sectional area, and be compressible. Appropriate fasteners are required with rubber gaskets.
Sampling port Inert rubber septa or syringe taps.
Vent while placing chamber on base
Opening a vent or sampling port while placing the chamber is recommended.
Vent during
deployment No consensus on whether vents should be used or not – evolving issue. However,if used, vents should be located close to the soil surface, or be
designed to withstand wind. Appropriate vent dimensions are dependent on expected wind speeds during deployment, and should be adjusted accordingly (see references in text). Chambers and their vents should be bench-tested to ensure no Venturi effect occurs.
Deployment protocol
Chapter 3 of these guidelines discusses the deployment protocol. In addition to chamber design, good practice in deployment is also important to achieve the acquisition of best quality data for emission estimation. In addition to the individual chamber deployment, there are recommendations for designing plot experiments for group deployment, replication and for accompanying environmental measurements that should be made.
Deployment issue Minimum requirements
Site disturbance Chamber bases to be inserted at least 24 h prior to the first sampling – preferably longer, if logistics allow it.
Avoid disturbance of the soil around the chambers.
Relocate chambers when soil water content within the chamber differs from surroundings.
Chamber
deployment For chambers with a maximum height of 20 cm, use a deployment period ≤ 30 – 40 min.
Chamber sequence
and grouping Ensure that measurements are sampled per block, rather than per treatment, to ensure each block is sampled in the shortest possible period.
Whenever possible, vary the block sampling sequence between sampling days, to avoid potential bias.
Number of samples per flux
measurement
Three headspace samples per flux measurement, especially at times
when high emissions are expected1.
First air sample (T0) Take T0 sample immediately after chamber placement on the base2. Ancillary
measurements Measure soil texture, bulk density, pH, oranic C and total N content at least once for each campaign. Measure average soil and air temperature and total rainfall hourly or daily.
Measure soil water content on each sampling day.
Time of day Studies suggest that between 10 am and 12 noon reflects daily average, but whenever possible, researchers need to determine the
diurnal pattern of N2O emissions to assess time of day that best
represents the average daily flux for their study.
1When high spatial variability of fluxes requires an increase of chamber replication and resources are limited, two or
three headspace samples may be taken. However, researchers must quantify any bias that may be introduced by assuming a linear increase in headspace N2O concentration.
2When ambient air samples are used as an estimate of T0, researchers need to establish that the N2O concentration
Duration of
experiment Continue measurements until there is no significant difference in Nemissions, or driving variables of N2O emissions between treated and 2O
control plots.
For emission factor measurements for inventory, measurements should ideally cover 12 months.
Frequency of
sampling When NPLUS sample one to two days prior and one to two days after any 2O peak fluxes are expected, sample at least twice per week, event likely to induce peak emissions.
During periods of low N2O flux, sample at least once a week.
When fluxes have returned to background levels, the sampling interval can be further increased.
Size and number of
chambers Chambers should cover an area as large as practical, while providing information at the smallest scale for which it is needed (see also Chapter 2).
Placement of
chambers Assess if spatial gradient in fluxes exists, divide area into relatively homogenous areas and stratify sampling accordingly. In absence of spatial structure, place chambers randomly.
Treatment
replication A minimum of three replicate plots is needed, preferably more.
Sample collection, storage and analysis requirements
Chapter 4 of these guidelines outlines best practice for analytical lab determination of N2O gas samples, calibration requirements for optimal accuracy and how to assess
adequate analytical precision.
Sampling issue Minimum requirements Sample collection
and storage Clean, non-reactive material that can be sealed; container evacuation recommended.
Sample analysis by
GC Commercially-made GC system; flow control and automated sample injection recommended.
Reference gases GC system calibration
Confidence in the N2O concentration of all standards.
Similar ranges of standards and samples, and many ‘ambient checks’ recommended.
Processing GC data Determine repeatability standard deviation of standards and air samples.
Sample analysis and N2O fluxes
Automated chambers
Chapter 5 of these guidelines discusses the underlying requirements for successful deployment of automated chambers. While a relatively new technology, a variety of design solutions have been successfully deployed to date.
Deployment issue Minimum requirements
Materials Stainless steel frames and transparent acrylic panels.
Gas leaks Non-reactive adhesives to form a tight seal and prevent leaks.
Pressure changes 2-3 mm vent (this is normally of the same design as the gas sample port) to minimise any pressure artefacts.
Representative gas
sample A single sampling port at the top of the chamber is sufficient in volumes < 50 litres. Larger chambers are prone to within chamber gradients.
Site disturbance Two chamber bases per replicate plot, to be inserted at least 24 hours prior to the first sampling. Switch chamber position between bases every week to minimise site disturbance artifacts.
Chamber air
temperature Air temperature sensor within at least one chamber (in a block design) to trigger opening at a pre-defined temperature (<<50 deg C) ). In high temperature environments, tinted panels or insulation may be
required on chambers.
Precipitation and
rainfall Rain gauge with threshold set to open all chambers.
Chamber sequence Ensure that measurements are sampled per block, rather than per treatment, to avoid bias through sampling order.
Ancillary
measurements Profile soil texture, bulk density, pH, organic C and total N content at least once per season. Sample soil for mineral N (0-10 cm) every month (deeper increments preferred).
Weather station nearby.
Sensors for continuous logging of surface soil and air temperature, and soil moisture.
Power, weather
proofing and security Trailer or shed with access to mains power within 100 m, including UPS, or remote power source: e.g., solar, with backup generator.
Calibration and carrier
gases Spare gas cyclinders and calibration gases, so continuous operation is not interupted.
Chamber or sampling line leakage or blockage
An infrared CO2 analyser (e.g. LI-COR®) will provide high
temporal-resolution data which can provide a rapid graphical assessment of
leaks. Ensure ascarite (H2O absorber) is regularly changed. Regular
visual inspection of chambers and sampling lines.
Data quality and
Data analysis
Chapter 6 of these guidelines discusses data analysis considerations. Guidance is provided to allow selection of the most appropriate flux calculation method, how to best interpolate non-continuous measurements to obtain best estimates of emissions and emission factors.
Analysis topic Minimum requirements Selection and use of a
flux calculation method Method should be matched to the number of headspace samples taken (see Table 6.2, and also Chapter 3 - Chamber Deployment).
Estimation of emissions using non-continuous flux data
Daily fluxes can be integrated, using trapezoidal integration. To improve the accuracy of cumulative emissions estimates, maximise sampling frequencies and spatial replication given available resources. Repeat experiments over multiple years, and consider using spatial or temporal gap filling procedures.
Assessment of minimum detectable flux (MDF)
Determine random measurement error associated with sampling and analysis of replicate standards of known concentration, and use the resulting error rates to determine MDF.
Statistical
considerations for analysing inherently heterogeneous flux data
If treatments are replicated (at least three blocks), the variability between replicates can be assessed by calculating means of chambers in each replicate. The variability within the replicate can also be determined by assessing the chamber variability.
Estimation of emission
factor (EF) Requires the inclusion of no-N control treatment, and the subtraction of cumulative emissions in control from cumulative emissions in experimental treatment(s) receiving N addition.
Data reporting
Chapter 7 summarises the minimum requirement for reporting data, which includes experimental site details, methodology details, ancillary measurement details and analysis details.
Safety precautions
In Chapter 8, the Health and Safety (H&S) risks associated with all stages of chamber measurement – from field deployment through to laboratory and subsequent analyses – are discussed. It is important that research staff consider these prior to starting any chamber deployment and sampling. Issues are identified, along with personal
protective equipment (PPE) and hazard minimisation procedures, which should be considered as a minimum when complying with institutional and national legislation.
Evolving Issues
Chamber design
The use of a chamber vent during the flux measurement
There remains a lack of consensus amongst researchers, with many opting not to vent during chamber deployment due to possible Venturi effects.Further data sets pertaining specifically to N2O fluxes are needed to resolve this issue.
Headspace mixing Effects of mixing should be tested and reported on. There has
been very little work done on evaluating specific requirements for best approach to mixing.
Deployment protocol
Ancillary
measurements Nparameterisation and validation of models. Researchers should 2O data sets are generated for many purposes, including the consult with modellers on any additional model input parameters that need to be measured, and at what frequency.
Accounting for diurnal variability in fluxes
Measure diurnal pattern of driving variables to assess if daily N2O flux should be corrected.
Sampling frequency Determination of sampling strategies that optimise temporal and spatial coverage of soil N2O fluxes.
Data analysis
Flux calculation
method Criteria for site-specific selection of best non-linear scheme need to be developed.
Estimation of emissions using non-continuous flux data
Use of automated chamber systems (see chapter 5) can help minimise temporal uncertainties, but better estimates of spatial variability require a very large number of chambers, or the use of non-chamber (e.g. micro-meteorological) methods.
Assessment of minimum detectable flux (MDF)
Different flux calculation schemes can differ in their MDF, therefore the choice of flux calculation scheme can change MDF (see evolving issues for section 6.1).
Statistical considerations for analysing inherently heterogeneous flux data
To assist with comparison of heterogeneous chamber datasets, record the spatial coverage of observations (chamber area times the number of chambers, relative to the plot size: i.e., the plot area covered by the chambers). Advanced techniques are being developed to improve description of non-normal and spatially heterogeneous data-sets and use this to select the best method for mean estimation.
Estimation of
1
INTRODUCTION
This document provides internationally agreed reference guidelines for measuring N2O
emissions using chamber methodologies, so as to inform the production of quality N2O
flux measurement data and improve inter-comparability between international studies.
The measurement of nitrous oxide (N2O) fluxes from agricultural soil surfaces can
broadly be categorised into two main measurement techniques: chamber and micrometeorological methodologies (Denmead 2008). These guidelines deal
exclusively with the former. For the last 30 years, static chamber methodologies have been most commonly used to measure N2O fluxes from agricultural soil surfaces. More
than 95% of the thousands of published N2O emission studies used chamber
methodologies – in particular, non-flow-through, non-steady-state (NSS) chambers (Rochette 2011).
This technique has several advantages: it is relatively inexpensive, versatile in the field and the technology is conceptually easy to deploy. Consequently, N2O chamber
measurements have informed the bulk of our knowledge and understanding of N2O
emissions, which in turn underpin the estimation of national emission inventories from agricultural soils, and the modelling of those processes.
A recent review of chamber methodology N2O emissions studies from around the
world highlighted large variations in chamber design, deployment and data analysis (Rochette & Ericksen-Hamel 2008). When they evaluated each of these aspects, Rochette and Ericksen-Hamel (2008), concluded that more than half of the 356 studies were of “poor” or “very poor” quality when judged by their ‘robustness’ criteria. It is important to note here that Rochette and Eriksen-Hamel (2008) could only judge the quality of the studies by the information provided in the published papers. It is
therefore possible that studies were categorised as “poor” or “very poor”, even though they might have met the ‘robustness’ criteria, simply because it was not reported in the paper.
C.A.M. de Klein1& M.J. Harvey2
1AgResearch, Invermay Research Centre, Private Bag 50034, Mosgiel, New
Zealand.
2National Institute of Water and Atmospheric Research, P.O. Box 14-901,
Nevertheless, the large variability in chamber design and use, and the associated potential errors in the estimations, could have major implications for the reliability and inter-comparability of N2O emission data reported in the literature.
There is an urgent need to reduce the environmental impacts of agriculture, and to curtail climate change due to CO2 – and non-CO2 – greenhouse gas emissions.
Therefore, international inventory reporting obligations – and efforts to reduce GHG emissions – require accurate, reliable N2O flux measurements. Due to the large
variation in current approaches to N2O chamber design, deployment and data analysis,
– and associated uncertainty around the quality of the results – there is a widely-recognised need for standardised approaches and guidelines.
This document summarises the key considerations and recommendations – as agreed by an international panel of experts – on using chamber methodologies for measuring N2O emissions from agricultural soils. Each chapter discusses a factor critical to the
accurate determination of N2O fluxes: chamber design, deployment protocols,
gas-sample collection and analysis, automated chamber systems and data analysis and flux calculation methodologies.
The recommendations are summarised as either ‘minimum requirements’, ‘site specific considerations’, or ‘evolving issues’ (those issues for which no clear consensus currently exists). Adopting these guidelines and considerations will improve the quality of reported measurements and subsequent calculated emission factors. They will improve the ability to compare results between studies, and help guide scientific peer-review when assessing the quality of submitted chamber measurements. In these guidelines, we also provide recommendations on minimum requirements for data reporting, and discuss health and safety considerations when using chamber methodologies.
Key discussion points
A major discussion point that emerged during the preparations of these Guidelines was the difficulty of having to balance limited resources and the scarcity of
experimental evidence to make informed decisions and judgements. On the one hand, a larger number of headspace samples per chamber is likely to provide the best
possible individual flux measurement. On the other hand, N2O emissions are
notoriously variable (both spatially and temporally) and a large number of replicate chambers as well as a high sampling frequency are required to minimise the variability of the cumulative N2O emission estimates.
Underlying this debate is the question of whether one can assume that the N2O
concentration inside the chamber increases linearly, or how large the potential bias in the flux estimate is by assuming linearity. Diffusion theory suggests that the
accumulation of N2O inside the chamber immediately suppresses the vertical gradient
in N2O concentration as soon as the chamber is put in place: i.e., the N2O increase is
non-linear. However, some researchers have shown that the N2O increase during
can be used to increase chamber replication and/or sampling frequency. However, there is insufficient experimental evidence to clearly determine the trade-offs between carefully measuring individual flux measurements versus increasing the number of chambers and/or sampling occasions to account for spatial and temporal variability. Understanding the size of the uncertainties of each step of the chamber measurement approach – from the number of headspace samples in each individual flux
measurement, to chamber replication, sampling frequency and flux calculation and integration method – and their relative impact on calculating cumulative emissions and emission factors, will be of critical importance for balancing limited resources to
achieve the best possible (most accurate) results.
References
Denmead, OT, 2008, ‘Approaches to measuring fluxes of methane and nitrous oxide between landscapes and the atmosphere’, Plant and Soil, vol. 309, pp. 5-24. Rochette, P & Eriksen-Hamel, NS, 2008, ‘Chamber Measurements of Soil Nitrous Oxide
Flux: Are Absolute Values Reliable?’ Soil Science Society of America Journal, vol. 72, no.2, pp. 331-342. doi: 10.2136/sssaj2007.0215.
Rochette, P, 2011, ‘Towards a standard non-steady-state chamber methodology for measuring soil N2O emissions.’ Animal Feed Science and Technology, vol.
2
CHAMBER DESIGN
Author for correspondence – Email: [email protected]
T.J. Clough1, P. Rochette2, S.M. Thomas3, M. Pihlatie4,
J.R. Christiansen5, & R.E. Thorman6.
1Department of Soil & Physical Sciences, Faculty of Agriculture & Life
Sciences, P.O. Box 84, Lincoln 7647, New Zealand.
2Soils and Crops Research and Development, Agriculture & Agri-Food Canada,
2560 Hochelaga Blvd, Quebec, Quebec G1V 2J3, Canada.
3Soil Water & Environment Group, Plant & Food Research, Canterbury
Agriculture & Science Centre, Gerald St, Lincoln 7608, New Zealand.
4Department of Physics, Division of Atmospheric Sciences, P.O. Box 48,
FI-00014 University of Helsinki, Finland.
5Division of Ecosystem and Biomass Science, Forest & Landscape, University
of Copenhagen, Rolighedsvej 23, DK-1958 Frederiksberg C, Denmark.
6ADAS Boxworth, Battlegate Road, Boxworth Cambridge, CB23 4NN, United
Summary table
Table 2.1: Summary of considerations when designing non-steady state chambers
Design feature Design objective Minimum requirements Site specific issues Evolving issues
Materials To prevent gas exchange
through chamber. Inert to Naluminum, PVC, acrylic. 2O, such as stainless steel, Robust frames required to withstand grazing.
Area Minimise error due to poor sealing. Maximise area sampled.
A chamber area-perimeter ratio of ≥10 cm is recommended (equates to a cylindrical chamber of ≥40 cm diameter).
Adaptation needed if rocks or roots are present, or if required by research objectives.
Height Maximise flux detection and minimise perturbation of environmental variables.
Chamber height (cm) to deployment time
(h), ratio should be ≥40 cm h-1. Chamber height should accommodate
crop height.
Base depth Prevent below ground lateral gas transport, shading and ponding of water.
Ratio of insertion depth to deployment time of ≥12 cm h-1. Height above soil surface
should be as close to the soil surface as practical (<5 cm).
Gas tight seal Prevent gas leaking between
Design feature Design objective Minimum requirements Site specific issues Evolving issues
Sampling port For extracting sample. Inert rubber septa or syringe taps.
Vent while placing chamber on base
To prevent pressure disturbance while placing the chamber on the base.
Opening a vent or sampling port while
placingthe chamber is recommended.
Vent during
deploymenta To prevent pressure gradients between the interior and exterior of the chambers during flux measurement and gas sampling.
If used, vents should be located close to the soil surface, or be designed to withstand wind. Appropriate vent dimensions (diameter and length) are dependent on expected wind speeds during deployment, and should be adjusted accordingly (see references in text). Chambers and their vents should be bench-tested to ensure no Venturi effect occurs.
There remains a lack of
consensus amongst researchers, with many opting not to vent during chamber deployment due to possible Venturi effects. Further data sets pertaining specifically to N2O fluxes are
needed to resolve this issue.
Insulation Prevent temperature gradients between the interior and exterior of the chambers.
Use reflective foil, foam or polystyrene. Test effectiveness by comparing surface soil temperatures inside and outside the chambers.
Headspace
mixing Well-mixed headspace to ensure representative sample is taken.
If active headspace mixing (e.g., fans) is required, it should not affect the diffusive flux.
Crop type and
chamber height. Effects of mixing should be tested and reported on. There has been very little work done on evaluating specific
requirements for best approach to mixing.
aNote: Note there remains a lack of consensus amongst researchers with many opting not to vent during chamber deployment due to possible Venturi effects and further data sets pertaining
2.1
Introduction
Chamber designs may employ flow through, non-steady state or steady state chambers (Denmead 1979), or non-flow through, non-steady state chambers (Rochette & Eriksen-Hamel 2008). However, the literature on N2O emissions is
dominated by the use of non-flow through, non-steady state chamber methodologies (Bouwman et al. 2002), often referred to as ‘static chambers’.
Since chambers are invasive, nuances in chamber design can affect the accuracy of N2O flux determination (Parkin et al. 2012) and the subsequent upscaling of results.
This is because chambers can change the vertical diffusion of N2O in the soil, the soil
energy balance, and degree of turbulence above the soil (Rochette 2011).
This chapter provides recommendations on minimum requirements, and discusses the key principles for chamber designs to minimise the impact of the measurement
technique on the natural soil and atmospheric processes. It provides guidance and recommendations on materials, dimensions, venting, seals, insulation, sampling port, plant effects and headspace mixing. Some examples of recommended design are shown in Appendix 1.
2.2
Materials and components
Above all, chamber materials should not react with any gases from the soil system. Neither should they emit any contaminants into the atmosphere above the soil surface, nor the soil itself, once positioned. Recommended materials so far include stainless steel, aluminium, polyvinyl chloride (PVC), polycarbonate, polyethylene, or polymethyl methacrylate (Plexiglas®, acrylic sheet) (Parkin & Venterea 2010). Other factors, such as the presence or absence of plants, may also influence the choice of material, as discussed below.
Any other components used in chamber construction, such as seals, tubing, septa and venting, should also be inert. The chamber system should also be robust. If used in grazed pasture studies, chamber materials must be rigid, so as to prevent chamber flex and to withstand treading and chewing by grazing animals. Heavy mesh cages may be needed to stop cattle damaging chambers.
In the past, chambers have been as simple as ‘push-in‘ covers pressed into the soil. Nowadays, the use of such chambers is strongly discouraged, since they disturb the soil gas profile immediately prior to the flux determination. This disturbance happens when the chamber wall disturbs aggregates, roots and biota in the soil profile as it is inserted, affecting gas containment, transport and production processes, and the piston flow of air that results from chamber placement (Hutchinson & Livingston 2001, Matthias et al. 1980).
bare coarse-textured soil to weeks when insertion results in roots damage. Other considerations around chamber design, as discussed below, are venting, sample ports, effective sealing, soil temperature monitoring and insulation.
2.3
Dimensions
Good chamber design must consider certain critical dimensions, such as the internal chamber height above the soil surface, the chamber area (cm2) and the length (cm) of
the chamber perimeter. These last two factors are used to calculate the chamber area-perimeter ratio, which Rochette and Eriksen-Hamel (2008) recommended should be ≥ 10 cm (e.g. a cylindrical chamber of 40 cm diameter), based on work by Healy et al. (1996). This is because the relative error associated with any poor chamber seal decreases as the diameter of a chamber increases (see below). Chamber area will depend on where the apparatus is deployed: larger chambers can of course be placed on relatively flat, clear terrain, but forest ecosystems might require chambers of smaller area. In either case, the chamber will ideally be as large as feasibly possible in order to capture spatial variation. Chambers covering an area up to 2 m2 have been
used, but most common models have an area smaller than 0.5 m2.
A chamber’s geometry is important when dealing with spatial variability problems at small scales (Rochette & Hutchinson 2005). For example, in a row crop, nitrogen fertiliser banding and soil compaction in the inter-rows often produce a flux gradient perpendicular to the plant rows. If a research objective is to describe that gradient, long, narrow rectangular chambers are most appropriate. If a description of the inter-row gradient in flux is unnecessary, then chambers covering the whole inter-inter-row are most efficient. In grazed pasture systems, chambers are often circular, so as to enclose the generally circular area of animal urine patches. Smaller chambers may also be required in particular studies exploring the spatial variability of fluxes: e.g., the effect of animal hoof compaction versus non-compacted soil surrounding the hoof print. Height is another critical feature of chamber design. As chamber height increases, the impact on environmental variables such as humidity, or the N2O diffusion gradient
within the soil, is reduced. However, the minimum detectable flux increases
(Hutchinson & Livingston 2002; Rochette & Eriksen-Hamel 2008). Conversely, if the chamber height is decreased, the minimum detectable flux is reduced, but at the expense of greater perturbation of the system (temperature, humidity and gas concentration). The significance of these perturbations – and their dependence on chamber height – is intrinsically linked to chamber deployment time, so Rochette and Eriksen-Hamel (2008) devised a ratio of chamber height (cm) to deployment time (h), recommending that well-designed and deployed chambers have a ratio of ≥ 40 cm h-1.
Of course, experimental objectives might also determine chamber heights. If the aim is to capture the role of a tall plant, such as wheat, this will dictate the chamber height. However, the user needs to be aware that detectable fluxes will be lower, so the closure period may need to be extended. Also, uniform N2O concentrations may not
the plant grows, but care needs to be taken with the seal between chamber
extensions, and mixing of the headspace, particularly around extensive crop canopies. Dimensions of the base obviously need to match the chamber, so as to achieve a gas-tight seal. However, other dimensions, and the design of the chamber base, also need to be considered. Atypical soil moisture conditions within the chamber must be avoided, because water retention in the base after rain or irrigation could change soil aeration, soil temperature and microbial processes. While the chamber is left open, the base must not be so high that chamber plots are partially or fully shaded, since this could change soil temperature and lead to unintended effects on soil moisture and microbial processes. Thus, the wall of the base exposed above the soil surface needs to have a very low profile. Parkin and Venterea (2010) recommend base walls no higher than 5 cm: however, chamber bases can be designed to be almost flush with the soil surface (Parkin & Venterea 2010).
Another critical dimension is how far the chamber base is inserted into the soil. Failure to push it deeply enough into the soil can allow N2O to leak, or ambient air to
contaminate the chamber headspace via lateral diffusion of gases through the soil, as a consequence of the vertical N2O concentration gradient being disrupted (Rochette &
Eriksen-Hamel 2008). To prevent artefacts, the base walls need to be inserted to at least the depth where N2O concentrations are being perturbed by feedback effects of
the chamber, so as to prevent lateral diffusion of N2O beneath the wall. (Healy et al.
1996; Hutchinson & Livingston 2001).
Hutchinson and Livingston (2001) modelled the relationship between deployment time, air-filled porosity (0.1, 0.3 and 0.5 cm3 cm-3) and the base insertion depths
required to reduce lateral diffusion by either 1% or 5% of the steady state N2O flux.
Their results indicated that a 5 cm insertion depth was more than sufficient in soil with low effective diffusivity (soil air-filled porosity ≤ 0.1 cm3 cm-3). However, it was only
adequate for brief deployment periods (20 to 30 min) at a soil porosity of 0.3 cm3 cm-3,
and inadequate at higher values of soil air-filled porosity (0.5 cm3 cm-3). Their data
indicate that, for deployment times of 30 min, insertion depth should be 10 cm at a soil air-filled porosity ≤ 0.3 cm3 cm-3, increasing to 20 cm if air-filled porosity is as high
as 0.5 cm3 cm-3.
Rochette and Eriksen-Hamel (2008) concluded in their review study that a ratio of insertion depth to deployment time of ≥ 12 cm h-1 was very good. A prior knowledge of
maximum soil air-filled porosities at the site of chamber deployment can help reduce errors, and the data of Hutchinson and Livingston (2001) should be consulted for guidance.
For discussion of soil installation recommendations, see Chapter 3.
2.4
Venting
on non-steady state chambers (Bain et al. 2005; Davidson et al. 2002; Hutchinson & Livingston 2001; Hutchinson & Mosier 1981; Xu et al. 2006). Vents prevent pressure gradients between the interior and exterior of the chamber from influencing gas exchange. Pressure gradients can occur when the chamber is placed on its base, and during the sampling of the chamber headspace (Christiansen et al. 2011). However, opening a vent during chamber placement stops this happening. Inadequate insulation may cause pressure differentials to develop in unvented chambers, as a result of cooling or warming of the chamber air (Davidson et al. 2002). Naturally occurring pressure gradients may occur outside the chamber as a result of wind-driven
turbulence (Rochette 2011). If the turbulence-driven changes in barometric pressure are reduced due to a chamber’s placement over the soil surface, N2O emissions will be
reduced inside the chamber (Hutchinson & Mosier 1981).
Higher N2O fluxes have been reported when vents have been used in chambers
(Hutchinson & Mosier 1981). In another study, the use of vents increased measured N2O fluxes five-fold in a well-aerated soil, but reduced them in less permeable soils,
suggesting that vents might create greater problems than they solve (Conen and Smith, 1998). Well-designed vents transmit barometric pressure fluctuations while minimising leaks (i.e., N2O diffusion out of the chamber via the vent tube) and
contamination (i.e., the intake of external ambient air into the chamber during gas sampling, or temperature induced pressure changes inside the chamber).
A vent tube is constructed from inert tubing, and secured through the chamber with an appropriate gas-tight bulkhead fitting. Criteria for optimal vent design, given by Hutchinson and Mosier (1981), stated that: (i) the tube diameter (D) must be small enough to minimise diffusive losses, but large enough to permit air – moving in response to pressure changes – to flow down the tube with pressure loss no greater than 0.1 µ bar, and (ii) the vent tube length (L) must be not less than that which gives an internal volume five times greater than the volume of enclosed air displaced by the largest anticipated pressure wave.
The equations provided by Hutchinson and Mosier (Hutchinson & Mosier 1981), which relate wind speed, D and L, must be used to calculate the optimum vent tube
dimensions for the conditions of the chamber study, such that the loss of accumulating N2O by diffusion never exceeds 1% (Hutchinson & Mosier 1981). A further practical
guide to selecting vent tube length and diameter as a function of chamber volume and wind speed, based on Hutchinson and Mosier (1981), is provided by Parkin and
Venterea (2010), Figure 2.1.
However, the use of vents has also been shown to induce a further source of error, due to wind flowing over the vent outlet and creating a Venturi effect, which
Davidson et al. (2002) noted that there were possible artefacts in both directions for the vented and non-vented chambers used by Conen and Smith (1998), making it difficult to know which chamber yielded the ‘true’ flux. Davidson et al. (2002) did, however, measure an average internal chamber headspace pressure difference of -0.2 kPa on a moderately windy day, when a vented chamber was over a soil surface, but summarised their findings by stating that errors due to chamber pressure artefacts can be minimised – or almost eliminated – by appropriately sized vents. Hutchinson and Livingston (2001) stated that the weight of evidence is in favour of vents, and that, so long as vents are adequately designed, adverse effects are minimised. Potential Venturi effects can be further minimised by correctly sizing the vent, mounting it as close as possible to ground level to minimise wind speed and by pointing the vent outlet downwind – maybe even shielding it in strong winds. Bain et al. (2005)
confirmed the Venturi effect described by Conen and Smith (1998) using flow through, non-steady state chambers (5 L PVC with vertical vent tube (0.19 cm diameter, 3.56 cm long)) attached to either impermeable bases, or a PVC base inserted 2 – 4 cm into the soil. For the chambers on the impermeable bases, the fan-controlled wind conditions in the field resulted in negative chamber pressures with a ca. 1 Pa drop in pressure per 1 m s-1 increase in horizontal wind speed at chamber height. When this was repeated
on natural soil, there were no pressure changes inside the chambers. All experimental variables were similar, and a negative pressure should have been induced. Bain et al. (2005) concluded that mass flow of gas through the soil was occurring, and
compensating for the chamber pressure gradient.
Advection of a soil gas with this flow will increase the estimated gas flux. This same effect was observed by Xu et al. (2006), who recorded no negative pressures inside a chamber placed on a base sitting on soil, but found higher CO2 fluxes in windy
conditions. They subsequently found negative chamber pressures when the chamber was connected to an impermeable base. The lack of negative pressures with the chamber placed on the soil was due to mass flow of soil air into the chamber
headspace. Such wind effects on mass flow will vary with soil moisture and porosity, and associated error will also depend on gas concentration (Xu et al. 2006).
The Venturi effect has been overcome by improved vent design that virtually
eliminates the occurrence of artificially induced pressures changes (-15 to 8 kPa) under windy conditions of up to 6.5 m s-1(Xu et al. 2006). With wind speeds up 4 m s-1 at
chamber height, Xu et al. (2006) showed that flux overestimates of up to 19% occurred in CO2 flux calculations when the soil CO2 flux ranged from 0.5 to 2.5µmol-2 s-1. A study
by Suleau et al. (2009) examining soil respiration fluxes confirmed previous findings: that the Venturi effect can occur in situ, and they offered an alternative design to overcome the effect.
Suleau et al. (2009) found that locating vents (of their own design) 0.05 m above the soil surface reduced previous overestimates of flux (≤ 300%) in strong winds. To ascertain whether a particular chamber design invokes pressure gradients (Venturi effect) at wind speeds expected under field conditions, the chamber must be tested by sealing the base to an impermeable surface while wind speeds and internal chamber pressures are monitored (Bain et al. 2005; Suleau et al. 2009; Xu et al. 2006). The use of vents remains an evolving issue, despite these recent findings. If vents are used, they should be tested to show no Venturi effects under deployment conditions.
2.5
Seals
An essential element of a multiple component chamber is the gas-tight seal placed between the two components. This is commonly achieved by placing a rubber gasket between the chamber and its base (Parkin & Venterea 2010) or using a built-in trough, attached to the base, that holds water and acts as a seal between the two components (Christiansen et al. 2011; Hutchinson & Livingston 2001). Specifications for the
material(s) required to form the perfect seal between components have never been clearly defined. Obviously, the aim is to prevent N2O leaking out of the chamber and
external air into the chamber. Modelling by Hutchinson and Livingstone (2001) clearly showed that gasket material must have a very low internal cross-sectional area available for diffusion (i.e., a very low diffusivity), and must be pliable enough to form a good seal when compressed. Hutchinson and Livingston’s (2001) simulation used a 0.25 cm wide by 0.25 cm high foam gasket which, at simulated porosities of 0.001 to 0.03, provided gas losses equal to 0.055 and 2.3% of the total mass flux, respectively. In all cases, the modelled gas loss was greater through the simulated leaking gasket than through the vent – sized for a wind speed of 4 m s-1 (Hutchinson and Mosier
gaps only needed to be 1.2 to 53 µm respectively, to achieve the same loss of gas flux as achieved through diffusion through the gasket. This stresses the importance of using precision-machined chamber components. Some form of fastener is often used to compress the chamber against the base’s gasket, ensuring a tight seal. A seal’s effectiveness can be tested by placing concentrations of a reference gas inside a chamber sealed to an impermeable surface, and measuring the rate of N2O
concentration change over time. Ideally, there should be no changes in gas
concentrations over typical deployment periods. Water seals have their shortcomings: they are only useful on flat ground; they can dry out and can become dirty with algal growth. A supply of clean water is required at each sampling, and care must be taken not to spill water into the chamber, where it could affect the potential for N2O
production. Otherwise, water seals are very effective and a generally preferred option for flat sites.
2.6
Insulation and temperature control
Soil temperature can affect N2O production and reduction rates, the solubility of N2O
in soil water, and the diffusion rate of N2O. Likewise, if the chamber is not vented, any
temperature decreases or increases in the chamber will lead to negative or positive pressure effects respectively (Rochette and Hutchinson 2005). Parkin and Venterea (2010) calculated that, if not corrected for, significant temperature changes (> 5oC h-1)
will produce errors in calculated fluxes. Xu et al. (2006) note that, according to the Ideal Gas Law, a 1oC change in chamber temperature could result in a 333Pa change in
chamber pressure. Chamber placement can also impact on soil temperature and on biological processes that produce or consume N2O. It may also indirectly affect N2O
production. For example, a 1oC increase in soil temperature may increase soil
respiration by 10% at 10oC, in the absence of other limiting factors (Lloyd & Taylor
1994).
Thus, any increase in soil temperature may enhance CO2 emissions, which in turn
could alter the soil’s oxygen status and indirectly affect N2O production mechanisms.
Any increase in the concentration of other gases resulting from chamber placement can affect N2O concentrations (Rochette & Hutchinson, 2005). For example, Parkin and
Venterea (2010) demonstrate how an increase in water vapour concentration – a consequence of increasing temperature elevating humidity in the headspace – could decrease N2O concentrations by 3% (this is known as the water vapour dilution effect).
This in itself may not cause an underestimation of the N2O flux, since the final effect
will depend on other factors, such as linearity of the flux over time.
Where plants are present, chamber studies may employ transparent covers, but these create significant problems with maintaining internal chamber temperatures.
Temperature control mechanisms can be implemented (Don Herman, UC Berkeley, pers. comm.), but in their absence, flux measurement periods need to be kept short to minimise temperature effects, and temperatures need to be monitored so corrections can be made if required.
2.7
Sampling port
A sampling port is required to remove a gas sample from the chamber. It should be inert and gas tight, except when samples are taken. Butyl rubber septa and syringe taps sealed to the chamber are often used. Septa materials must be inert, and changed at regular intervals to prevent leaks. The use of syringe taps may create ‘dead’ air spaces that remain unexposed to the increasing gas concentration in the headspace. Care must be taken to purge these during the gas sampling process. Sampling ports can be connected to a tube that samples air at several locations within the headspace to minimise problems associated with concentration gradients.
2.8
Allowing for plant effects
Plants can have significant effects on N2O fluxes (Chang et al. 1998; Jørgensen et al.
2012; Pihlatie et al. 2005; Reddy et al. 1989; Yu & Chen 2009). In some cases, a chamber cover may influence the rate of such effects on the N2O flux. For example,
placing an opaque chamber cover on the soil surface, over the top of plants, will block incoming radiation, which in turn will lead to stomatal closure (Hopkins & Hüner 2009). This in turn can reduce any subsequent N2O flux as a result of dissolved N2O being
transported in the transpiration stream. The magnitude of any artefact will depend on soil moisture, humidity and the dissolved N2O concentration, while the significance will
depend on other components of the total N2O flux derived from the soil surface.
Smart and Bloom (2001) found that wheat leaves could emit N2O during assimilation
of nitrogen. The rate increased 10-fold when the N source was switched from
ammonium to nitrate, and they found that N2O production was associated with
photo-assimilation of nitrite in the chloroplast. This process is recognised in many plant species (Yu & Chen 2009). Blocking sunlight with opaque chamber materials, therefore, may reduce this N2O flux source. However, the relative significance of plant-derived
N2O production is not well understood. Again, the magnitude of any reduced N2O flux
will depend on plant species, the amount of biomass (leaf surface area) enclosed by the chamber, inorganic N forms in the soil and their amounts. The significance of any such effect will depend on the relative N2O flux from the soil itself.
Few studies have examined the potential artefact(s) – or their magnitude – that may result from the use of opaque materials during chamber N2O flux measurements. If
2.9
Headspace mixing
Manual gas sampling and mixing of headspace air in non-flow through, non-steady state chambers can potentially affect soil surface gas exchange, and lead to a bias in results (Christiansen et al. 2011; Liu & Si 2009; Rochette & Eriksen-Hamel 2008; Rochette & Hutchinson 2005). Manual gas sampling of chambers is the commonest method of sampling N2O concentrations, with potential artefacts of manual sampling
minimised by selecting appropriate sample volumes for example < 1% of headspace volume.
Modelling has shown that soil gas fluxes can be underestimated if the air inside the chamber is not constantly mixed during the enclosure period (Liu & Si 2009). Fans have been used to mix headspace air in closed chamber headspaces, to overcome possible bias from vertical gas concentration gradients. Jørgensen et al. (2012) mixed the headspace of their chambers immediately prior to measurement, to eliminate vertical concentration gradients in chambers containing plants 60-110 cm high. However, few studies have specifically examined the effects of fan-mixing in chambers, especially on N2O fluxes. Rochette and Hutchinson (2005) showed that, for a 60 L square chamber
without fans, the CO2 flux was highly variable, but when a single fan was used, CO2 flux
determinations were generally higher than unmixed fluxes. However, the results were inconsistent over time, and no benefit was obtained from multiple fans (two or four). Using sand beds, Christiansen et al. (2011) set up five reference methane (CH4) fluxes
(60 – 2000 µg m-2 h-1), and studied the effects of manual sampling with syringes and
fans on headspace air mixing and subsequent flux determinations, using a 68 L unvented chamber. In non-mixed chambers (no fans) syringe sampling altered CH4
concentrations inside the chamber, leading to a 36% underestimate of the measured reference fluxes. Comparisons of reference and measured CH4 flux estimates improved
when horizontally positioned fans (68 m3 h-1) were used to mix headspace air. The fan
speed did not induce mass flow of gas from the sand beds.
Christiansen et al. (2011) concluded that further research was required to fully understand the combined effects of chamber dimensions and mixing rates on estimated flux rates. It is likely that headspace mixing is more important in tall chambers enclosing a larger amount of biomass (such as a mature cereal crop). In theory, the perfect mixing system should align headspace mixing intensity with pre-deployment conditions (Rochette & Hutchinson 2005). This is not a simple task to achieve, but it suggests that placement of non-mixed chambers in an exposed windy environment – and of strongly-mixed chambers in calm locations (i.e., under plant canopy) – would result in the greatest flux measurement biases. At present, however, the literature is insufficient to make more specific recommendations on the use of fans.
2.10
Summary
Initially, researchers must consider both the objectives of the experimental
programme the chambers will be used in, and the soil characteristics at the intended site(s). This – along with the principles outlined above, and further research to fine-tune them – will produce a chamber design of optimal dimensions. Before
deployment, the chosen chamber design should be ‘bench-tested’ on an impermeable surface to ensure that materials are inert, that there are no leaks or Venturi effects at anticipated deployment wind speeds and that temperature perturbations have been minimised. Plants inside chambers create unique challenges: if the aim is to maintain plant function during the enclosure period, chamber design needs to be carefully considered. Finally, in certain deployments, significant vertical gradients may develop within the chamber and further studies are needed to assess the best way of
alleviating these prior to, or during, sampling.
References
Bain, WG, Hutrya, L, Patterson, DC, Bright, AV, Daube, BC, Munger, JW & Wofsy, SC, 2005, 'Wind-induced error in the measurement of soil respiration using closed dynamic chambers', Agricultural and Forest Meteorology, vol. 131, pp. 225-232. Barton, L, Kiese, R, Gatter, D, Butterbach-Bahl, K, Buck, R, Hinz, C & Murphy, DV, 2008,
'Nitrous oxide emissions from a cropped soil in a semi-arid climate', Global Change Biology, vol. 14,(no. 1), pp. 177-192.
Bouwman, AF, Boumans, LJM & Batjes, NH, 2002, 'Emissions of N2O and NO from fertilized fields: Summary of available measurement data - art. no. 1058', Global Biogeochemical Cycles, vol. 16,(no. 4), pp. 1058-1058.
Chang, C,H.H., J, Cho, CM & Nakonechny, EM, 1998, 'Nitrous oxide emission through plants', Soil Science Society of America Journal, vol. 62, pp. 35-38.
Christiansen, JR, Korhonen, JFJ, Juszczak, R, Giebels, M & Pihlatie, M, 2011, 'Assessing the effects of chamber placement, manual sampling and headspace mixing on CH4 fluxes in a a laboratory experiment', Plant & Soil, vol. 343, pp. 171-185.
Conen, F & Smith, KA, 1998, 'A re-examination of closed flux chamber methods for the measurement of trace gas emissions from soils to the atmosphere', European Journal of Soil Science, vol. 49, pp. 701-707.
Davidson, EA, Savage, K, Verchot, LV & Navarro, R, 2002, 'Minimizing artifacts and biases in chamber-based measurements of soil respiration', Agricultural and Forest Meteorology, vol. 113, pp. 21-37.
Denmead, OT, 1979, 'Chamber systems for measuring nitrous oxide emission from soils in the field.', Soil Science Society of America Journal, vol. 43, pp. 89-95.
Healy, RW, Striegel, RG, Russell, TF, Hutchinson, GL & Livingston, GP, 1996, 'Numerical evaluation of static-chamber measurements of soil-atmosphere gas exchange: Identification of physical processes.', Soil Science Society of America Journal, vol. 60, pp. 740-747.