Data Mining Application Using Clustering
Techniques (K-Means Algorithm) In The
Analysis Of Student’s Result
Alkadhwi Ali Hussein Oleiwi 1* Department of System Programming, South Ural
State University (National Research University), 76 Lenina pr., 454080
Chelyabinsk, Russia,
e-mail: [email protected]
Adelaja Oluwaseun Adebayo 2
Department of System programming, South Ural State University (National Research University),
76 Lenina pr., 454080 Chelyabinsk, Russia,
e-mail: [email protected]
Abstract— Analyzing the academic performance of the students in the biology department Kirkuk University Iraq using the K means clustering algorithm was not an easy task as we expected, but through the use of the KNIME tools we were able to obtain some reasonable results which will further assist the department to predict and observe the student’s performance in the academic session for future purposes. Clustering is considered as an unsupervised learning technique based on observations. In this paper, we presented how to obtain the Euclidean distance between two or more clusters, how to determine the new centroid using data mining partitioning approach termed as the K-means algorithm and connection of nodes to obtain the result in KNIME tools.
Keywords—Euclidean distance; KNIME; Clustering; K-Means algorithms; Partitioning approach; Observation
I. INTRODUCTION
Data analysts, economists and statisticians in early 90s referred to data mining using the terms “data dredging” or “data fishing” which involves the practical analysis of data without an a-priori hypothesis. Most data mining processes are significant and their objectives are basically to obtain vital information that can be easily understood in large data sets [1]. Data mining involves the searching of large information of data or records to discover patterns and utilize these patterns in predicting events in the future. Data mining provides easy access to certain set of methods and tools that is applicable to data processing for discovering hidden patterns. We could describe it as a collection of pure driven data algorithms to get meaningful patterns from raw data. Data mining application to student’s performance is known as Educational Data Mining (EDM); which is an important research area aimed at predicting meaningful information obtained from the educational database to enhance the academic performances and improve the possibilities for a better assessment in their learning process for various courses taken by the students [2].
EDM utilizes multiple techniques for clustering and classification such as neural network, k- nearest neighbor, naïve Bayes, and support vector machines, decision techniques based on classifying data sets, k-means, k-mediods and linear regression analysis [3]. Descriptive and predictive analysis can be implemented by rule association mining; classification; and clustering which are the most common techniques [4]. When set of data objects are partitioned into various subsets (clusters), then we consider the descriptive analysis known as clustering.
utilizes clustering. In this work, the partitioning approach to clustering with the k-means method was selected to be utilized on the student’s result obtained during the academic session 2017/2018 in the biology department, Kirkuk University, Iraq. Partitioning approach basically constructs various partitions and evaluates these partitions by some criterion, for example minimizing the sum of square errors [6]. The data sets were analyzed by using the KNIME software application as the analysis platform. KNIME is open source software which makes understanding set of data, designing certain data scientific workflows and reusable components, creating an open continuous integration for new development in data science more accessible to everyone [7].
II. REQUIREMENTS OF CLUSTERING TECHNIQUES.
Certain requirements need to be considered when performing clustering techniques on data sets. Some of these requirements are given:
High dimensionality and Scalability: - involves clustering all data into scalable dimensions instead of only samples.
Ability to deal with attributes of different types such as numerical, binary, categorical, ordinal, linked and mixture of these previously defined types.
Usability and Interpretability.
Discovery of clusters with arbitrary shape.
Ability to handle noisy data with convenience. Constraint based clustering: ability of user to define inputs on constraints through the use of domain knowledge to determine input parameters.
III. CLUSTERING TECHNIQUES APPROACHES
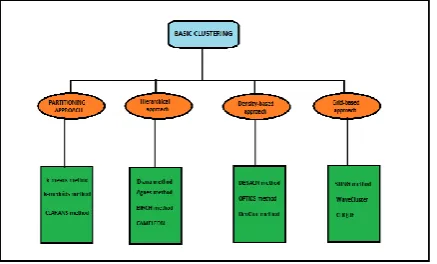
There are several approaches to clustering techniques but for the purpose of this work we selected the partitioning approach with the k-means clustering algorithms for the analysis student’s performance. The four main approaches of basic clustering with their various methods are shown in the figure 1.
Fig.1. Basic Clustering Approach and their Methods.
The comparative definition of the four main approaches and their respective features is shown the table I:
TABLE I. THE FEATURES OF THE APPROACH TO CLUSTERING TECHNIQUE.
APPROACH. FEATURES OF APPROACH TO
CLUSTERING TECHINIQUES.
PARTITIONING
- Find mutually exclusive clusters of spherical shape.
- Effective small to medium size data sets.
- May use mean or medoid to represent the center of clusters.
- Distance – based.
HEIRARCHICAL
- Clustering is a hierarchical
decomposition, this means it is multiple levels.
- May incorporate other techniques such as micro clustering or considering object linkages.
DENSITY-BASED
- May filter out outliers.
-Can find arbitrarily shaped- clusters. - Clusters are dense regions of objects in space that are separated by low-density regions.
- Cluster density
GRID-BASED
- Use a multiresolution grid data structure.
- Fast processing time.
PARTITIONING CLUSTERING APPROACHES
Partitioning technique helps to improve iteration techniques by mining objects from one graph plot to another. The main objective of partition clustering algorithm is to divide the data points into K
partitions. Each partition is responsible for reflecting one cluster [8]. Partitioning a database S of n objects into a set k clusters, such that the sum of squared distances are minimized. Given k, find a partition of k
where k, C, (p – mi)and mi represent the number of clusters, the set of objects in a cluster, the distance between p and mi and the center point of the i-th
cluster.
K-Means Clustering Algorithm.
K-means is one of the most commonly used in clustering algorithm and future learning. It is method of clustering observations into a specific number of disjoint clusters [9]. The aim of the algorithm is to minimize the measurement between the centroid of the clusters and a given observation by iteratively appending the observation to and clusters when the lowest distance is achieved. K-means performance is determined by initialization and appropriate distance measure [10]. The stages of change of the cluster centers and reassign points are iteratively repeated until, until the border of clusters and location of centroids no longer changes, i.e. at each iteration, every cluster will get the same data point [11]. The secondary goal of K-Means clustering is to reduce the complexities in the data. The illustration of how the algorithm works on a synthetic dataset is in Figure 2:
Fig.2. The algorithm working principle on a synthetic set of
data [12].
IV. RELATED WORK
In article [3], k-means clustering algorithms was utilized as a data mining technique to observe and predict the learning activities from student’s database including the class quizzes, mid and final assignments and exams. The information generated after the data mining implementation was helpful for both the students and teachers. The study of the research helped the teachers to reduce the failing ratio by taking necessary steps at the appropriate time which led to an improvement of the student’s performance.
In article [13], the K-means clustering algorithm was applied to predict the academic performance of students. There was also a study of the evaluation factor such as class quizzes, mid and final test and exams on students. It was highly recommended that the correlated information obtained were conveyed to the student’s advisor before the exams took place. The study helped to minimize the
dropout rate to a significant level and improve the performance of the students.
In article [14], research was conducted on data mining in education by analyzing various approaches such as relationship mining, clustering, prediction and discovery of data set with models. The author provided an illustrative example of an analysis which was made on junior secondary school students who benefitted from re-reading and those who didn’t benefit for re-reading. The result of the analysis proved and also determined that students with overall low speed rate in reading, who required special attentions for learning support benefitted more from re-reading.
In article [15], the authors utilized the K-Means clustering to calculate the initial centroids of random selection thereby resulting to reduction in the number of iterations and the improvement of the elapsed time.
In article [16], the author applied the kernel K-means clustering and Smooth Support Vector Machine (SSVM) classification techniques. The result of study conducted, showed model of predictor by using psychometric factors as variables predictor on the student’s academic performance.
In article [17], the author used the clustering technique based on Canberra Distance Similarity and distance measure to observe and group similar behavior of the students of VIT University based upon their past academic performance. The technique also aimed at focusing on the students who were having bad performance by providing extra lectures and motivating them for better study.
FLOW CHART OF K-MEANS CLUSTERING.
Fig.3. Flow Chart of K-Means Clustering.
Pro and Cons of K-Means Clustering Algorithm. PRO:
Ease in the implementation
represents the numbers of clusters; t represents the numbers of iterations implementation. In the normal state k and t << n.
CONS:
Applicable in only situations when the mean is defined.
Not suitable to discover clusters with non-convex shapes and attributes.
Highly sensible to noisy data and Outliers.
STEPS FOR K-MEANS ALGORITHM PROCESSING
randomly choose k objects from database S as the initial cluster centers;
repeat
for each object do
Compute distances from the object to cluster centers;
Assign the object to the cluster with the nearest cluster center,
end
for each cluster do
Calculate the mean value of the objects;
end
until no (or minimum) change;
V. IMPLEMENTATION
The result of some students in biology department for the University Of Kirkuk, Iraq for academic session in year 2017/2018 was analyzed as the data set sample for this work. We applied the K-Means partitioning approach to the final exams result which served as the training data table. The training data table consists of marks obtained by the students; number of attempts the student made to pass the examination; the number of courses taken by the students and the name of the department which is the biology department. The screenshot of the considered students detail computed in the Microsoft excel format is shown in figure 4:
Fig.4. Student’s Record (Training Sample).
The KNIME data analytics tool is used for implementation of this work. The result of the students with the extension name “csv” was imported from the excel spreadsheet into the file reader which reads file
and build a workflow which produced the obtained results. The workflow model built for this analysis is shown in figure.5:
Fig.5. Workflow Model of the K-Means Clustering Analysis.
The workflow consists of the file reader which is the component that read the student result as the training data sample; the K-Means components performs the clustering algorithm on the training sample to determine the centroid and the minimal distances; the color manager component assigns different colors to the number of clusters produced after the K-means clustering has been performed; the scatter plot is the node which interactively visualizes the relationship between the column in the dataset [18]. The Interactive Table displays the cluster in a tabular form and includes the records ID and the cluster number. The histogram interactive node plots a histogram for the clusters generated from the K-mean clustering node.
VI. RESULT AND DISCUSSIONS
From the analysis conducted, the
representation of the student’s result can categorized into three classes, ranges of the student’s marks and also the no of student within that ranges as shown in the table II:
TABLE II. Grouped Students Result
S/N Class Ranges of
Student’s Mark
No of
Students
within the
ranges.
1. > 80 80.508 – 90.450 8
2. > =60 and < 80 60.064 – 76.995 13
3. > 50 and < 60 51.846 – 57.783 17
Fig.6. Interactive table generated by KNIME for the Student Results.
From the interactive table generated, we obtained a histogram for the three classes of clusters (Cluster_0; Cluster_1; Cluster_2) based on the analysis on the number of attempts taken by the students to pass an examination during the academics session in year 2017/2018. The histogram plot is shown in figure. 7:
Fig.7. Interactive Histogram for the Student Result.
From the students who obtained marks within the range [50 - 54.05]; [54.05 -58.1]; [58.1-62.15]; [62.15 - 66.2]; [66.2 – 70.25] are in same group of Cluster_1, [70.25 – 74.3]; [74.3 – 78.35]; [78.35- 82.4] are in similar Cluster_2, we observed that marks ranging from [82.4 – 86.45] had a little grouping in the Cluster_2 and the majority in the Cluster_0 group. The mark range from [86.45 – 90.5] was grouped as the Cluster_0.
Fig.8. Histogram showing the Student’s grades based on number of Cluster (k).
Several Iterations were performed on the student’s grade using the scatter-plot node of the workflow built in KNIME to ensure that the Euclidean distances between the squares can be calculated to the minimal position. For the iteration 1, we positioned the y-axis and the x-axis to read the clusters from the origin (0, 0).
Fig.9. Scatter Plot with the Clustering of the marks based on the Iteration 1.
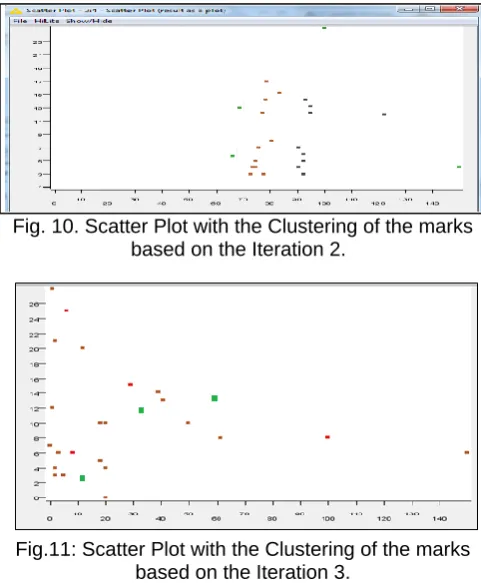
For the iteration 2, we decided to change the color pattern of the clusters, increased the ordinate axis by 1 and the position of the x-axis for ease in calculation of the distance between the points and also to the K-Means clustering based on the distance functions.
Fig. 10. Scatter Plot with the Clustering of the marks based on the Iteration 2.
Fig.11: Scatter Plot with the Clustering of the marks based on the Iteration 3.
Euclidean distances Calculation between clusters points.
Fig. 12: Euclidean distances between the points in the Iteration 3.
From iteration 3, the x1 = 60; x2 = 99; y1 = 8 and y2 = 14, applying the Euclidean distances formula from the equation 2, we obtained the distance as 39.45.
√(𝑥2 − 𝑥1)
2+ (𝑦2 − 𝑦1)
2Equation 2
The Euclidean distance for the iteration 1 -3 was computed by the selecting of cluster points and applying the equation 2 for each point. The minimal distance obtained was from the scattered plot for the iteration 1.
TABLE III. Euclidean distance Results for the Iterations.
S/N Scatter Plot Euclidean distances
1. Iteration 1 11.23
2. Iteration 2 20.04
3. Iteration 3 39.45
K-Means Clustering Calculation Based on the results.
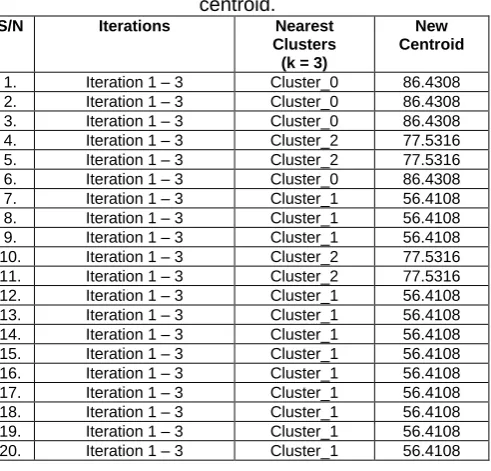
Using equation 1 the partitioning approach, the results for the K-means for the student’s mark is shown the table IV:
TABLE IV. The K-Mean Clustering used to obtain new centroid.
S/N Iterations Nearest Clusters
(k = 3)
New Centroid
1. Iteration 1 – 3 Cluster_0 86.4308 2. Iteration 1 – 3 Cluster_0 86.4308 3. Iteration 1 – 3 Cluster_0 86.4308 4. Iteration 1 – 3 Cluster_2 77.5316 5. Iteration 1 – 3 Cluster_2 77.5316 6. Iteration 1 – 3 Cluster_0 86.4308 7. Iteration 1 – 3 Cluster_1 56.4108 8. Iteration 1 – 3 Cluster_1 56.4108 9. Iteration 1 – 3 Cluster_1 56.4108 10. Iteration 1 – 3 Cluster_2 77.5316 11. Iteration 1 – 3 Cluster_2 77.5316 12. Iteration 1 – 3 Cluster_1 56.4108 13. Iteration 1 – 3 Cluster_1 56.4108 14. Iteration 1 – 3 Cluster_1 56.4108 15. Iteration 1 – 3 Cluster_1 56.4108 16. Iteration 1 – 3 Cluster_1 56.4108 17. Iteration 1 – 3 Cluster_1 56.4108 18. Iteration 1 – 3 Cluster_1 56.4108 19. Iteration 1 – 3 Cluster_1 56.4108 20. Iteration 1 – 3 Cluster_1 56.4108
21. Iteration 1 – 3 Cluster_1 56.4108 22. Iteration 1 – 3 Cluster_2 77.5316 23. Iteration 1 – 3 Cluster_2 77.5316 24. Iteration 1 – 3 Cluster_0 86.4308 25. Iteration 1 – 3 Cluster_1 56.4108 26. Iteration 1 – 3 Cluster_1 56.4108 27. Iteration 1 – 3 Cluster_1 56.4108 28. Iteration 1 – 3 Cluster_1 56.4108 29. Iteration 1 – 3 Cluster_1 56.4108 30. Iteration 1 – 3 Cluster_1 56.4108 31. Iteration 1 – 3 Cluster_2 77.5316 32. Iteration 1 – 3 Cluster_1 56.4108 33. Iteration 1 – 3 Cluster_1 56.4108 34. Iteration 1 – 3 Cluster_2 77.5316
** Using k as 3 which depict the number of clusters. The new centroid was obtained after we computed the K-means formula on
the training samples of the student’s result **
After applying the k-means clustering formula, a new centroid position was obtained for the cluster_0, cluster_1 and cluster_2 with the values “86.4308”; “56.4108” and “77.5316” respectively for the three iterations.
CONCLUSION
In this paper, we implemented a qualitative methodology to determine the Euclidean distance and the values of the k-means algorithms from the three clusters obtained. The research work also provided the pro, cons, the algorithm steps and flow chart for the K-Means clustering process. The student’s results were analyzed by utilizing the K-means node of the
workflow model connection in KNIME tool. The K-means clustering algorithm can serve a better
benchmark to observe the performance of students in every semesters of an academic session therefore it can help Kirkuk University Iraq also other educational sectors to prevent drawbacks and failures in results of students in the future.
ACKNOWLEDGMENT
The authors appreciate South Ural State University, Chelyabinsk, Russia and Kirkuk University, Iraq for providing the necessary tools that were required for the implementation of this research.
REFERENCES
[1] Michael C. Lovell, “Data Mining”, The review of economics and statistics, the MIT press. Vol.65, No. 1 (Feb 1983), pp 1-12.
[2] Adelaja O. Adebayo and Mani S. Chaubey, “Data mining classification techniques on the analysis of student’s performance”. Global Scientific Journals (GSJ) ISSN 2320-9186, vol. 7, issue 4, April 2019, pp 79- 95.
[3] S. Ayesha, T. Musafa, A.Satter and M.Khan, “Data mining model for higher education system”, European Journal of Scientific Research, vol. 43, no 1, 2010. pp. 24-29.
[4] Jiawei. Han, “Data mining- Concepts and Techniques” 2nd
[5] Jonathan.C.Prather, M.S. “Medical Data Mining: Knowledge Discovery in a clinical Data warehouse ”, 1995.
[6] M.Zymbler, “Clustering in Data Mining”, pp 1-23, South Ural State University, Chelyabinsk, Russia,
May, 2016.
[7] Open for KNIME software innovation, [Electronic-Resources] URL:
https://www.knime.com/knime-software/
[8] Swandeep. S.J and Dr. Sharnil Pandya, “An overview of partitioning algorithms in clustering techniques”, IJARCET, vol.5, Issue 6, June 2016 pp 1943-1946.
[9] The K-means clustering algorithm, [Electronic-Resources] URL:
http://kom.aau.dk/group/04gr742/pdf/kmeans_worksh eet.pdf
[10] Ke Chen, “Machine Learning K-means clustering”, University of Manchester, pp 1-22.
[11] David Sontag, “Clustering K-means”, New
York University, pp
1-36,[Electronic-Resources]URL:http://people.csail.mit.edu/dsontag/co urses/ml12/slides/lecture14.pdf.
[12] Neural Network, “Machine Learning (The working principle of K-means Clustering algorithm) on any synthetic data set” pp. 1-17.
[13] Md Hedayetul I.S, “Prediction of Student Academic Performance by an Application of K-Means Clustering Algorithm”, IJARCSSE, Vol.2, No.7, July 2012.
[14] Baker RSJD, “Data Mining for education”,
International encyclopedia of education. Vol.7, pp. 112-118, 2010.
[15] Azhar Rauf, Sheeba, “Enhanced K-Mean clustering Algorithm to reduce number of iterations and time complexity”, Middle-East Journal of Scientific Research, Vol. 12, No 7, pp. 959-963, 2012.
[16] Sajadin.S, “Prediction of student academic performance by an application of data mining techniques”,International Conference on Management and Artificial Intelligence IPEDR, IACSIT Press, Vol.6, 2011.
[17] Kartik.N.S et al, “Clustering Students’ based on previous academics performance”, IJERA, Vol.3, Issue 3, May-June 2013, pp 935-939.
[18] Scatter Plot KNIME platform, E-learning course [Electronic-Resource] URL: