INTERNATIONAL JOURNAL OF PHARMACEUTICS & DRUG VOL.5 ISSUE 3, 2017; 43 – 48 ; http://ijpda.com
Research Article
DEVELOPMENT AND VALID
TION OF RP HPLC ME
FOR THE ESTIMATION OF A
FUZOSIN IN TABLET FORM
LATION
Mr. Rahul R. Mishra., Mr. Parag T. Bakshe., Mr. Hemant D.Patil.,
Prof. (Dr.) Rajesh Y. Chaudhari., Prof. (Dr.) Vijay R. Patil
T.V.E.S.’s Hon.L.M.C.College of Pharmacy, Fai pur- 425 503, Dist-Jalgoan, (M.S.), India.
Date Received: 7th February 2017; Date accepted:
5th March 2017; Date Published: 7th
Abstract
A new simple, rapid, precise and accurate assay method was developed forestimation of Alfuzosin in pure form and tablet form. The analyte was s parated on a C8 (Primesil) column (5 µm, 4.6mm*
250 mm).The mobile phase was Acetonitrile:0.05 % Ortho Phosphoric Acid(40:60, v/v) after adjusting pH to 3.2 this pumped at 0.7 mL/min flow rate it passes all the parameters satisfactorily. The UV detector was operated at 242 nm for the determin tion of all the drugs. Linearity, accuracy and prec sion were found to be acceptable over the conce tration ranges of 10-50 µg/ml for Alfuzosinwith a R2of value0.997. The optimized methods proved to
be specific, robust and accurate for the quality co trol of drugs in bulk drug and pharmaceutica formulations.
Keywords: Alfuzosin, Method Validation, HPLC,
C8 Column
INTRODUCTION
Drugs play a vital role in the progress of human civilization by curing diseases. Analytical chem
PHARMACEUTICS & DRUG ANALYSIS
http://ijpda.com; ISSN: 2348-8948
DEVELOPMENT AND
VALIDA-ETHOD
TION OF
AL-LET
FORMU-Mr. Rahul R. Mishra., FORMU-Mr. Parag T. Bakshe.,
Prof. (Dr.) Rajesh Y. Chaudhari., Prof. (Dr.) Vijay R. Patil
T.V.E.S.’s Hon.L.M.C.College of Pharmacy, Faiz-Jalgoan, (M.S.), India.
; Date accepted: March 2017
A new simple, rapid, precise and accurate assay method was developed forestimation of Alfuzosin in pure form and tablet form. The analyte was
se-(Primesil) column (5 µm, 4.6mm* Acetonitrile:0.05 % Ortho Phosphoric Acid(40:60, v/v) after adjusting pH to 3.2 this pumped at 0.7 mL/min flow rate it passes all the parameters satisfactorily. The UV detector was operated at 242 nm for the
determina-acy and preci-sion were found to be acceptable over the concen-50 µg/ml for Alfuzosinwith a of value0.997. The optimized methods proved to be specific, robust and accurate for the quality con-trol of drugs in bulk drug and pharmaceutical
Alfuzosin, Method Validation, HPLC,
Drugs play a vital role in the progress of human civilization by curing diseases. Analytical
chemi-stry is divided into two branches
quantitative1. Today a majority of the drugs used
are of synthetic origin. These are produced in bulk and used for their therapeutic effects in pharm ceutical formulations. Pharmaceutical product quality is of vital importance for patient safety. Pharmaceutical analysis is the b
that is responsible for developing sensitive, reliable and accurate methods for the estimation of drugs in pharmaceutical dosage forms and biological fluids.2
Alfuzosin (AFN) is a selective antagonist of post synaptic alpha1-adrenoreceptors, which are l cated in the prostate, bladder base, bladder neck, prostatic capsule, and prostatic urethra.
chemically 3-[(4-amino-6,7-dimethoxy 2-yl)- methyl-amino]propyl] tetrahydrofuran carboxamide.7 Several methods are available in the
literature for the determination, most of these m thods are for the determination of Alfuzosin sep rately in bulk and formulation. Analytical methods reported for quantitative determination of Alfuz sin individually in pharmaceutical formulations by HPLC,8,9,10,11, HPTLC11, UV12,13,, colorimetry
in biological fluids by HPLC17,18.
According to the Literature review, there are only few HPLC method reported for the determination of Alfuzosin but they are very com
suming. Therefore, an attempt has been made to develop simple, accurate, precise and rapid RP HPLC methods for determination of
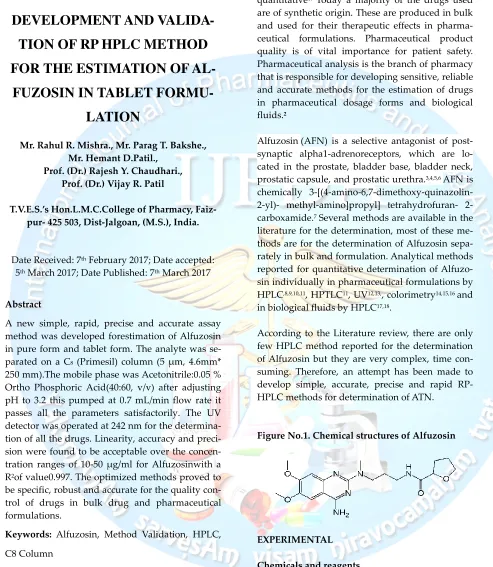
Figure No.1. Chemical structures of
EXPERIMENTAL
Chemicals and reagents
Alfuzosinis obtained as generous gift sample from Swapnroop drug and pharmaceutical
Alfusin® tablets that were manufactured by Cipla.
stry is divided into two branches qualitative and majority of the drugs used are of synthetic origin. These are produced in bulk and used for their therapeutic effects in pharma-ceutical formulations. Pharmapharma-ceutical product quality is of vital importance for patient safety. Pharmaceutical analysis is the branch of pharmacy that is responsible for developing sensitive, reliable and accurate methods for the estimation of drugs in pharmaceutical dosage forms and biological
is a selective antagonist of post-adrenoreceptors, which are lo-cated in the prostate, bladder base, bladder neck, prostatic capsule, and prostatic urethra.3,4,5,6 AFN is
dimethoxy-quinazolin-amino]propyl] tetrahydrofuran- 2-ral methods are available in the literature for the determination, most of these me-thods are for the determination of Alfuzosin sepa-rately in bulk and formulation. Analytical methods reported for quantitative determination of
Alfuzo-maceutical formulations by , colorimetry14,15,16 and
.
According to the Literature review, there are only few HPLC method reported for the determination of Alfuzosin but they are very complex, time
con-Therefore, an attempt has been made to develop simple, accurate, precise and rapid RP-HPLC methods for determination of ATN.
1. Chemical structures of Alfuzosin
Ltd., containing Alfusin (AFN) 10 mg, were col-lected from local market. Acetonitrile, methanol and water used were of HPLC grade (Merck, In-dia). Ortho-phosphoric acid was AR grade (Merck, India). A 0.2 µm nylon filter (Pall life Sciences, Mumbai, India) was used. All other chemicals and reagents used were analytical grade unless other-wise indicated.
Apparatus
The chromatographic system (Younglin (S.K) Geadient System) consisted of a prominence sol-vent delivery module, a manual injector with a 20 µL fixed loop and a UV-visible detector. The sepa-ration was performed on a C8 (Primesil) column (5
µm, 4.6mm* 250 mm) at an ambient temperature. Chromatographic data were recorded and processed using Autochro -3000 software. An Fast clean ultrasonicate cleaner (India) was used for degassing the mobile phase.Shimadzu UV 1800 double beam UV visible spectrophotometer and Sansui DJ-150S-S electronic balance were used for Spectrophotometric and weighing purposes re-spectively.
Chromatography Conditions
Chromatographic separations of active substance was obtained by using C8 (Primesil) column (5 µm,
4.6mm* 250 mm),.Mobile phase Acetonitrile:0.05 % Ortho Phosphoric Acid(40:60, v/v) was prepared, filtered through a 0.2 µm nylon filter and degassed for 5 min in an ultrasonicator. The mobile phase was pumped through the column at 0.7 mL/min flow rate. Analyses were carried out at ambient temperature with detection at 242 nm. The injec-tion volume was 20 µL and each analysis.
Standard Solutions
Accurately weight and transfer 10mg Alfuzosin working standard into 10 mL volumetric flask as about diluent acetonitrile completely and make volume up to the mark with the same solvent to get 1000µg/mL standard (stock solution) and 15 min sonicate to dissolve it and the resulting stock solution 0.1mL was transferred to 10 mL volume-tric flask and the volume was made up to the mark with mobile phase Acetonitrile: (0.05%OPA) Water, prepared in (4mLACN : 6mL WATER v/v) solvent.
Sample Solution
Weigh 20 Alfusin tablets and calculated the aver-age weigh, accurately weigh and transfer the sam-ple equivalent to 0.075 mg Alfuzosin into 10 ml volumetric flask. Add about 8ml of diluent and sonicate to dissolve it completely and make vo-lume up to the mark with diluent. Mix well and filter through 0.45 µm filter. Further pipette 0.3ml of the above stock solution into a 10 ml volumetric flask and dilute up to the mark with diluents.(30 µg/ml). The amounts of Alfuzosin per tablet were calculated by extrapolating the value of area from the calibration curve.
Validation of Proposed Method Calibration curve (linearity)
Accurately measured aliquots of working standard solutions equivalent to 10-50 µg/mL AFN, trans-ferred to series of 10 mL volumetric flasks and the contents of the flasks were diluted to volume with mobile phase. A 20 µL aliquot of each solution was injected in triplicate into the liquid chromatogra-phy. The conditions including the flow rate of mo-bile phase at 0.7 mL/min, detection at 242 nm. A calibration curve for each drug was obtained by plotting area under the peak versus concentration.
Figure
No.
2. Calibration curve of Alfuzosine.Accuracy (% recovery)
Recovery studies were carried out by adding a known amount of pure drugs AFN to a pre
ana-y = 55.38x - 37.01 R² = 0.997
0.00 500.00 1000.00 1500.00 2000.00 2500.00 3000.00
0 20 40 60
Mishra RR et al; Int J. Pharm. Drug. Anal, Vol: 5, Issue: 3, 2017; 43-48 Available online at http://ijpda.com
lyzed sample solution. These studies were carried out by spiking 80%, 100% and 120% respective drug. The recovery studies showed that the results were within acceptable limits, above 99% and be-low 101%. The results are given in (Table 2).
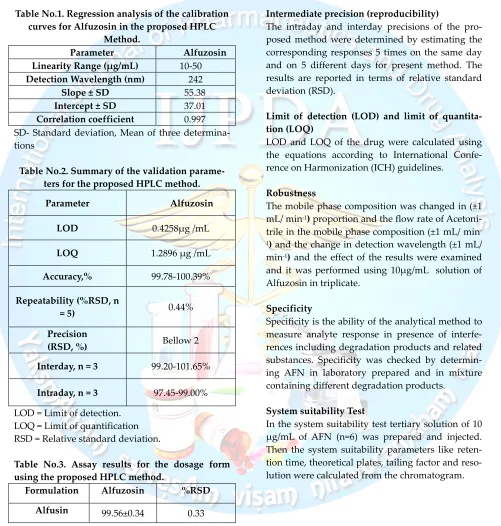
Table No.1. Regression analysis of the calibration curves for Alfuzosin in the proposed HPLC
Method.
Parameter Alfuzosin Linearity Range (µg/mL) 10-50 Detection Wavelength (nm) 242 Slope ± SD 55.38 Intercept ± SD 37.01 Correlation coefficient 0.997 SD- Standard deviation, Mean of three determina-tions
Table No.2. Summary of the validation parame-ters for the proposed HPLC method.
Parameter Alfuzosin
LOD 0.4258µg /mL
LOQ 1.2896 µg /mL
Accuracy,% 99.78-100.39%
Repeatability (%RSD, n
= 5) 0.44%
Precision
(RSD, %) Bellow 2
Interday, n = 3 99.20-101.65%
Intraday, n = 3 97.45-99.00%
LOD = Limit of detection. LOQ = Limit of quantification RSD = Relative standard deviation.
Table No.3. Assay results for the dosage form using the proposed HPLC method.
Formulation Alfuzosin %RSD
Alfusin 99.56±0.34 0.33
SD= Standard deviation, 5 determinations. Method precision (repeatability)
The precision of the developed method was as-sessed in terms of repeatability, intraday and
inter-day precision by analyzing six replicate standard samples. The % R.S.D. values of the results corres-ponding to the peak area and retention time were expressed for intra-day precision and on 3 days for inter-day precision.
Intermediate precision (reproducibility)
The intraday and interday precisions of the pro-posed method were determined by estimating the corresponding responses 5 times on the same day and on 5 different days for present method. The results are reported in terms of relative standard deviation (RSD).
Limit of detection (LOD) and limit of quantita-tion (LOQ)
LOD and LOQ of the drug were calculated using the equations according to International Confe-rence on Harmonization (ICH) guidelines.
Robustness
The mobile phase composition was changed in (±1 mL/ min-1) proportion and the flow rate of
Acetoni-trile in the mobile phase composition (±1 mL/ min -1) and the change in detection wavelength (±1 mL/
min-1) and the effect of the results were examined
and it was performed using 10µg/mL solution of Alfuzosin in triplicate.
Specificity
Specificity is the ability of the analytical method to measure analyte response in presence of interfe-rences including degradation products and related substances. Specificity was checked by determin-ing AFN in laboratory prepared and in mixture containing different degradation products.
System suitability Test
In the system suitability test tertiary solution of 10 µg/mL of AFN (n=6) was prepared and injected. Then the system suitability parameters like reten-tion time, theoretical plates, tailing factor and reso-lution were calculated from the chromatogram.
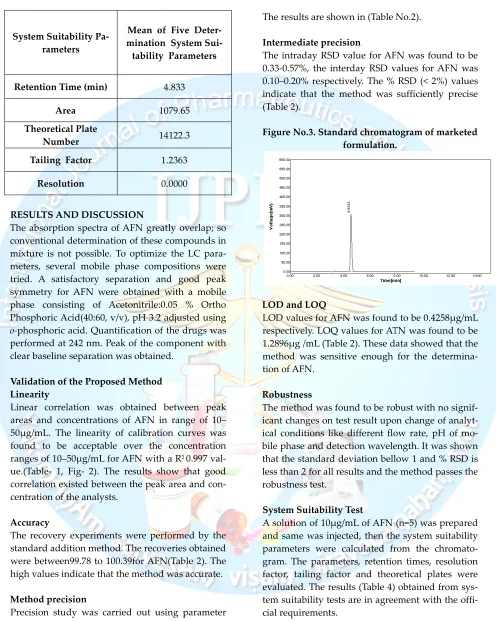
System Suitability Pa-rameters
Mean of Five Dete mination System Su tability Parameters
Retention Time (min) 4.833
Area 1079.65
Theoretical Plate
Number 14122.3
Tailing Factor 1.2363
Resolution 0.0000
RESULTS AND DISCUSSION
The absorption spectra of AFN greatly overlap; so conventional determination of these compounds in mixture is not possible. To optimize the LC par meters, several mobile phase compositions were tried. A satisfactory separation and g
symmetry for AFN were obtained with a mobile phase consisting of Acetonitrile:0.05 % Ortho Phosphoric Acid(40:60, v/v), pH 3.2 adjusted using
o-phosphoric acid. Quantification of the drugs was performed at 242 nm. Peak of the component with clear baseline separation was obtained.
Validation of the Proposed Method Linearity
Linear correlation was obtained between peak areas and concentrations of AFN in range of 10 50µg/mL. The linearity of calibration curves was found to be acceptable over the conc
ranges of 10–50µg/mL for AFN with a R
ue.(Table- 1, Fig- 2). The results show that good correlation existed between the peak area and co centration of the analysts.
Accuracy
The recovery experiments were performed by the standard addition method. The recoveries obtained were between99.78 to 100.39for AFN(Table 2). The high values indicate that the method was accurate.
Method precision
Precision study was carried out using parameter like method repeatability study which showed that results were within acceptable limit i.e. % RSD b low 2.0 indicating that the method is reproducible.
Mean of Five Deter-mination System Sui-tability Parameters
4.833
1079.65
14122.3
1.2363
0.0000
The absorption spectra of AFN greatly overlap; so conventional determination of these compounds in mixture is not possible. To optimize the LC para-meters, several mobile phase compositions were tried. A satisfactory separation and good peak symmetry for AFN were obtained with a mobile phase consisting of Acetonitrile:0.05 % Ortho Phosphoric Acid(40:60, v/v), pH 3.2 adjusted using phosphoric acid. Quantification of the drugs was performed at 242 nm. Peak of the component with
baseline separation was obtained.
Linear correlation was obtained between peak areas and concentrations of AFN in range of 10– 50µg/mL. The linearity of calibration curves was found to be acceptable over the concentration 50µg/mL for AFN with a R2 0.997
val-2). The results show that good correlation existed between the peak area and
con-The recovery experiments were performed by the ion method. The recoveries obtained for AFN(Table 2). The high values indicate that the method was accurate.
Precision study was carried out using parameter like method repeatability study which showed that results were within acceptable limit i.e. % RSD be-low 2.0 indicating that the method is reproducible.
The results are shown in (Table No.2).
Intermediate precision
The intraday RSD value for AFN was found to be 0.33-0.57%, the interday RSD values for AFN 0.10–0.20% respectively. The % RSD (< 2%) values indicate that the method was sufficiently precise (Table 2).
Figure No.3. Standard chromatogram of formulation.
LOD and LOQ
LOD values for AFN was found to be
respectively. LOQ values for ATN was found to be 1.2896µg /mL (Table 2). These data showed that the method was sensitive enough for the determin tion of AFN.
Robustness
The method was found to be robust with no signi icant changes on test result upon change of analy ical conditions like different flow rate, pH of m bile phase and detection wavelength. It was shown that the standard deviation bellow 1 and % RSD is less than 2 for all results and the method passes the robustness test.
System Suitability Test
A solution of 10µg/mL of AFN (n=5) was prepared and same was injected, then the system suitability parameters were calculated from the chromat gram. The parameters, retention times, resolution factor, tailing factor and theoretical plates were evaluated. The results (Table 4) obtained from sy tem suitability tests are in agreement with the off cial requirements.
CONCLUSIONS
The proposed LC method presented in this paper Table No.2).
The intraday RSD value for AFN was found to be 0.57%, the interday RSD values for AFN was 0.20% respectively. The % RSD (< 2%) values indicate that the method was sufficiently precise
3. Standard chromatogram of marketed formulation.
values for AFN was found to be 0.4258µg/mL values for ATN was found to be 1.2896µg /mL (Table 2). These data showed that the method was sensitive enough for the
determina-The method was found to be robust with no signif-icant changes on test result upon change of analyt-onditions like different flow rate, pH of mo-bile phase and detection wavelength. It was shown that the standard deviation bellow 1 and % RSD is less than 2 for all results and the method passes the
10µg/mL of AFN (n=5) was prepared and same was injected, then the system suitability parameters were calculated from the chromato-gram. The parameters, retention times, resolution factor, tailing factor and theoretical plates were ble 4) obtained from sys-tem suitability tests are in agreement with the
Mishra RR et al; Int J. Pharm. Drug. Anal, Vol: 5, Issue: 3, 2017; 43-48 Available online at http://ijpda.com
has advantages of simplicity, accuracy, precision and convenience for separation and quantitation of AFN in combination and can be used for the assay of their respective dosage form. Moreover, the proposed LC method is a stability indicating assay method that can determine AFN in presence of their degradation products. Thus, the proposed LC method can be used for the quality control of AFN in typical laboratories.
ACKNOWLEDGEMENTS
The authors are thankful to Cipla Pvt. Ltd for sup-plying generous gift samples of pure drugs.
References:
1. JefferyG. H., J. Bassett, J. Mandham and R. C. Denny, editors. Vogel’s Text Book of Quantita-tive Chemical Analysis. 5th ed. U.K.: Longman Scientific and Technical Pub: 3-4, (1994) 2). 2. Watson D., Pharmaceutical Analysis. 1st ed.
Edinburgh: Churchill Livingstone: 1-11, (1999). 3. McKeage K, Plosker GL: Alfuzosin: a review of the therapeutic use of the prolonged-release formulation given once daily in the manage-ment of benign prostatic hyperplasia. Drugs. 2002;62(4):633-53.
4. Roehrborn C G: Alfuzosin: overview of phar-macokinetics, safety, and efficacy of a clinically uroselective alpha-blocker. Urology. 2001 Dec;58(6 Suppl 1):55-63; discussion 63-4. 5. Wilde MI, Fitton A, McTavish D: Alfuzosin. A
review of its pharmacodynamic and pharma-cokinetic properties, and therapeutic potential in benign prostatic hyperplasia. Drugs. 1993 Mar;45(3):410-29.
6. www.drugbank.ca/drugs
7. Patel .D.B and Patel.N.J, “Development and Validation of Reverse Phase High Performance Liquid Chromatography and High Perfor-mance Thin Layer Chromatography Methods for Estimation of Alfuzosin Hydrochloride in Bulk and in Pharmaceutical Formulations,” In-ternational Journal of ChemTech Research, Vol. 1, No. 4, 2009, 985-990.
8. Deshmukh S.S, Havele S.S, Musale V.V , “Development and Validation of RP-HPLC Method for Simultaneous Estimation of Alfu-zosin Hydrochloride and Dutasteride in
Pharmaceutical Dosage Form,” Scholars Re-search Library, Vol. 2, No. 6, 2010, 342-349. 9. Varshini Ch. A, Kumari K.S, Sushma S. and
Prakash K, “Development And Validation Of RP-HPLC Method For Simultaneous Estima-tion Of Alfuzosin Hydrochloride and Dutaste-ride in Bulk and Pharmaeutical Dosage Form,” Inventi Rapid: Pharm Analysis & Quality As-surance, Vol. 2012, 4, 2012.
10. Kumar K.S.B, Ranjani V.A and Sathyavathi D, “New RP-HPLC Method Development and Validation for Assay of Alfuzosin Hydrochlo-ride in Tablet Dosage Form,” International Journal of Pharmacy and Pharmaceutical Sciences, Vol. 2, No. 4, 2010, 90-92.
11. Fayed A.S , Shehata M.A, Hassan N.A and Weshahy S.A, “Validated HPLC and HPTLC Stability-Indicating Methods for Determina-tion of Alfuzosin Hydrochloride in Bulk Powder and Pharmaceutical Formulations,” Journal Of Separation Science, Vol. 29, No. 18, 2006, 2716-2724.
12. VamsiKrishna M and GowriSankar D, “Opti-mization and Validation of Quantitative Spec-trophotometric Method for the Determination of Alfuzosin in Pharmaceutical Formulations,” E-Journal of Chemistry, Vol. 4, No. 3, 2007, 397-407. UV
13. Safwan A, Fawaz C and Roula B, “Spectropho-tometric determination of Alfuzosin Hydroch-loride in Pharmaceutical Preparations with Some Sulphonepthelein Dyes,” International Journal of Biomedical Science, Vol. 2, No. 3, 2006, 273-278.
14. VamsiKrishna M and GowriSankar D, “New Diazo Coupling Reactions for Visible Spectro-metric Determination of Alfuzosin in Pharma-ceutical Preparations,” E-Journal of Chemistry, Vol. 4, No. 4, 2007, 496-501.
15. VamsiKrishna M and GowriSankar D, “Oxida-tive Coupling, Complex Formation and Inter-nal Salt Formation Reactions for Visible Spec-trophotometric Determination of Alfuzosin Hydrochloride in Pharmaceutical Formula-tions,” The Pharma Review, June-July2007, 143-145.
For-mulations,” Journal of Pharmacy Research, Vol. 4, No. 1, 2011, 226-228.
17. Carlucci G, Giuseppe D.E.and Mazzeo P, “De-termination of Alfuzosin in Human Plasma by High-Performance Liquid Chromatography with Column-Switching,” Journal Liquid Chromatography and Related Technologies, Vol. 17, No. 18, 1994, . 3989-3997.
18. Wiesner J.L., Suther l , Van Essen G.H., Hundt H.K.L., SwartK.J., “Selective, Sensitive and Rapid Liquid Chromatography-Tandem Mass Spectrometry Method for the Determination of Alfuzosin in Human Plasma,” Journal of Chromatography B, Vol. 788, No. 2, 2003, 361-368.
19. ICH, Q2A, Text on Validation of Analytical Procedures, International Conference on Har-monization, Geneva, October 1994, 1-5.
20. ICH, Q2B, Validation of Analytical Proce-dures: Methodology, International Conference on Harmonization, Geneva, November 1996, 1-8.
21. USP 25-NF20, Validation of compendia me-thods section (1225) (United States Pharma-copeia Convention, Rockville, Maryland, USA, 2002), 2256.
22. United State Pharmacopoeia, Revision Bulletin Official July 1, 2011, 1-2.