A Quick Detection Method of Corner Point of Hazardous
Chemicals Stacking Based on Angle Coefficient
1Beijing Institute of Petrochemical Technology, School of Information Engineering, Beijing, China. 2Beijing University of Chemical Technology, Control Engineering, Beijing, China.
* Corresponding author. Tel.: 13581652075; email: [email protected] Manuscript submitted March 30, 2018; accepted May 13, 2018. doi: 10.17706/jcp.13.11 1300-1308.
Abstract:
The storage of hazardous chemicals is closely related to the safety and well-being of the people
and the city. Currently, the evenly lay the warehouse in a stacking way is widely used. Hence, the safety conditions especially the “5-distances” have become a key factor during safety monitoring. In this paper, safe storage distance detection based on binocular vision is studied, and a contour-based rapid corner detection method for stacking hazardous chemicals is proposed. This method uses a pre-processed image. First, an edge-thinning algorithm is used to reduce noise. The image then undergoes a hierarchical search and a two stage edge classification, the corners are determined based on the combination of the threshold and the angular coefficient. Experiments have shown that the accuracy of corner detection by this algorithm is 73%, and the time for single image processing is less than 250ms.Keywords: Storehouse stacking, corner detection, contours, edge segmentation.
1.
Introduction
Nowadays, the demand for warehouses for hazardous chemicals has increases dramatically as society develops; hazardous chemicals however pose a severe risk to public safety as such chemical are highly flammable, corrosive or even explosive. In light of these problems, there is an urgent need for an internal safety monitoring and warning system for safe storage of dangerous chemical [1]. The current monitoring system for hazardous chemical storage is based video surveillance [2], it is unable to guarantee the absolute safety of chemicals warehouses, labour intensive, and does not provide real-time safety data. This method is inefficient and is not compatible with the informatization of modern cooperation.
Machine vision [3] is a rapidly developing branch of artificial intelligence. Three-dimensional measurement of binocular visions is extensively used and is a potential development direction for research on the image processing of hazardous chemicals storage. Stacking safety "5-distance"(stacking distance, wall distance, column spacing, lamp spacing and beam spacing) is an important factor in the safe storage of hazardous chemicals. Aiming at this issue,a “Hazardous Materials Stacking distance detection and restoration system” based on binocular vision was designed; it is an effective means for monitoring the "5-distance"-one of the key elements to determine the shape of the image is corner detection. Therefore, with the combination of Hazardous Materials Stacking standard, this is formed by multiple lines. This paper presents a simple and effective corner detection algorithm using rapid detection method of image contour based on angle coefficient, accurately extracting the corner to complete the "5-distance", achieving three-dimensional restoration, realizing real-time monitoring and early warning.
algorithm based on the image edge contour first extracts the edge mapping of the input image and then detects the angle and point by analysing the shape information of the edge contour. Mokhtarian and Suomela [4] have proposed a classical angle and point detection algorithm based on the curvature-scale space; however, it is difficult to determine the threshold. Wang Zhan [5] used a set of self-similar binary Gabor wavelet transform filters to divide the entire frequency domain into multiple sub-bands from high frequency to low frequency , and to differentiate the output of the filter at two different scales and determine the whether it is the angle and point . Awrangjeb and Lu [6] proposed a multi-chordal corner detection algorithm based on chord-point distance accumulation (CPDA), which does not utilize any first-order and second-order derivatives leading to better noise robustness. Michał Choraś [7] proposed a human body recognition method based on the human ear image; it performs the contour detection algorithm, normalizes the coordinates and used invariant geometric methods to detect the feature points.
Stacks usually consist of of standard containers(cuboids, cubes) and have basic features such as corners of line segments .The distance can be accurately determined based on the corner points, thus a contour-based corner point extraction method is proposed and using edge segmentation angle coefficient classification algorithm to extract corners of hazardous chemicals stacks can improve the accuracy and speed of corner extraction and have important research significance for subsequent stereo matching, distance monitoring and 3D restoration.
2.
Image Pre-processing
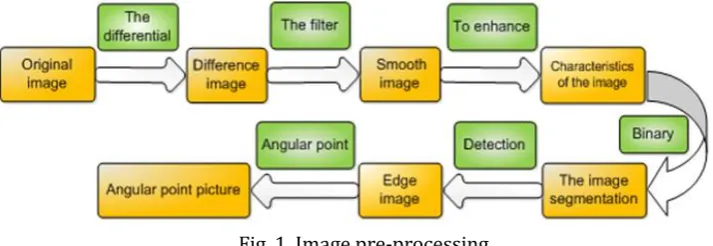
The goods in hazardous chemicals warehouse mainly store in the tank body .Due to the complexity of the background environment and the noise of the body itself, in order to reduce the analysis complexity and improve the accuracy of the measurement system, the images need to be pre-processed to ensure the subsequent images analysis. Tank body shape is standardized, the process shown in Fig. 1.
Fig. 1. Image pre-processing.
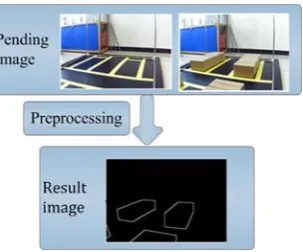
Fig. 2. Experimental results.
3.
Corner Extraction Algorithm
Cabinet surfaces in hazardous chemicals warehouse are influenced by the lighting, colour, text, etc. If grey scaling of the corners is carried out, it will have a greater noise value and interference, and according to the actual situation, a large number of pictures are need to be done, so to improve efficiency is also necessary.
The pixel value distribution of image outline is more regular, concentrated, and discrete distribution. The angle coefficient between the image coordinates where the pixel values are located represents the trend of the line segment. The first pixel coordinates
A( x , y )
1 1 , the second pixel coordinatesB( x , y )
2 2 , the equation ofAB line is obtained by determining a straight line through point A and point B. Then calculate the third pixel
coordinates
C( x , y )
3 3 and fourth pixel coordinatesB( x , y )
2 2 , Angle coefficient3 2
2 2
3 2
tan
k
y
y
x
x
isdetermined ,when
tan
2
tan
1 is greater than a given threshold, edge segmentation is performed, and the pixel value of this point is the point. Two linear segments are performed; the flowchart is shown in Fig. 3.Fig. 3. Corner point detection flow chart.
3.1.
Edge Thinning
Fig. 4. Refine the rule diagram.
subsequent judgment of the angular coefficients. Therefore, the "two-in-four normalization" refinement rule is selected based on the multiple sets of contour images, and the excess noise of the edge lines is removed, More useful information can be stored, the schematic shown in Fig. 4.
3.2.
Layered Search
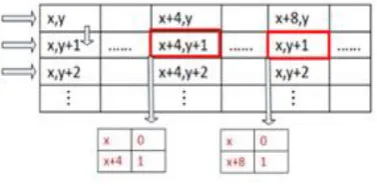
After the edge refinement of the image, extraction of the pixel value coordinates can be processed using the hierarchical search method. Generally, multiple contour boxes will be involved in the image, and the operation need to carried out on two adjacent two pixel coordinates for it to be meaningful. Therefore, the search cannot be ergodic and must be regular. Hierarchical search algorithm will detect the first value according to the neighbourhood gradient as a corner point, using the search box from top to bottom, from left to right, as shown in Fig. 5.The experimental results show that when there is no pixel value in 15 * 15 region, it can be noise point. The first layer search is completed, setting the pixel point to 0, and process next level search. And so on.
Fig. 5. Search diagram.
When the search is complete, the order coordinates of the corresponding pixels are obtained. The calculation of Angle coefficient of adjacent coordinates is carried out.
3.3.
Two Level Edge Classification
2 1
1
2 1
tan
y
y
x
x
(1)(2)
After the secondary section, the first level of excess Angle is removed, and the accuracy is improved.
3.4.
Corner Determination
Secondary classification of pixels for preservation, the adjacent coordinates are compared, as shown in formula (3)(4).The final angular coordinates are obtained within the tolerance range.
Based on the coordinates of single-layer pixel points obtained by hierarchical search, the angular coefficient 1
tan
……
tan
n is calculated. As shown in formula (1). The positive and negative slopes are then added up toremove the raised part
k +k
i i+ 1=0
. Due to the process of refinement and searching, the angular coefficient value is obtained is more normalized. The positive and negative values oftan
and the infinite values will segment the line, the head and tail coordinates are obtained, this is the first segment.
25
25
i i+ 1
i i+ 1
y
y
x
x
(3)
,
2
2
i i+ 1 i i+ 1
o o
y
y
x
x
y
x
(4)The threshold of two adjacent coordinates in the equation is set to 25. In the allowable error, the mean operation of the two coordinates is performed, and the number of error corners is greatly reduced.
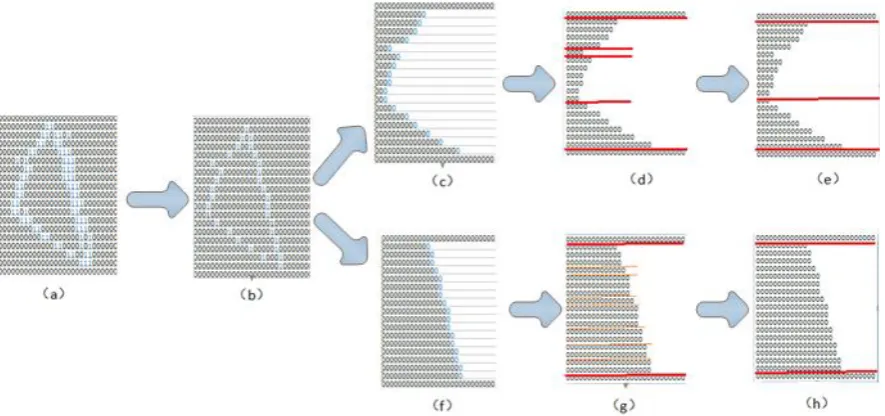
The process is accomplished by edge refinement, hierarchical search, two-level classification, and corner point determination. The operation diagram is shown in Fig. 6. For the sake of convenience, a triangle taken as an example.
Fig. 6. Schematic diagram of operation.
The result is shown, (b) is the result of the (a) for edge thinning. The (c) and (f) are hierarchical search results. The (d) and (g) are subsections of the first order edge according to the angular coefficient, and the (e) and (h) are divided into two stages according to the results of the first level edge segmentation, Finally, the coordinates of the corner points are obtained.
4.
Analysis of Experimental Results
In the laboratory environment, the two-megapixel CMOS binocular camera is placed, and a box with dimensions 130×80×90mm is used, it is set up in a 2×1×1m simulated warehouse environment, and the image processing of a 100 different stacking combinations is completed. In this paper, the evaluation index ACU (accuracy) criterion [14] and the actual running time of the algorithm are used for comprehensive evaluation. The principle of ACU is shown in formula (5).
+ =
2
2
N N
N N
ACU
(5)
of the algorithm consist of the extraction of all pixels from the image, completion of all operations of the corner point algorithm, and the extraction results of the final corner point. Some experimental data are shown in Table 1.
Table 1. Experimental Data
Number
True Corner Number
Omission Corner Number
Wrong Corner Number
ACU
Time/S
1 6 2 0 0.87 0.031
2 10 2 2 0.69 0.086
3 15 5 6 0.73 0.211
4 11 4 3 0.75 0.156
5 13 5 5 0.73 0.176
6 18 7 9 0.69 0.245
7 22 9 7 0.73 0.249
8 12 3 5 0.75 0.205
9 9 1 1 0.90 0.053
10 13 4 7 0.71 0.157
Fig. 7. Algorithm corner result.
The classical algorithms such as Shi-Tomasi point detection and Sub-Pixel corner detection are compared with
(a)
Shi-Tomasi(b)
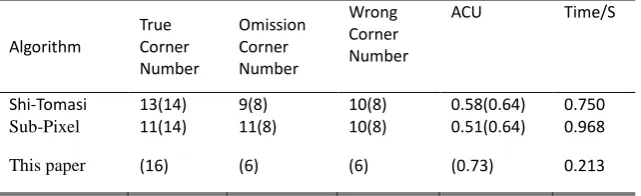
Sub-Pixelthe algorithm in this paper. The number of real corners of the box is 22. 13 of 13 (14) represents the true Angle points of grey scale. 14 in "13 (14)" denotes the Angle of the contour plot, the rest is shown above. The related images are shown in Fig. 7. The evaluation results are shown in Table 2.
Table 2. Evaluation of Algorithm Results
Algorithm
True Corner Number
Omission Corner Number
Wrong Corner Number
ACU Time/S
Shi-Tomasi 13(14) 9(8) 10(8) 0.58(0.64) 0.750
Sub-Pixel 11(14) 11(8) 10(8) 0.51(0.64) 0.968
This paper (16) (6) (6) (0.73) 0.213
The results shows based on contour point detection, the detection of grey value have increased by 6 %, the algorithm in this paper shows an improvement by 9 % compared to other algorithms, and the effect on time was significantly reduced by 500ms running time.
5.
Conclusion
In the use of binocular vision to monitor the safe stacking distance of hazardous chemicals, the corner extraction can be regarded as a key link during the process of image processing of stacking distance monitoring and three-dimensional restoration of the cargo. In this paper, a quick detection method based on the corner coefficient of the contour is proposed. After the edge refinement, hierarchical search and two-level edge classification, the determination of the threshold of corner detection can be realized. Experiments show that this algorithm can effectively improve the efficiency and recognition accuracy; his proves significant to research involving stereo matching and distance measurement. The next step is to study the correlation between the noise generated in the pre-processing images and the corner recognition algorithm leading a further optimized algorithm.
Acknowledgment
The article has been supported by Project of Upgrading the Innovation Ability of the Municipal Education
Committee of Beijing (2016014222000041), National Key Research and Development Program (2016YFC0801500).
References
[1] Lv, X. (2014). Research on UWB-based location technology applied for hazardous chemicals stacking storage. Proceedings of the 26th Chinese Control and Decision Conference (2014 CCDC)(pp. 3596-3601). [2] Peng, Y. (2013). Design and implementation of electric power monitoring and controlling system based
on the internet. Harbin Institute of Technology.
[3] Quan, Y. (2013). On-machine 3D measurement of workpiece dimensions based on binocular vision.
Optics and Precision Engineering, 4(032).
[4] Mokhtarian, F., & Suomela, R. (1998). Robust image corner detection through curvature scale space.
IEEE Transactions on Pattern Analysis and Machine Intelligence, 20(12),1376-1381.
[5] Wang, Z. (1999). Multi-scale wavelet based two dimensional corner detection. Journal of National University of Defense Technology,21(2), 46-49.
[6] Awrangjeb, M., & Lu, G. (2008). Robust image corner detection based on the chord-to-point distance accumulation technique.IEEE Transactions on Multimedia, 10(6),1059-1072.
[8] Elgammal, A., Harwood, D., & Davis, L. (2000). Non-parametric Model for Background Subtraction[C]//European Conference on Computer Vision. Berlin, Heidelberg: Springer.
[9] Chandra, E., & Kanagalakshmi, K. (2011). Noise elimination in fingerprint image using median filter. Int. J. Advanced Networking and Applications, 2(06), 950-955.
[10] Otsu, N. (1979). A threshold selection method from gray-level histograms. IEEE Transactions on Systems, Man, and Cybernetics, 9(1), 62-66.
[11] Vala, M. H. J., & Baxi, A. (2013). A review on Otsu image segmentation algorithm. International Journal of Advanced Research in Computer Engineering & Technology (IJARCET),2(2), 387-389.
[12] Green, B. (2005). Canny Edge Detection Tutorial.
[13] Xu, H. (2014). Improved Edge Thinning Method.Laser and Infrared, 44(3), 319-324.
[14] Mokhtarian, F., & Mohanna, F. (2006). Performance evaluation of corner detectors using consistency and accuracy measures. Computer Vision and Image Understanding, 102(1), 81-94.
Liu Xue Jun was born in May,1977 in He Bei, China. From 1996 to 2000, he studied at Yanshan University for undergraduate in electronic information engineering. From 2001 to 2004, he studied at Yanshan University for master in circuit and system. From 2007 to 2011, he received the Ph.D in broadband communication network at Beijing University of Posts and Telecommunications.
Dr. Liu is currently a master's degree supervisor at Beijing Institute of Petrochemical Technology. His research interests include hazardous chemicals storage safety and binocular vision.
Yuan Bixian was born inHeBei, China onAugust29, 1994. From 2012 to 2016, she studied at Beijing Institute of Petrochemical Technology for undergraduate in technique and instrumentation of measurements. From 2016 to 2019, she studied at Beijing University of Chemical Technology for master in control engineering.
Ms. Yuan Bixian is currently a master of Beijing University of Chemical Technology, her research interests include hazardous chemicals storage safety and early warning of dangerous.
Zhang Yun Qi was born inBeijing, China in November, 1997. From 2016 to 2020, he studied atBeijing Institute of Petrochemical Technology for undergraduate in computer science and technology.
Mr. Zhang Yun Qi is currently an undergraduate of Beijing Institute of Petrochemical Technology. His research interests include hazardous chemicals storage safety and binocular vision.
Wei Yuchen was born in Beijing, China in June ,1995. From 2013 to 2017, he studied at Gengdan Institute of Beijing University of Technology for undergraduate in information engineering. From 2017 to 2010, he studied at Beijing Institute of petrochemical technology for master in mechanical engineering.
Mr. Wei Yuchen is currently master of Beijing Institute of petrochemical technology. His research interests include software embedded and image processing.
Zhang Zefang was born inHebei, China in August, 1997. From 2015 to 2018, he studied at China University of BIPT (Beijing) for undergraduate in Department of Automation.
Lu Hao was born in shandong, China in October, 1992. From 2010 to 2014, he studied at China University of Petroleum (Shan Dong) for undergraduate in process equipment and control engineering. From 2015 to 2018, he studied at Beijing University of Chemical Technology for master in control engineering.
Mr. Lu Hao is currently a master of Beijing University of Chemical Technology, his research interests include hazardous chemicals storage safety and fiber sensing.
Dai Bo was born in Xi’an, China in October, 1962. From 1980 to 1984, he studied at Zhejiang University for undergraduate/ bachelor in automation. From 1988 to 1991, he studied at Tsinghua University for graduate / master in automation.