QUALITY LABS OF FABRICS WITH SIMPLE
DESIGNS 'COMPARATIVE STUDY'
Sabah Abd Alaziz Alkasaby
Department of Spinning, Weaving and Knitting, Faculty of Applied Arts, Helwan University, Egypt
ABSTRACT
There is no doubt that progress in the textile industry is linked to the extent of the continuing improvement in
product quality and compatibility with the requirements of consumers, and here lies the fundamental importance
of monitoring the quality and performance starting from the receipt of raw materials and even reach the final
product of the cloth so as to ensure its compliance with the specifications laid down and free of defects.
Manufacturing better products is the best way that leads to manufactured faster and cheaper. There are four basic characteristics determine the quality clothing fabrics (aesthetic quality - the quality of durability -
physiological comfort quality - Quality of Care).
The aim of this research is to compare between different samples of fabrics with simple designs using different
blends of the weft and various structures of textiles to get the best sample in terms of quality labs according to
the measured properties.
A total of Thirty-six woven fabrics were produce by using Four kind of woven constructions were chosen
namely, Plain 1/1, Twill 2/2, Twill 1/3 and Satin 4, each one were weaved using 100 % Flax yarns were used in
warp direction (22yarn / cm), 28/1 Cotton. Five kind of weft blend were used, 28/1 Cotton 100 % Flax yarn,
100% Cotton 20/1 Cotton, 100%Wool 45/2 Cotton, 100% Viscose 24/1 Cotton, 100% Fibro 24/1, Cotton, (25
pick/cm). The best results obtained showed that: In general, the plain weave was the highest value quality labs
according to the measured properties. The group 2 was the highest value quality labs e according to the
measured properties (84.22%).The best sample in the samples produced in terms of quality labs was
(2Viscose-1 Flax) for plain(2Viscose-1/(2Viscose-1(group3).
Keywords: Aesthetic Quality, Fabrics With Simple Designs, Fibro, Quality Labs, Woven
Constructions.
I. INTRODUCTION
There is no doubt that progress in the textile industry is linked to the extent of the continuing improvement in product quality and compatibility with the requirements of consumers, and here lies the fundamental importance of monitoring the quality and performance starting from the receipt of raw materials and even reach the final product of the cloth so as to ensure its compliance with the specifications laid down and free of defects.
Quality eight major dimensions from which to determine the extent of achieving product requirements to the expectations of the customer are as follows
1) Performance It is the basic group of the product characteristics such as the final finishing, the competitive. 2) Reliability is the product performance stability and the continuation of quality for a specific period of time. 3) Durability Product for the survival of its functioning.
4) Serviceability It is intended to after-sales service 5) Aesthetics mean the appearance and shape of the product
6) Special/ Added Features It is the additional properties of the product, such as customer safety and ease of use and preservation of the environment
7) Conformance is the extent of matching and appropriateness of to the specific characteristics of the product and its specifications derived from the expectations and requirements of the client
8) Perceive Quality is a special reputation of the company and its products may notice that the client often evaluates the quality of the product through the company's reputation [1, 2, 3].
The output quality is not just a check products to ensure compliance with the specifications agreed upon, but a scientific method and to contribute to the economic production of goods on a high level of quality through the following:-
Quality of design in terms of design specification development and scale required quality and abuses permitted where
Quality in the implementation of the design in terms of selecting the best means to implement the specifications
Follow up the design implementation. Manufacturing better products is the best way that leads to manufactured faster and cheaper. [4, 5]
There are four basic characteristics determine the quality clothing fabrics (aesthetic quality - the quality of durability - physiological comfort quality - Quality of Care)
It has been the division of every property to the group of elements
Aesthetic quality includes (color-dye effect - Luster - Transparency - Drape - Texture - Handle - over the resilience compression of the cloth)
Quality of durability includes (and durability - abrasion resistance - flexibility - plasticity - dimensional stability)
Quality of physiological comfort includes (moisture absorption - thermal conductivity - connecting electricity – weight)
Quality of care includes (the ability of resilience - dimensional stability - chemical reactions - heat resistance or the ability of a possible heat - biological resistance - ability to bear sunlight and resistance raised by the harmful)[6,7].
products and therefore the product Textile design process is, in fact, constructivism process or structural and not merely decorative or color process [8, 9].
II. MATERIALS AND EXPERIMENTAL METHODS
2.1 Fabrics Specifications
Table (I
, II
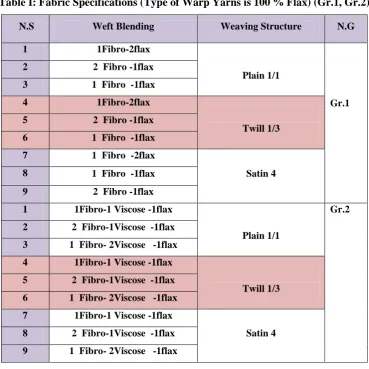
) show the specification of the produced fabrics and weaving construction. 100 % Flax yarns were used in warp direction 28/1 Cotton (22yarn / cm. Five kindof weftwere blend used, 28/1 Cotton 100 % Flax yarn, 100% Viscose 24/1 Cotton,100% Fibro 24/1Cotton, 100% Cotton 20/1 Cotton, 100 % Wool 45/2 Cotton (25 pick/cm). The samples are divided into four groups are shown in Table (I, II).Table I: Fabric Specifications (Type of Warp Yarns is 100 % Flax) (Gr.1, Gr.2)
N.S Weft Blending Weaving Structure N.G
1 1Fibro-2flax
Plain 1/1
Gr.1
2 2 Fibro -1flax
3 1 Fibro -1flax
4 1Fibro-2flax
Twill 1/3
5 2 Fibro -1flax
6 1 Fibro -1flax
7 1 Fibro -2flax
Satin 4
8 1 Fibro -1flax
9 2 Fibro -1flax
1 1Fibro-1 Viscose -1flax
Plain 1/1
Gr.2
2 2 Fibro-1Viscose -1flax
3 1 Fibro- 2Viscose -1flax
4 1Fibro-1 Viscose -1flax
Twill 1/3
5 2 Fibro-1Viscose -1flax
6 1 Fibro- 2Viscose -1flax
7 1Fibro-1 Viscose -1flax
Satin 4
8 2 Fibro-1Viscose -1flax
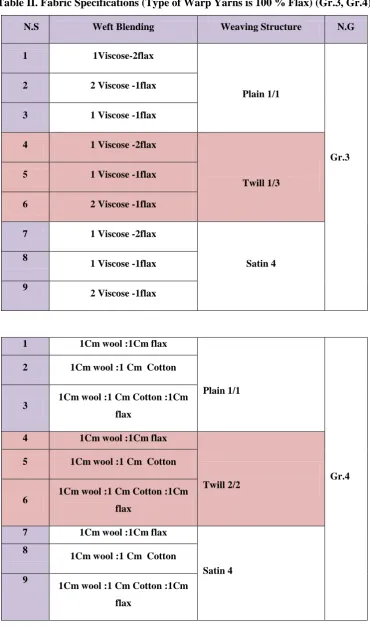
Table II. Fabric Specifications (Type of Warp Yarns is 100 % Flax) (Gr.3, Gr.4)
N.S Weft Blending Weaving Structure N.G
1 1Viscose-2flax
Plain 1/1
Gr.3
2 2 Viscose -1flax
3 1 Viscose -1flax
4 1 Viscose -2flax
Twill 1/3
5 1 Viscose -1flax
6 2 Viscose -1flax
7 1 Viscose -2flax
Satin 4 8
1 Viscose -1flax
9
2 Viscose -1flax
1 1Cm wool :1Cm flax
Plain 1/1
Gr.4
2 1Cm wool :1Cm Cotton
3 1Cm wool :1 Cm Cotton :1Cm
flax
4 1Cm wool :1Cm flax
Twill 2/2
5 1Cm wool :1Cm Cotton
6 1Cm wool :1 Cm Cotton :1Cm
flax
7 1Cm wool :1Cm flax
Satin 4 8
1Cm wool :1Cm Cotton
9
1Cm wool :1 Cm Cotton :1Cm
2.2 Testing and Analysis
Laboratory tests on the produced samples were carried out at the standard conditions for textiles with an air temperature (20+2̊C) and relative humidity of air (65 ± 5 %) according to the American Society of Testing Materials (ASTM). Tests applied to samples are:-
2.2.1- Fabric tensile strength (kg) and elongation (%) was determined according to ASTM standard test method
[9]
2.2.2- Fabric Crease Recovery (Degree). 2.2.3- Fabric Thickness test (Mm).
2.2.4- Fabric Square Meter Weight (G m). 2.2.5- Fabric Water Absorption (Second).
2.3 Overall Quality of the Fabrics Produced Evaluation
Been evaluated the quality of fabrics produced in terms of the measured properties to choose the best sample in terms of (weaving types, types of fabric blend), and transferring the results of measurements of these properties averages to compare relative values (without units) ranging between (zero: 100), where the greatest value is the comparison are the best in all properties with the exception of the measured weight and water absorption shall be at least comparative value is the best.
The following equations have been used to calculate the relative value comparison. [11]
X
QF+ = --- ×100 Where x is the average reading test and X max of the highest reading X max
X Min Where x average reading test X men read less QF- = --- ×100
X
III. RESULTS AND DISCUSSION
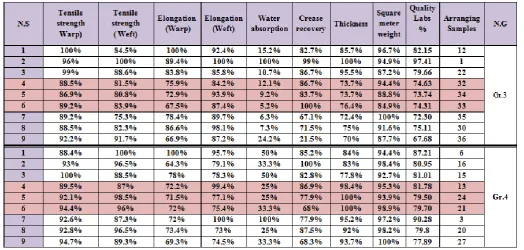
Quality labs samples of and the measured properties and arranged for fabrics produced four groups are shown in Table (III: IV). Figure (1: 4) shows the quality labs of samples produced of each group of four groups. And figure (5) shows the arranging of four groups in terms of average quality labs according to the measured properties. Figure (6) shows the Arranging of all samples produced depending on quality labs.
highest value quality labs. The maximum of quality labs was (1Fibro-1Viscose-1Flax) for plain1/1, while the minimum was (1Fibro-2Viscose-1Flax) for satin4.
Figure1.Quality Labs of Samples Produced of Group1
Figure2.Quality Labs of Samples Produced of Group2
Figure (3) shows the quality labs of samples produced of group3. It is clearly shown that In general, there is a convergence between the values of quality labs. It is clearly shown that In general, the plain weave was the highest value quality labs,while
Figure3.Quality Labs of Samples Produced of Group3
Table IV. The Arranging Samples Produced According to the Quality Labs (Group3, Group4)
Figure (4) shows the quality labs of samples produced of group4.It is shown that the amount of quality labs showed great variance according to the measured properties. The maximum of quality labs was (1Cm wool-1Cm flax) for Twill 2/2, while the minimum was (wool-1Cm wool-wool-1Cm cotton-wool-1Cm flax) for Twill 2/2.
Figure (5) shows the arranging of four groups in terms of average quality labs according to the measured properties .It is shown that group 2 was the highest value of quality labs e according to the measured properties (84.22%), followed by group 4 (82.01%), then followed by group 1(80.19%), while group3(77.44%) was at least.
Figure4.Quality Labs of Samples Produced of Group4
Figure5.Arranging of Four Groups in Terms of Average Quality Labs According to the
Figure5.Arranging of all Samples Produced Depending on Quality Labs.
IV. CONCLUSIONS
In this study, through the evaluation of samples produced at the properties measured according to the quality labs by using Four kind of woven constructions were chosen namely, Plain 1/1, Twill 2/2, Twill 1/3 and Satin 4, each one were weaved using 100 % Flax yarns were used in warp direction (22yarn / cm), 28/1 Cotton. Five kind of weft blend were used, 28/1 Cotton 100 % Flax yarn, 100% Cotton 20/1 Cotton, 100%Wool 45/2 Cotton, 100% Viscose 24/1 Cotton, 100% Fibro 24/1, Cotton, (25 pick/cm). From the results, the following conclusions can be made:
In general, the plain weave was the highest value quality labs according to the measured properties with different types of weft blend were used. The group 2 was the highest value quality labs e according to the measured properties(84.22%), followed by group 4(82.01%), then followed by group 1(80.19%), while group3 (77.44%) was at least.
-The best sample in the samples produced in terms of quality labs was (2Viscose-1 Flax) for plain1/1(group3).
REFRENCES
[1] S. S. Osman "Designing a database to improve the quality system in textile industry"PhD thesis, Faculty of Applied Arts, Hel. University, Egypt, 2012.
[2] T. M. Abdel-Mohsen"Contemporary planning entrances andthe adjust output "The overall quality Systems, CairoEgypt, 2010.
[3] D. Gravin "Competing on the eight dimensions of quality ", Harvard Business Review, November, 1987. [4] A. R. Bendary "The quality of design and the productivity of the upholstery fabrics between the present
[5] M. M. Hussain M. Meligi "Science and arts Journal, H. Univ., Egypt, 22(3) , 2010, 53.
[6] S. A. A. Alkasaby "The effect of some woven construction on fabric aesthetical properties for some university" Master's degree , Faculty of Applied Arts, Hel. University, Egypt, (1996).
[7] N. G. Harries, E. H. Harries "Textile decision which making for the consumer, New York, 1972.
[8] A. Z. Ismail " Determine the most appropriate textile structure combinations to achieve the physiological properties of comfort to wear sports training in the Egyptian climatic conditions" Master's degree, Faculty of Applied Arts, H. University, Egypt ,2008.
[9] S. A. A. Alkasaby" The effect of Textile design on some properties of comfort to cellulosic fabrics blended with wool" International Journal of Advance Research in Science and Engineering, 4(10) , 2015. [10] ASTM “Breaking Load and Elongation of Textile Fabric”, D-1682-94 (1994).