Article
Production Strategy Development: Simulation of
Dependencies Using Recurrent Fuzzy Systems
Matthias Brönner * , Sebastian Wolff, Jelena Jovanovic, Konstantin Keuthen and Markus Lienkamp
Institute of Automotive Technology, Technical University of Munich, Boltzmannstraße 15, 85748 Garching, Germany; [email protected] (S.W.); [email protected] (J.J.); [email protected] (K.K.); [email protected] (M.L.)
* Correspondence: [email protected]; Tel.: +49-89-289-15907
Received: 19 November 2019 ; Accepted: 29 December 2019; Published: 1 January 2020
Abstract: New and unsaturated markets are predominantly located in countries with low incomes. To successfully establish businesses in these new markets, an increasing globalization of value creation is necessary. The integration of these new markets is challenged by their dynamics, turbulence and regulation. Above all, an initially low and volatile demand as well as high barriers for market entry must be counteracted by economical small-series production. As market development is a major challenge for Small and Medium Enterprises (SME), knowledge about the impact of local conditions on their production strategy decisions is essential. Therefore, we design a recurrent fuzzy model combining country- and company-specific input factors as well as internal production parameters to obtain a transparent and reproducible impact statement. The model allows a simplified development of the expert knowledge base by mapping the influences in two steps. The application of the designed model is based on the example of the aCar mobility project, within which an electric vehicle was designed for local value creation in Africa. By applying the model for different African countries, strategy sensitivities can be identified, and recommendations derived.
Keywords:fuzzy logic; decision-making; recurrent fuzzy systems; production strategy; new markets; Africa
1. Introduction
Entering new markets offers companies a new opportunity, which is gaining importance due to stagnation of previous growth markets. Therefore, the companies’ strategic challenge is largely determined by the interaction between product, process and market innovation [1]. Presently, new and unsaturated markets can be found above all in Africa. However, many African countries strive for local added value by means of tariff and non-tariff trade barriers [2,3]. At the same time, the inhibition threshold for SME to open new locations in these countries is high. From an operational perspective, manufacturing costs of a local production site must be lower than the sum of imported product manufacturing, transport and tax per piece. Additionally, the manufacturing costs of a locally manufactured product must be lower than the sum of manufacture, transport and taxes of imported products [4]. Furthermore, political stability and volatile demand is a risk for companies to invest in local value adding. However, there are advantages of local production facilities, such as future prospects of a high volume of solvent customers and the contribution to the development of this region. As an example, the avoidance of import duties as well as low labor and transport costs positively effect product costs [4]. Simultaneously, sales opportunities increase due to a positive brand image that is associated with local value creation. Local production supports company-wide CO2savings
by shortening transport distances. Finally, a distributed production network provides flexibility to
balance global demand fluctuations [5]. In summary, besides the opportunities in unsaturated African markets, an investment in these countries is associated with financial risks. Due to these risks and long planning horizon for new locations, a strategic orientation of local production is crucial [4].
For strategic planning it is, therefore, essential to integrate external conditions in African countries into the design of production sites. Concurrently, the company’s strategic goals and customer requirements regarding the product must be taken into account. In addition to these external influences, there are internal dependencies between the configuration parameters of a production. This increases the complexity of the development of a new production plant and leads to longer planning times. Especially for SME it is, therefore, essential to reduce planning times and to provide these dependencies of the production strategy fast and transparent to achieve a reliable result. For this task we present our model, which allows the highlighting of dependencies and to map decisions based on expert knowledge in a model, in order to reduce the effort for planning new locations.
For this reason, the production strategy in African countries is described first (Section 2.1). Then, Multi-Criteria Decision Methods (Section2.2.1) are evaluated and fuzzy theory is discussed in detail (Section2.2.2). Subsequently, we describe our simulation model for production strategy development in Africa (Section3). In the following application part, we present a case of an electric vehicle manufacturer (Section4). Subsequently, we discuss the meaning of our results (Section5) and conclude with challenges and advantages of our approach as well as applicability for production strategy development (Section6).
2. State of the Art
This section is divided into the basics of production strategies and the theory of the chosen decision method. For this reason, we explain the particularities of strategies in African countries. Subsequently, multi-criteria decision methods and the theory of fuzzy systems are described.
2.1. Production Strategy in African Countries
Production strategy is part of an overarching corporate strategy, representing its functional element [6,7]. Strategies in production include strategic and operational components, and aim to minimize cost and time as well as to provide optimal quality and flexibility [7]. These goals are also valid for companies planning production sites in Africa [3]. Research on production strategy development is divided into process-oriented and structure-oriented approaches [7]. Production strategy development processes consist of an external and internal capability analysis, strategy evaluation and selection as well as strategy implementation [7]. Mefford and Bruun base their strategic production system planning for developing countries on a five-stage process [8]. Starting with the selection of the plant strategy, process characteristics and the production system are selected. Subsequently, operational methods and the human resource policy must be defined [8]. Structure-oriented methods divide production into elements, which are planned separately. Commonly, plant and equipment, production planning and control, labor and staffing, product design and engineering, organization and management are defined as core elements [9].
Independent of the approach of development, production strategy decisions are made between extrema [10]. Thus, these decisions are always a trade-off. A trade-off outlines the fact that a production system can be optimally designed for a task, which is always achieved at the expense of options [9]. There is always a trade-off between cost, time and quality but also between subordinated production configuration decisions [4]. The right trade-off decision is essential for the achievement of competitive advantage [6], which also applies to African countries [3].
considered in strategy development. The number of factors influencing SMEs strategy is company and sector specific. However, studies indicate that SMEs in Africa are more successful in the long term if they take a larger number of challenges into account within their strategic planning [3,13].
2.2. Methods and Models
The development of a production strategy is characterized by conflicting target values, strongly interdependent decisions and uncertainties regarding planning-relevant data [9]. Therefore, we search the literature for an approach fulfilling the following requirements (R.1, R.2, R.3).
As, strategic decisions are individual and depend on the market, product and available technology [6], challenges result from the ability to derive general recommendations and specific decisions under prevailing uncertainties [6,14]. This results inR.1.
R.1.: Linking of external factors with the configuration options of the production system.
As described previously, the planning of a production strategy consists of trade-off decisions [9,15]. To make trade-off decisions when configuring a production system, the impact of a trade-off decision on further trade-off decisions must be taken into account. This is accomplished byR.2.
R.2.: Mapping of the internal cause-effect relationships of the decisions.
Further consistency of a strategy is a requirement (R.3), as consistency must exist between superordinate strategies such as the corporate and production strategy [9,15]. Simultaneously, consistency also needs to be applied by individual decisions within a strategy development [6] (covered byR.2).
R.3.: Integration of corporate strategic objectives into production strategy development.
The databases ScienceDirect and Google Scholar have been analyzed in approaches fulfilling the requirements. These databases are selected based on the inclusion of multidisciplinary research and sources. Therefore, we used the search terminology (“Production Strategy Development”) or (“Operations Strategy Development”) or (“Manufacturing Strategy Development”). The search yielded 61 matches on ScienceDirect and 700 matches on Google Scholar. All results for ScienceDirect as well as the results of the first ten pages of GoogleScholar were examined, since this database arranges the results according to relevance.
Table1 summarizes the literature research findings and visualizes the evaluation, whereby an empty Harvey Ball means “not mentioned”, a quarter-full Harvey Ball means “mentioned in context”, a half-full Harvey Ball means “explicitly described”, a three-quarter-full Harvey Ball means “context systematically integrated” and a full Harvey Ball means “systematically integrated”.
Table 1.Evaluation of literature.
Requirement [8] [9] [10] [16] [17] [18] [19] [20] [21] [22] R.1.
R.2. R.3.
account in decision-making. The consideration of internal dependencies in decision-making (R.2.) is not explicitly discussed in any approach and is only considered in context [8,10,16]. A systematic integration of the superior corporate strategy through defined correlations (R.3.) is shown by [9]. The relevance of corporate goals is also confirmed by other authors [10,17] and integrated, for example, in the top-down approach of Mefford and Bruun [8]. Table1highlights the lack of an approach combining external and internal relationships in a structured way. This approach must integrate the company’s strategic objectives and take multi-criticality of production strategy choices into account.
2.2.1. Multi-Criteria Decision Methods
Following the previous chapter, strategic decision-making depends on several criteria and can therefore be assigned to the category of multi-criteria decision problems. Within these problems, linguistic recommendations and expert knowledge must be analyzed and integrated into the solution finding process. As a result, companies use Multi-Criteria-Decision Methods (MCDM) to formulate strategic decisions [23].
In their study, Velasquez and Hester evaluate MCDMs including application areas as well as advantages and disadvantages [24]. Table2visualizes the methods and our evaluation of suitability. To select an appropriate MCDM, we evaluate the ability of the methods to present cause-effect relationships, weighting of the criteria, necessary system knowledge and data basis to apply this method. Here, + evaluates the integration of the requirement, −for the lack of this possibility andAfor no preference. We found that the fuzzy set theory meets the requirements for mapping cause-effects, variable system boundaries and extensible databases. In general, fuzzy systems allow for problem-specific statements based on expert knowledge [25].
Table 2.Classification of Multi-Criteria-Decision-Methods (based on [24]).
MCDM Cause–
Effect Weight System Data
Basis Exemplary Fields of Application
Multi-Attribute Utility Theory A + − − Economics, finance, energy management Analytic Hierarchy Process − + A + Resource management, corporate strategy
Case-based Reasoning A A A − Economics, vehicle insurance, engineering Data Envelopment Analysis + + − − Economics, road safety, business problems
Fuzzy Set Theory + A + + Engineering, economics, management
Simple Multi-Attribute Rating − + − − Environment, production problems Goal Programming + − A A Production planning, portfolio selection
ELECTRE − + − A Energy, economics, transportation
PROMETHEE − + − A Economics, finance, production
Simple Additive Weighting − + − + Economics, finance, water management
TOPSIS − − A A Supply chain, manufacturing
The advantages of fuzzy logic can be used to optimize MCDM. For example, Göleç uses the Analytic Hierarchy Process method optimized by fuzzy logic (FAHP) to calculate manufacturing performance of companies based on competitive priorities [26]. Similar Mangla et al. use FAHP to evaluate and prioritize sustainable production and consumption trends in supply chains [27] and Kumar et al. use this approach to identify critical factors in technology transfers to India [28].
The technique for order of preferences by similarity to ideal solution (TOPSIS) allows for an efficient comparison of alternatives [29]. Kumar and Garg describe a procedure to connect the set pair analysis based on TOPSIS with interval-valued intuitionistic fuzzy sets for multi-criteria decision-making in rapidly changing economic and social environment [30]. This uncertainty of real-world problems demands for extended measures to keep the advantages of the set pair analysis [31]. Thus, extending the interval-valued intuitionistic fuzzy sets by interval weights allows for a more efficient decision-making [32].
maintenance systems, demand forecasts, production strategy and location decisions as well as supply chain and supplier selection [33]. These approaches show the potential of combining decision methods with fuzzy logic.
2.2.2. Fuzzy Systems Theory
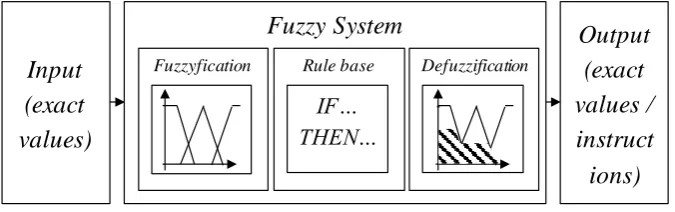
In the fuzzy logic theory, a system is regarded as a representation of reality in an observable and measurable way. A fuzzy system interacts with its environment and can be divided into interdependent subsystems [25]. Fuzzy-logic-based models aim to create a mathematically logical model for decision-making. For this purpose, sharp input values are translated and converted by an IF...THEN... rule basis. These rules are aggregated and output as sharp output values (Figure1).
Fuzzy System
Rule base
IF…
THEN…
µ
Result1Fuzzyfication Defuzzification
Input
(exact
values)
Output
(exact
values /
instruct
ions)
Figure 1.Example of a fuzzy system.
The variables are fuzzificated by a membership function µM that can map values between
0 (no membership) and 1 (full membership) [25]. Recurrent fuzzy systems extend the classic fuzzy approach of IF...THEN... connection by a time step dependency (Figure2). Thus, rules are defined as follows [34–36]:
Ifu(k)isLkxandx(k)isLuq thenx(k+1)isLxw(j,q) (1) For each componentxiof the start vectorxand componentuiof the vectoru, a linguistic variable
Lxi
j or L
ui
q must be defined. It follows that each rule describes the combination of index vectors
of j = (j1, ...jn) andq = (q1, ...qn) resulting in Lxw(j,q). The vectorw represents a trace from(j,q)
to a specific rule. Extending the linguistic variables by a weighting component gxi
L0j,Lj and using conventional sums interference and the center of sumdefuzzificationwith singleton support places
sxw(j,q), the output variablex(k+1)results in (2) [34,36].
x(k+1) = f(x(k),u(k)) = ∑j,q
sxw(j,q)gxL
w(j,q)∏iµ xi
Lj(xi)∏pµ
up
Lq(up) ∑j,qgxLw(j,q)∏iµ
xi
Lj(xi)∏pµ
up
Lq(up)
(2)
f(x,u)
u(k) x(k+1)
z−1 x(k)
Figure 2.Schematic of a first order Recurrent Fuzzy System.
The weighting factors gxi
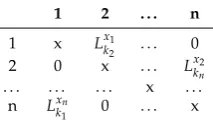
Lin et al. use design structure matrices to map dependencies of complex fuzzy systems. These
n×n-matrices allow for reduction of the required rules [36,37]. In this matrices, existing dependencies are defined by linguistic valuesLxi
kj (Table3). To express these dependencies, membership functions
µxji
i(xi)must be defined [38].
Table 3.Relations and required rule base.
1 2 . . . n
1 x Lx1
k2 . . . 0 2 0 x . . . Lx2
kn . . . x . . .
n Lxn
k1 0 . . . x
3. Model Building
To analyze the effects of external influences, company strategic aims and product characteristics on strategic production decisions, we propose a framework mapping these (external) inputs factors on production configuration parameters first and internal dependencies second (Figure3). The latter ensures required internal consistency [6]. For example, the external input “availability of the local white-collar worker” influences the parameter “necessary qualification measures before start of production”. In the iteration step, the dependency of “necessary qualification measures before the start of production” and the parameter “degree of automation of production” are determined.
Input
n x n Parameter Relation n x m
Input – Parameter –
Relation Parameter a
Parameter b Parameter c …
Parameter n
Input
a
Input
b
Input
c
… Input
m
P
ara
mete
r
a
P
ara
mete
r
b
P
ara
mete
r
c
… Para
mete
r
n
Output
Figure 3.Framework to link (external) input factors and internal parameters.
of the solution finding. To create our model The model was built in MATLAB 2019a using the Fuzzy Logic Toolbox.), we used the procedure of Zimmermann [41] and adapt it by weighting the rules as well as the implementation to three steps:
1. Definition of parameters (input, output and linguistic value range) 2. Construction of relations, generation of rules and weights
3. Application of the time-discrete model
v(k)
f(v,u) u f(x,u)
(k) x(k+1)
z−1 x(k)
Figure 4.Implementation of the framework into a recurrent fuzzy system.
3.1. Definition of Parameters
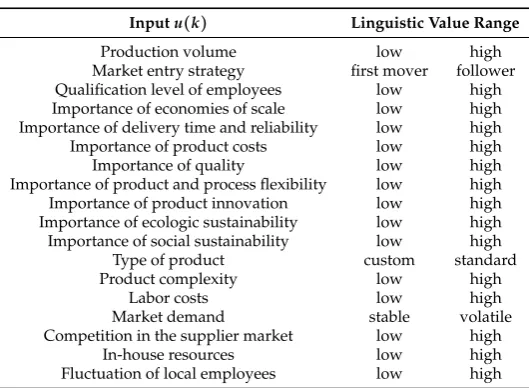
The inputs describe influencing factors of production configuration. The first part of the input variables are corporate strategic competition priorities, since these have a significant influence on the production strategy [6,9]. The inclusion of competitive priorities in the fuzzy system in the form of input variables is essential to ensure a link between corporate and production strategy. Further input variables are, for example, production volume, type of product and investment volume [10], but also external influences such as market dynamics [42], qualification of local workers and personnel costs [4]. This is important as successful companies adapt their production strategy to react to boundary conditions [42]. The inclusion of external influences in strategy development is essential in African countries, due to the challenging and fast changing environment. In total, 18 input variables are selected (Table4) based on [4,6,9,10,15] and described in detail in TableA1.
Table 4.Input parameters.
Inputu(k) Linguistic Value Range
Production volume low high
Market entry strategy first mover follower Qualification level of employees low high Importance of economies of scale low high Importance of delivery time and reliability low high Importance of product costs low high
Importance of quality low high
Importance of product and process flexibility low high Importance of product innovation low high Importance of ecologic sustainability low high Importance of social sustainability low high
Type of product custom standard
Product complexity low high
Labor costs low high
Market demand stable volatile
Competition in the supplier market low high
In-house resources low high
Fluctuation of local employees low high
Table 5.Output parameters.
Outputx(k+1) Linguistic Value Range
Degree of automation low high
Production system push pull
Depth of value added buy make
Production/assembly line structure workshop flow
Process standardization low high
Process linkage low high
Operating material flexibility special multi-functional Equipment operating time temporary series operation
Warehouse concept no stock large stock
Quality control low high
Design stability freeze continuous improvement
Additional worker training low high
Integration of local society and politics low high Manufacturing technology conventional innovative
Production network world factory local for local
Scalability of technology low high
Number of expatriates during ramp up low high Motivation using external incentives low high
3.2. Construction of Dependencies, Rules and Weights
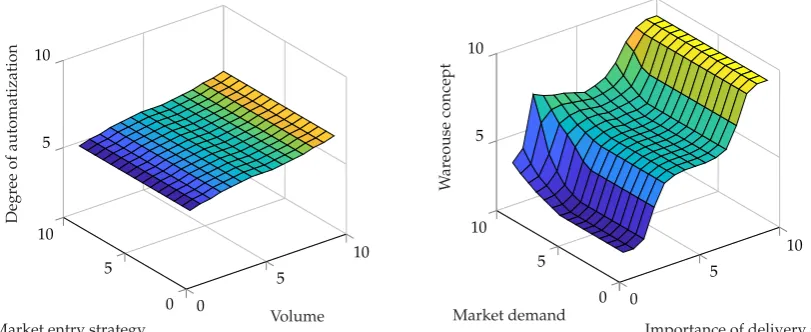
A two-step approach was chosen to define the dependencies and rules. First, rules were derived from literature to be analyzed, extended and weighted by experts in a second step. This was done by means of a written expert survey (n= 9). In total, the IF...THEN rule base of the model consists of 144 rules. The weighting was linguistic and could be chosen from very important to less important. Implemented in the model, a weight (gx,gu) of 1 is very important, 0.6 relatively important and 0.2 less important. Figure5 visualizes the dependency of the output degree of automationon the inputsmarket entry strategyandvolume, given by the rule base and membership functions. Therefore, the degree of automation depends on production volume, but not on the market entry strategy. In comparison, the relationship betweenwarehouse conceptandmarket demandandimportance of delivery timeis visualized.
0
5
10
0 5 10
5 10
Volume Market entry strategy
Degr
ee
of
automatization
0
5
10
0 5 10
5 10
Importance of delivery time Market demand
W
ar
eouse
concept
Figure 5.Comparison of the rule base.
4. Application
The interior and exterior mainly consist of two-dimensional surfaces which are welded or screwed after folding. Due to the electric drivetrain and standardization, the vehicle complexity is low. Low investment costs and the conservation of internal company resources are essential to achieve local added value in a timely manner in various regions. Vehicle quality and delivery times are subordinate to product costs. Within the project, the framework is used to compare production strategies in Kenya and Nigeria.
4.1. Input Parameters
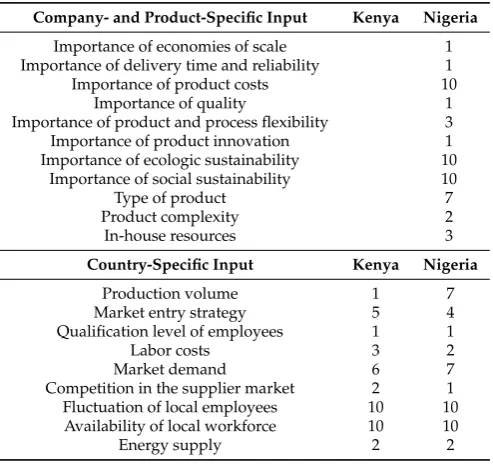
As specified in Section3.1, a distinction must be made between company- and product-specific as well as country-specific input factors. The company- and product-specific input factors (which can be between 1 and 10) are derived from the aCar Mobility project goals and vehicle characteristics. Thus, the values for these input parameters are the same for Nigeria and Kenya. For both countries, a low production volume is assumed for in the beginning (1) despite high market demand for vehicles 6 (Kenya) and 7 (Nigeria). The market entry strategy is simulated with 4 (Nigeria) and 5 (Kenya) due to already producing competitors. Due to lack or insufficient availability of suppliers, these are entered into the model with 2 (Kenya) and 1 (Nigeria). The qualification for vehicle production is not yet available (1) and labor costs are rated at 3 (Kenya) and 2 (Nigeria). The availability of labor force is high (10) as well as their fluctuation (10). The availability and stability of energy supply is low in both countries (2). The Nigerian and Kenyan automotive markets are described in AppendixBand start vector valuesu(k)are summarized in Table6.
Table 6.Input parameters for the application case.
Company- and Product-Specific Input Kenya Nigeria
Importance of economies of scale 1 Importance of delivery time and reliability 1
Importance of product costs 10
Importance of quality 1
Importance of product and process flexibility 3 Importance of product innovation 1 Importance of ecologic sustainability 10
Importance of social sustainability 10
Type of product 7
Product complexity 2
In-house resources 3
Country-Specific Input Kenya Nigeria
Production volume 1 7
Market entry strategy 5 4
Qualification level of employees 1 1
Labor costs 3 2
Market demand 6 7
Competition in the supplier market 2 1 Fluctuation of local employees 10 10 Availability of local workforce 10 10
Energy supply 2 2
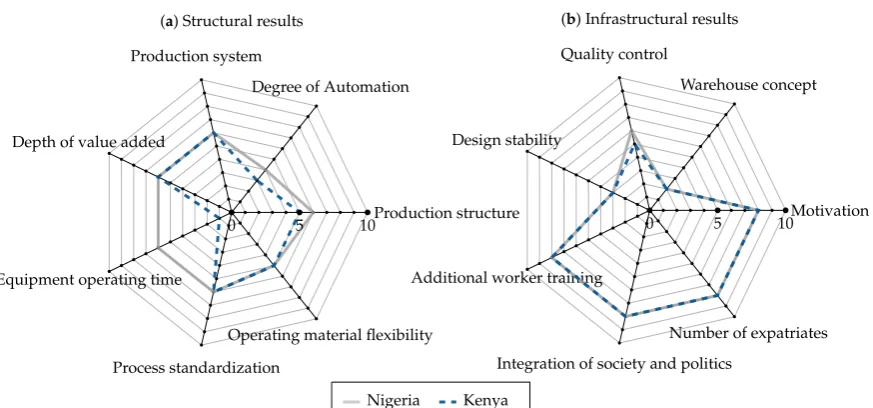
4.2. Simulation Results
(a) Structural results
Degree of Automation Production system
Depth of value added
Equipment operating time
Process standardization
Operating material flexibility
Production structure
0 5 10
(b) Infrastructural results
Warehouse concept Quality control
Design stability
Additional worker training
Integration of society and politics
Number of expatriates Motivation
0 5 10
Nigeria Kenya
Figure 6.Selected structural and infrastructural results.
Figure7a visualizes the change in selected outputs due to internal dependencies. With the iteration, the warehouse concept value (Kenya) changes from 5.82 to 2.17. The change is based on the internal dependency between warehouse concept and production system. As a result, after the iteration, the recommendation changes from a large stock to a low storage volume. With the current rule base, constant values are output after the second iteration. The second comparison in Figure7b shows the influence of weights. In case of the degree of automation, the output is decreased by 25%.
0 1 2 3 4 5
0 2 4 6 8
Iteration
Output
value
(a) Impact of iteration (Kenya)
Standardization of processes (recurrent) Standardization of processes (steady) Operating material flexibility (recurrent) Operating material flexibility (steady) Warehouse concept (recurrent) Warehouse concept (steady)
∆W ∆S ∆O
No Yes
0 2 4 6 8
Weighting
(b) Impact of weights (Kenya)
Degree of automation Depth of value added Design stability
Figure 7.Comparison of system features.
5. Discussion
4.56 in Nigeria and 3.48 in Kenya indicate the preference for manual work, but as much automation as necessary for sufficient quality should be used—as demonstrated at Hero Honda in India [4]. For the warehouse concept, the fuzzy system calculates 2.94 in Nigeria and 2.17 in Kenya. Both values indicate that stocks should be low to keep tied capital low and turnover high. Nevertheless, a minimum stock level must be maintained to avoid breakdowns, due to prevailing unreliable deliveries and infrastructure [4,43]. The minimum stock levels are in line with the production system values, which indicate the use of a pull system but with specific push processes.
The effects of integrating internal dependencies are visualized in Figure7a. A recommendation for high stock levels due to external inputsu(k)would be simulated if internal dependenciesx(k)were not taken into account. The output value is adjusted by∆Wlinking the warehouse concept with the production system, degree of automation and product. In addition to production volume and delivery times, product design also has a significant influence [44]. This low stock level is also possible due to market proximity, which allows for make-to-order production and is in line with previous studies [4,8]. Process standardization and resource flexibility are also significantly changed by integrating internal dependencies (∆Sand∆O). The adaptation of process standardization on product characteristics is always associated with financial expenditure. Concurrently, process standardization allows for a better adaptation of production to the skill level of employees [3,4,8]. By adjusting the results, the relevance of internal dependencies in production strategy development becomes evident.
Adding weights allows for optimization by adjusting the importance of rules [41]. Thus, the reduction of complexity during the rule base generation by experts is possible. Concurrently, the rule base remains manageable as no additional rules are required. This improves the interpretability of the model [36]. For example, the automation level output is reduced by 25% to 3.38 (Figure7b). This is based on the weighting of dependence on production volume, flexibility, training time and standardization. Improving the output quality of the automation degree is essential for a unit cost calculation [4]. This demonstrates that besides the recurrent feedback of the internal dependencies, the weights are essential for a proper production strategy simulation.
A key finding of this study is that the company can transfer infrastructure planning when considering new production facilities in different countries (Figure6). Regarding the structural production parameters, the depth of value added, the production system, process standardization and flexibility of operating resources are transferable. In particular, the planned operating times of the operating resources and their maturity must be planned site-specifically. In summary, based on the two studies, we conclude that a production concept can be successful in different countries if it allows flexibility in selected structural configurations.
6. Conclusions
6.1. Recurrent Fuzzy Systems for Production Strategy Development
After demonstrating the model’s functionality, it becomes evident that the application still requires knowledge about region, product and company to define appropriate input values. Thus, the result quality is strongly dependent on these values. In summary, the following conclusions are reached:
− Implementing qualitative expert knowledge limits this model, as expert knowledge is a subjective statement. Therefore, the model does not allow for a complete and 100% error-free result. + Using recurrent Fuzzy Systems simplifies the gathering of expert knowledge. Complexity is
additionally reduced by recurrence, as experts only must evaluate direct dependencies.
+ Fuzzy models benefit from an extend-able rule base. Further application-specific influencing and output variables can easily be added. Complex relationships and new findings regarding the framework conditions can thus be modeled transparently and quickly.
priorities. Research potential is the extension of the level of detail of the product-specific and country-specific parameters. Adding a monetary evaluation could also improve usability for SME.
6.2. Production Strategies in Africa
The aim of this paper is to present a method for the efficient development of production strategies in Africa, based on a recurrent fuzzy system. For this purpose, the theoretical background of production strategies, especially in Africa, is discussed. Furthermore, different MCDM are presented and the basics of recurrent fuzzy systems are reviewed. After the description of our framework and model we present a use case, discuss our model properties as well as the advantages and disadvantages of this method. This study is limited by the individual case specific to the automotive industry. Furthermore, the presented production parameters must be extended according to the specific application. In addition, our framework and model are to be confirmed in further studies with various companies to demonstrate their further practical suitability. The use case demonstrates the applicability of the model and shows:
Applicability of weighted Recurrent Fuzzy Systems for production strategy development. Benefits of combining cause-effect relations for production system configuration.
Functionality of the simulation model for production strategy development for SME in Africa.
The aim of the Sustainable Development Goals is the improvement of living conditions in Africa. This is crucially impacted by local value adding [45]. Our model supports companies in quickly gaining an assessment of the external influence in Africa on their strategic production decisions. The option to test various corporate strategic goals and their impact creates transparency about local value adding in Africa.
Author Contributions: Conceptualization, M.B. and S.W.; methodology, M.B.; investigation, J.J. and K.K.; data curation, J.J., M.B. and K.K.; writing—original draft preparation, M.B.; writing—review and editing, M.B., S.W. and M.L.; visualization, S.W. and M.B.; supervision, M.L.; All authors have read and agreed to the published version of the manuscript.
Funding:This research received no external funding.
Acknowledgments:M.L. gave final approval of the version to be published and agrees to all aspects of the work. As a guarantor, he accepts responsibility for the overall integrity of the paper. The model is available on GitHub:
https://github.com/TUMFTM/Production_Strategy_Development. Conflicts of Interest:The authors declare no conflict of interest.
Abbreviations
The following abbreviations are used in this manuscript:
SME Small and Medium Enterprise MCDM Multi-Criteria Decision Method GDP Gross Domestic Product GNI Gross National Income
NAIDP Nigerian Automotive Industry Development Plan FAHP Fuzzy Analytic Hierarchy Process
Appendix A. Input and Output Parameters
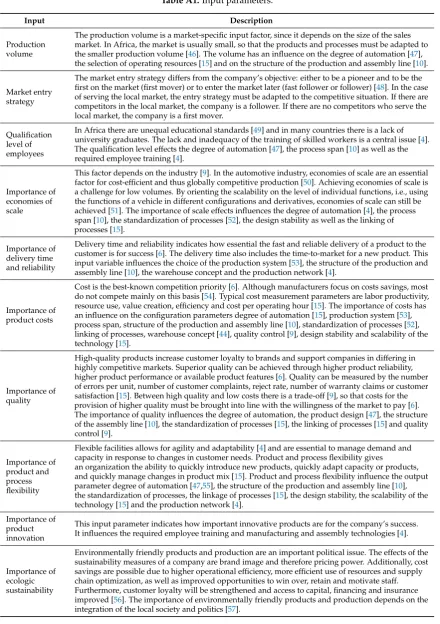
Table A1.Input parameters.
Input Description
Production volume
The production volume is a market-specific input factor, since it depends on the size of the sales market. In Africa, the market is usually small, so that the products and processes must be adapted to the smaller production volume [46]. The volume has an influence on the degree of automation [47], the selection of operating resources [15] and on the structure of the production and assembly line [10].
Market entry strategy
The market entry strategy differs from the company’s objective: either to be a pioneer and to be the first on the market (first mover) or to enter the market later (fast follower or follower) [48]. In the case of serving the local market, the entry strategy must be adapted to the competitive situation. If there are competitors in the local market, the company is a follower. If there are no competitors who serve the local market, the company is a first mover.
Qualification level of employees
In Africa there are unequal educational standards [49] and in many countries there is a lack of university graduates. The lack and inadequacy of the training of skilled workers is a central issue [4]. The qualification level effects the degree of automation [47], the process span [10] as well as the required employee training [4].
Importance of economies of scale
This factor depends on the industry [9]. In the automotive industry, economies of scale are an essential factor for cost-efficient and thus globally competitive production [50]. Achieving economies of scale is a challenge for low volumes. By orienting the scalability on the level of individual functions, i.e., using the functions of a vehicle in different configurations and derivatives, economies of scale can still be achieved [51]. The importance of scale effects influences the degree of automation [4], the process span [10], the standardization of processes [52], the design stability as well as the linking of processes [15].
Importance of delivery time and reliability
Delivery time and reliability indicates how essential the fast and reliable delivery of a product to the customer is for success [6]. The delivery time also includes the time-to-market for a new product. This input variable influences the choice of the production system [53], the structure of the production and assembly line [10], the warehouse concept and the production network [4].
Importance of product costs
Cost is the best-known competition priority [6]. Although manufacturers focus on costs savings, most do not compete mainly on this basis [54]. Typical cost measurement parameters are labor productivity, resource use, value creation, efficiency and cost per operating hour [15]. The importance of costs has an influence on the configuration parameters degree of automation [15], production system [53], process span, structure of the production and assembly line [10], standardization of processes [52], linking of processes, warehouse concept [44], quality control [9], design stability and scalability of the technology [15].
Importance of quality
High-quality products increase customer loyalty to brands and support companies in differing in highly competitive markets. Superior quality can be achieved through higher product reliability, higher product performance or available product features [6]. Quality can be measured by the number of errors per unit, number of customer complaints, reject rate, number of warranty claims or customer satisfaction [15]. Between high quality and low costs there is a trade-off [9], so that costs for the provision of higher quality must be brought into line with the willingness of the market to pay [6]. The importance of quality influences the degree of automation, the product design [47], the structure of the assembly line [10], the standardization of processes [15], the linking of processes [15] and quality control [9].
Importance of product and process flexibility
Flexible facilities allows for agility and adaptability [4] and are essential to manage demand and capacity in response to changes in customer needs. Product and process flexibility gives
an organization the ability to quickly introduce new products, quickly adapt capacity or products, and quickly manage changes in product mix [15]. Product and process flexibility influence the output parameter degree of automation [47,55], the structure of the production and assembly line [10], the standardization of processes, the linkage of processes [15], the design stability, the scalability of the technology [15] and the production network [4].
Importance of product innovation
This input parameter indicates how important innovative products are for the company’s success. It influences the required employee training and manufacturing and assembly technologies [4].
Importance of ecologic sustainability
Table A1.Cont.
Input Description
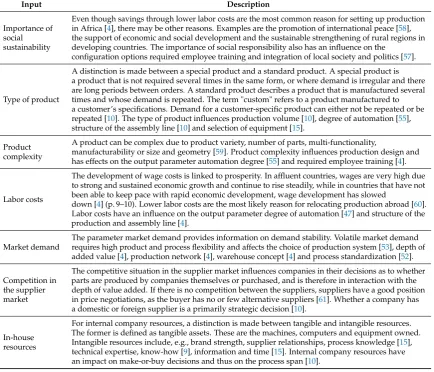
Importance of social sustainability
Even though savings through lower labor costs are the most common reason for setting up production in Africa [4], there may be other reasons. Examples are the promotion of international peace [58], the support of economic and social development and the sustainable strengthening of rural regions in developing countries. The importance of social responsibility also has an influence on the
configuration options required employee training and integration of local society and politics [57].
Type of product
A distinction is made between a special product and a standard product. A special product is a product that is not required several times in the same form, or where demand is irregular and there are long periods between orders. A standard product describes a product that is manufactured several times and whose demand is repeated. The term "custom" refers to a product manufactured to a customer’s specifications. Demand for a customer-specific product can either not be repeated or be repeated [10]. The type of product influences production volume [10], degree of automation [55], structure of the assembly line [10] and selection of equipment [15].
Product complexity
A product can be complex due to product variety, number of parts, multi-functionality,
manufacturability or size and geometry [59]. Product complexity influences production design and has effects on the output parameter automation degree [55] and required employee training [4].
Labor costs
The development of wage costs is linked to prosperity. In affluent countries, wages are very high due to strong and sustained economic growth and continue to rise steadily, while in countries that have not been able to keep pace with rapid economic development, wage development has slowed
down [4] (p. 9–10). Lower labor costs are the most likely reason for relocating production abroad [60]. Labor costs have an influence on the output parameter degree of automation [47] and structure of the production and assembly line [4].
Market demand
The parameter market demand provides information on demand stability. Volatile market demand requires high product and process flexibility and affects the choice of production system [53], depth of added value [4], production network [4], warehouse concept [4] and process standardization [52].
Competition in the supplier market
The competitive situation in the supplier market influences companies in their decisions as to whether parts are produced by companies themselves or purchased, and is therefore in interaction with the depth of value added. If there is no competition between the suppliers, suppliers have a good position in price negotiations, as the buyer has no or few alternative suppliers [61]. Whether a company has a domestic or foreign supplier is a primarily strategic decision [10].
In-house resources
For internal company resources, a distinction is made between tangible and intangible resources. The former is defined as tangible assets. These are the machines, computers and equipment owned. Intangible resources include, e.g., brand strength, supplier relationships, process knowledge [15], technical expertise, know-how [9], information and time [15]. Internal company resources have an impact on make-or-buy decisions and thus on the process span [10].
Table A2.Output parameters.
Output Description
Degree of automation
The degree of automation, the distribution of physical and cognitive tasks between humans and technology, is described as a continuum ranging from completely manual to fully automatic [55]. A low degree of automation allows for a high degree of flexibility and low fixed machine costs. In the contrast, a high degree of automation has the advantage of economies of scale and a lower share of personnel costs [4].
Production system
This output specifies the extent to which the production system is designed as a pull or
push-production system. With the push principle, the production orders are scheduled with a planned start date on a specific work system, and “pushed” through production. The outgoing quantity is planned, and inventory is monitored. In a pull system, orders are monitored by the consumption and material is “pulled” through production. An upper stock limit is ensured by the system and the outgoing quantity is monitored [4]. The pull system is a consumption-oriented control method [8]. This production system contains a variety of methods for efficient, competitive and modern production. Avoiding waste and continuous improvement is emphasized [4].
Depth of value added
Table A2.Cont.
Output Description
Production/ assembly structure
The output parameter production and assembly line structure provides information about the production principle. It involves the spatial arrangement of the machines and workstations. A distinction is made between order-related production, flow production and group production. In shop floor production, similar machines are grouped at one location [62].
Process standardization
The standardization of products and processes allows for savings and optimization [4]. The development and introduction of complex instruments for process standardization such as guidelines, plan specifications, decision criteria and controls is efficient when large quantities of similar products are produced. In the case of complex or highly variable tasks, process standardizations are not appropriate [62]. Adaptation to local environmental factors makes standardization more difficult [4].
Process linkage
Advanced process technologies obtain their competitive costs and benefits by linking previously separate activities. The link can consist of physical links between the installations or they may mean that the planning and control of these machines can be combined. The integration of separate processes is associated with high capital costs, which can be reduced through the integration of associated processes. In addition, linked processes lead to a higher degree of synchronization, which reduces inventory and costs [15].
Operating material flexibility
The choice of resources in terms of flexibility indicates the multi-functionality, i.e., universally applicable, and to which extent the equipment can be used for special applications. Universal tools can be used for a wide range of processing activities required for a wide variety of products. Specialized tools are designed to meet specific requirements and are therefore suitable for lower product variance [15] .
Equipment operating time
The choice of equipment in terms of duration indicates whether the equipment is intended for short-term or limited use or whether it is designed for serial use.
Warehouse concept
The warehouse concept describes all measures relating to inventory-holding within the company, including the associated planning, scheduling and administrative activities [62]. The design of the warehouse system is mainly influenced by product and throughput. The warehouse size is determined by the inventory volume [44].
Quality control
During the quality control, the design quality as well as the execution quality are checked. As part of the quality control, a target/actual comparison is used to check if products meet the quality requirements [10]. Since quality and costs are trade-offs, quality control must be chosen, depending on the competition priorities. Either low cost/low quality, or high cost/high quality [9].
Design stability
The output parameter describes the design stability of the product during the production period. Before the design freeze, designers work on the aesthetics of the product. After the design freeze, the product is handed over to production, and engineers deal with feasibility issues. Since design elements are not changed from that point on, designers are no longer directly involved. They track the product to ensure that the previously “frozen” design is preserved. Freezing the design reduces expensive production system changes [10].
Additional worker training
This output parameter provides information on the extent to which additional employee training is required. Training brings with it a variety of benefits, including improved employee performance, improved satisfaction, remediation of weaknesses, increased productivity, compliance with quality standards, reduced employee turnover, better reputation, and innovation in new strategies and products [15].
Integration of local society and politics
Local society and politics influence production through local requirements concerning security, import taxes and necessary permits [4]. Governments handle foreign investment as part of their foreign policy and therefore significantly impact the build-up of production sites through subsidies or obstacles [2]. The technology must be transferred to the local standards and the specific context of Africa to be effective and sustainable [57]. In addition to the technological aspects, local environmental aspects and socio-cultural dynamics are taken into account [2].
Manufacturing technology
The output parameter manufacturing and assembly technologies specifies the extent of new technologies. New technologies require financial resources and the development of new skills. If the introduction is successful, the technology supports maintaining or building a leadership position [10].
Production network
Table A2.Cont.
Output Description
Scalability of technology
The output parameter scalability indicates the capacity and thus size of the individual technology units. Scalability is the ability to quickly, cost-effectively and flexibly switch to a different usage level. The larger the technology unit, the higher the capital costs, but the lower the capital costs per capacity unit. Similarly, the cost of installing and maintaining the technology per production unit is lower. There is a trade-off between large technology units that exploit economies of scale, but create an imbalance between capacity and demand, and smaller technology units with better consistency between capacity and demand, but less economies of scale. In addition, few, large technology units lead to major damage in the event of a failure [15].
Number of expatriates during ramp up
The deployment of expatriates at a new location is considerably more cost-intensive than the deployment of local specialists and managers. However, their know-how and company-wide connections are essential, especially in the startup phase. Studies show that in less successful new locations, companies invest the same amount in expatriates and in the training of local employees—in successful locations, companies invest twice as much in the training of local employees as in the deployment of expatriates [4]. The share of expatriates enables the transfer of proven approaches and corporate culture to the new location and facilitates local contact with the parent company. It is important to assign expatriates who have a comprehensive knowledge of company-specific products, equipment and management processes. Disadvantages are high expenses that are necessary for expatriates. The use of local specialists and managers is generally cheaper, especially in low-wage countries [4].
Motivation
The boundary conditions may require motivation through additional which can consist of additional salaries or benefits [51]. Management must strive for maintaining motivation and morale to prevent labor turnover [4].
Appendix B. Nigeria’s and Kenya’s Industry
Appendix B.1. Kenya
Kenya is the second largest economy in and the economic, financial and transport center of East Africa, as demonstrated by the presence of numerous regional offices of international companies and organizations. Real GDP growth in Kenya has averaged over 5% in the last ten years. Agriculture is the strongest sector of the Kenyan economy and contributes one third of the GDP [63]. About 75% of the Kenyan population work at least part-time in the agricultural sector. Other important sectors are infrastructure, telecommunications and construction. Unemployment and underemployment in Kenya are estimated at 40% [64]. The biggest challenge on the labor market is the particularly high unemployment of the under-35-year-olds [63]. Kenya is a member of the East African Community, a regional, intergovernmental organization between six East African states. The community aims to strengthen the political, economic, social and cultural cooperation between these states [65]. In 2005, a customs union with a common external tariff and market was decided. Following, in 2010, the free movement of workers, capital, goods and services was allowed. A further objective is creating a federal association of East African states [66].
been designed to reduce weight and costs [71]. Finally, the competitive situation in the local supplier market is evaluated. Davies and Schiller (2018) describe the local supplier market in Kenya as existing, but with low quality [67].
Appendix B.2. Nigeria
With a population of 197 million people, accounting for about 47% of West Africa’s population, and one of the largest youth populations in the world, Nigeria is a major economy in West Africa. Nigeria is a federation of 36 autonomous states composed of a multi-ethnic and culturally diverse society. It is Africa’s largest oil exporter and has the continent’s largest natural gas reserves [64]. Forecasts indicate that economic growth in Nigeria will rise from 1.9% in 2018 to 2.1% in 2019. It is expected to rise to 2.1% in 2020. The reason for low growth is stagnating oil production, as regulatory uncertainties limit investment in this sector. Economic development is being held back by high inflation, political instability and infrastructure constraints [72].
To strengthen the automotive industry, the Nigerian government launched the Automotive Industry Development Plan (NAIDP). Import duties on imported cars increased to promote local vehicle production. After the introduction of the NAIDP, Nigeria has import tariffs on vehicles of 35% and the capacity to produce a total of 108,000 passenger vehicles locally per year [43]. In 2016, 40,000 cars were produced in Nigeria and a total of 170,000 vehicles were sold. This contrast highlights the importance of the used car market. Since the sales and production figures have decreased in the years between 2014 and 2016, both the economic and political environment is unstable. Hence, the automotive market rated as volatile. The local automotive supplier base is evaluated as inadequate and needs to be promoted [67]. In Nigeria there are large educational differences between northern and southern regions. In northern regions, such as Katsina, Kebbi and Kano, more than 70% of the population did not attend school and 85% have at most a primary school certificate. In southern regions, such as Lagos, Rivers, Bayelsa, Akwa, Ibom and Delta, more than half the population has at least intermediate or higher secondary education. Among the employed population, 34% did not attend school in 2011, 21% attended primary school, 33% have a secondary school diploma and 12% an academic degree. The manufacturing industry is mainly dominated by employees with primary school education [73]. Thus, there is a shortage of trained welders, electricians, mechanics, milling cutters and lathe operators. In the Human Development Index, Nigeria ranks 152 out of 157 economies in 2018 [68].
References
1. Johne, A. Successful Market Innovation. InInnovationsmanagement; Tintelnot, C., Meißner, D., Steinmeier, I., Eds.; Springer: Berlin/Heidelberg, Germany, 1999; pp. 163–170. [CrossRef]
2. Saranga, H.; George, R.; Beine, J.; Arnold, U. Resource configurations, product development capability, and competitive advantage: An empirical analysis of their evolution.J. Bus. Res.2018,85, 32–50. [CrossRef] 3. Ehie, I.; Muogboh, O. Analysis of manufacturing strategy in developing countries: A sample survey of
Nigerian manufacturers. J. Manuf. Technol. Manag.2016,27, 234–260. [CrossRef]
4. Abele, E.; Meyer, T.; Näher, U.; Strube, G.; Sykes, R. (Eds.) Global Production: A Handbook for Strategy and Implementation; Springer: Berlin/Heidelberg, Germany, 2008; pp. 36–57, 65–80, 165–167, 192–210, 282–285, 313–314.
5. Rauch, E.; Dallasega, P.; Matt, D.T. Sustainable production in emerging markets through Distributed Manufacturing Systems (DMS).J. Clean. Prod.2016,135, 127–138. [CrossRef]
6. Hayes, R.H.; Wheelwright, S.C.Restoring our Competitive Edge: Competing Through Manufacturing, 13th ed.; Wiley: New York, NY, USA, 1984; pp. 28, 33, 40.
7. Michaeli, P.Methodik zur Entwicklung von Produktionsstrategien am Beispiel der Triebwerksindustrie; Vol. Band 328; Forschungsberichte IWB; Utz, Herbert: München, Germany, 2017; pp. 9, 15–17.
8. Mefford, R.N.; Bruun, P. Transferring world class production to developing countries: A strategic model.
9. Skinner, W. Manufacturing—Missing Link in Corporate Strategy.Harv. Bus. Rev.1969,47, 136–145. 10. Hill, A.; Hill, T. Manufacturing Operations Strategy, 3rd ed.; Palgrave Macmillan: Basingstoke, UK, 2009;
pp. 88–94, 138–144, 162–185, 242–247, 278–282, 317–329.
11. Sampath, P.G. Industrial development for Africa: Trade, technology and the role of the state. Afr. J. Sci.
Technol. Innov. Dev.2014,6, 439–453. [CrossRef]
12. Saranga, H.; Schotter, A.P.; Mudambi, R. The double helix effect: Catch-up and local-foreign co-evolution in the Indian and Chinese automotive industries. Int. Bus. Rev.2019,28. [CrossRef]
13. Nyamwanza, T. A case study review of pre-requisites for strategy implementation among SMEs in Zimbabwe.
Eur. J. Bus. Soc. Sci.2013,2, 124–133.
14. Kreikebaum, H.Strategische Unternehmensplanung, 6th ed.; W. Kohlhammer: Stuttgart, Germany, 1997; p. 87. 15. Slack, N.; Chambers, S.; Johnston, R.Operations Management; Pearson Education: Essex, UK, 2016; pp. 34,
55–57, 202–224, 244–286.
16. Jia, G.Z.; Bai, M. An approach for manufacturing strategy development based on fuzzy-QFD.Comput. Ind.
Eng.2011,60, 445–454. [CrossRef]
17. Crowe, T.J.; Cheng, C.C. Using quality function deployment in manufacturing strategic planning. Int. J.
Oper. Prod. Manag.1996,16, 35–48. [CrossRef]
18. Swamidass, P.M.; Darlow, N.R. Manufacturing Strategy. InInnovations in Competitive Manufacturing; Swamidass, P.M., Ed.; Springer: Boston, MA, USA, 2000; pp. 17–24.
19. Hajirezaie, M.; Moattar Husseini, S.M. Evaluating the Effectiveness of Strategic Decisions at Various Levels of Manufacturing Strategy: A Quantative Method. World Appl. Sci. J.2009,6, 248–257.
20. Miltenburg, J.Manufacturing Strategy: How to Formulate and Implement a Winning Plan, 2nd ed.; Productivity Press: New York, NY, USA, 2005; pp. 103–113.
21. Brown, S. Strategic Manufacturing for Competitive Advantage: Transforming Operations From Shop Floor to Strategy; Prentice Hall: New York, NY, USA, 1996.
22. Platts, K.W.; Gregory, M.J. Manufacturing Audit in the Process of Strategy Formulation. Int. J. Oper.
Prod. Manag.1990,10, 5–26. [CrossRef]
23. Montibeller, G.; Franco, L.A. Raising the bar: Strategic multi-criteria decision analysis. J. Oper. Res. Soc.2011,
62, 855–867. [CrossRef]
24. Velasquez, M.; Hester, P.T. An analysis of multi-criteria decision making methods. Int. J. Oper. Res.2013, 10, 56–66.
25. Bothe, H.H.Fuzzy Logic; Springer: Berlin/Heidelberg, Germany, 1993; pp. 4, 6, 25, 136. [CrossRef]
26. Göleç, A. A relationship framework and application in between strategy and operational plans for manufacturing industry. Comput. Ind. Eng.2015,86, 83–94. [CrossRef]
27. Mangla, S.K.; Govindan, K.; Luthra, S. Prioritizing the barriers to achieve sustainable consumption and production trends in supply chains using fuzzy Analytical Hierarchy Process. J. Clean. Prod. 2017,
151, 509–525. [CrossRef]
28. Kumar, S.; Luthra, S.; Haleem, A.; Mangla, S.K.; Garg, D. Identification and evaluation of critical factors to technology transfer using AHP approach.Int. Strateg. Manag. Rev.2015,3, 24–42. [CrossRef]
29. Hwang, C.L.; Yoon, K. Multiple Attribute Decision Making; Springer: Berlin/Heidelberg, Germany, 1981; Volume 186, p. 269. [CrossRef]
30. Kumar, K.; Garg, H. TOPSIS method based on the connection number of set pair analysis under interval-valued intuitionistic fuzzy set environment.Comput. Appl. Math.2018,37, 1319–1329. [CrossRef] 31. Garg, H.; Kumar, K. A novel exponential distance and its based TOPSIS method for interval-valued
intuitionistic fuzzy sets using connection number of SPA theory. Artif. Intell. Rev.2018. [CrossRef] 32. Garg, H.; Kaur, G. TOPSIS based on nonlinear-programming methodology for solving decision-making
problems under cubic intuitionistic fuzzy set environment.Comput. Appl. Math.2019,38, 114. [CrossRef] 33. Azadegan, A.; Porobic, L.; Ghazinoory, S.; Samouei, P.; Saman Kheirkhah, A. Fuzzy logic in manufacturing:
A review of literature and a specialized application.Int. J. Prod. Econ.2011,132, 258–270. [CrossRef] 34. Adamy, J.; Kempf, R. Regularity and chaos in recurrent fuzzy systems.Fuzzy Sets Syst.2003,140, 259–284.
[CrossRef]
36. Stahl, B.; Diepold, K.J.; Pohl, J.; Greitemann, J.; Plehn, C.; Koch, J.; Lohmann, B.; Reinhart, G. Modeling Cyclic Interactions within a Production Environment using Transition Adaptive Recurrent Fuzzy Systems.
IFAC Proc. Vol.2013,46, 1979–1984. [CrossRef]
37. Lin, J.; Qian, Y.; Yassine, A.; Cui, W. A fuzzy approach for sequencing interrelated activities in a DSM.Int. J.
Prod. Res.2012. [CrossRef]
38. Schwung, A.; Adamy, J. Modeling with discrete-time recurrent fuzzy systems via mixed-integer optimization.
Fuzzy Sets Syst.2012,203, 1–16. [CrossRef]
39. Lee, K.H. (Ed.) First Course on Fuzzy Theory and Applications. InAdvances in Soft Computing; Springer: Berlin/Heidelberg, Germany, 2005; Volume 27, pp. 266–267. [CrossRef]
40. Unbehauen, H. Regelungstechnik I: Klassische Verfahren zur Analyse und Synthese Linearer Kontinuierlicher Regelsysteme, Fuzzy-Regelsysteme, 11th ed.; Studium Technik, Vieweg+Teubner Verlag: Wiesbaden, Germany, 2001; p. 340. [CrossRef]
41. Zimmermann, H.J.Fuzzy Set Theory—And Its Applications; Springer: Dordrecht, The Netherlands, 2001; pp. 228, 360. [CrossRef]
42. Ward, P.T.; Duray, R.; Keong Leong, G.; Sum, C.C. Business environment, operations strategy, and performance: An empirical study of Singapore manufacturers. J. Oper. Manag.1995,13, 99–115. [CrossRef] 43. Black, A.; Makundi, B.; McLennan, T. Africa’s Automotive Industry: Potential and Challenges. Work. Pap.
Ser.2017,282, 11–14.
44. Morton, R.J. An approach to warehouse design. Retail Distrib. Manag.1974,2, 42–45. [CrossRef]
45. United Nations. Sustainable Development Goals Report 2018; United Nations Publication: New York, NY, USA, 2018.
46. Stewart, F. Technology and employment in LDCs. World Dev.1974,2, 17–46. [CrossRef]
47. Chui, M.; George, K.; Manyika, J.; Miremadi, M.Human + Machine: A New Era of Automation in Manufacturing; McKinsey & Company: San Francisco, CA, USA, 2017.
48. Langerak, F.; Hultink, E.J. The Impact of New Product Development Acceleration Approaches on Speed and Profitability: Lessons for Pioneers and Fast Followers. IEEE Trans. Eng. Manag.2005,52, 30–42. [CrossRef] 49. Baptist, S.; Teal, F. Technology and Productivity in African Manufacturing Firms. World Dev. 2014,
64, 713–725. [CrossRef]
50. Husan, R. The continuing importance of economies of scale in the automotive industry. Eur. Bus. Rev.1997,
97, 38–42. [CrossRef]
51. Kampker, A.Elektromobilproduktion; Springer: Berlin/Heidelberg, Germany, 2014; p. 238. [CrossRef] 52. Seselj, I.7 Steps to Manufacturers Reaping the Benefits of Standard And Glocalised Processes; Global Manufacturing:
San Diego, CA, USA, 2017.
53. Puchkova, A.; Le Romancer, J.; McFarlane, D. Balancing Push and Pull Strategies within the Production System. IFAC-PapersOnLine2016,49, 66–71. [CrossRef]
54. Ward, P.T.; McCreery, J.K.; Ritzman, L.P.; Sharma, D. Competitive Priorities in Operations Management.
Decis. Sci.1998,29, 1035–1046. [CrossRef]
55. Frohm, J.; Lindström, V.; Winroth, M.; Stahre, J. Levels of automation in manufacturing. Int. J. Ergon.
Hum. Factors2008,30, 1–28.
56. Berns, M.; Townend, A.; Khayat, Z.; Balagopal, B.; Reeves, M.; Hopkins, Michael S.; Kruschwitz, N. Sustainability and Competitive Advantage. MIT Sloan Manag. Rev.2009,51, 1–10.
57. Mattson, C.A.; Wood, A.E. Nine Principles for Design for the Developing World as Derived From the Engineering Literature. J. Mech. Des.2014,136. [CrossRef]
58. Chatterji, M. Technology Transfer in the Developing Countries, 2nd ed.; Palgrave Macmillan Limited: London, UK, 2016; p. xiii.
59. ElMaraghy, W.; ElMaraghy, H.; Tomiyama, T.; Monostori, L. Complexity in engineering design and manufacturing. CIRP Ann.2012,61, 793–814. [CrossRef]
60. Kinkel, S. New patterns of German production relocation and backshoring activities after the global economic crisis? In Proceedings of the 20th International Annual EurOMA Conference, Dublin, Ireland, 9–12 June 2013; pp. 1–10.
61. Walker, G.; Weber, D. Supplier competition, uncertainty, and make-or-buy decisions. Acad. Manag. J.1987,
62. Weber, W.; Kabst, R. (Eds.)Einführung in die Betriebswirtschaftslehre, 6th ed.; Betriebswirtschaftlicher Verlag: Wiesbaden, Germany, 2006; pp. 91–95, 213, 314. [CrossRef]
63. Auswärtiges Amt. Kenia: Übersicht. Available online:https://www.auswaertiges-amt.de/de/aussenpolit ik/laender/kenia-node/kenia/208042(accessed on 22 September 2019).
64. Central Intelligence Agency. The World Factbook: Kenya. Available online:https://www.cia.gov/library/ publications/the-world-factbook/geos/ke.html(accessed on 22 September 2019).
65. East African Community. Overview of EAC. Available online: https://www.eac.int/overview-of-eac
(accessed on 12 October 2019).
66. Akrach, S.; Boell, M.; Diedrich, H.M.; Ehlers, C.; Freyer, H.; Kalhoefer, M.; Mack, A.; Mosebach, A.; Najjar, F.; Netz, D.; et al. Wirtschaftsstandort Subsahara-Afrika: Zukunftsmärkte mit Herausforderungen; German Trade and Invest mbH: Bonn, Germany, 2019; p. 11.
67. Davies, M.; Schiller, T. Deloitte Africa Automotive Insights; Deloitte: Johannesburg, South Africa, 2018; pp. 7, 40–41.
68. United Nations. Human Development Reports: Education Index. Available online:http://hdr.undp.org/e n/indicators/103706(accessed on 22 September 2019).
69. World Bank Blogs. New Country Classifications by Income Level: 2019–2020. Available online:https://blogs.wo rldbank.org/opendata/new-country-classifications-income-level-2019-2020(accessed on 22 September 2019). 70. Gelb, A.; Meyer, C.J.; Ramachandran, V.; Wadhwa, D. Can Africa Be a Manufacturing Destination? Labor Costs in Comparative Perspective. Available online:https://www.cgdev.org/sites/default/files/can-afric a-be-manufacturing-destination-labor.pdf(accessed on 17 October 2019).
71. Mobius. About Us. Available online: https://mobiusmotors.com/pages/about-mobius (accessed on 22 September 2019).
72. Calderon, C.; Kambou, G.; Korman, V.; Kubota, M.; Cantu Canales, C. An Analysis of Issues Shaping Africa’s Economic Future. Afr. Pulse2019,19, 19.
73. Favara, M.; Appasamy, I.; Garcia, M.H. Nigeria: Skills for Competitiveness and Employability. InWorld Bank Reports; World Bank Group: Washington, DC, USA, 2015; pp. 2–13.
c
![Table 2. Classification of Multi-Criteria-Decision-Methods (based on [24]).](https://thumb-us.123doks.com/thumbv2/123dok_us/9714366.1498879/4.595.79.514.418.554/table-classication-of-multi-criteria-decision-methods-based.webp)