www.ocean-sci.net/3/117/2007/
© Author(s) 2007. This work is licensed under a Creative Commons License.
Ocean Science
M3A system (2000–2005) – operation and maintenance
G. Petihakis1, P. Drakopoulos2, C. Nittis1, V. Zervakis3, C. Christodoulou1, and C. Tziavos1
1Institute of Oceanography, Hellenic Center for Marine Research, P.O. BOX 2214, Iraklion-Crete, GR 71003, Greece 2Optical Instruments Laboratory, Department of Optics, Technological Institute of Athens, Greece
3Department of Marine Science, University of the Aegean, Mytilene, Greece
Received: 5 April 2006 – Published in Ocean Sci. Discuss.: 16 May 2006
Revised: 7 September 2006 – Accepted: 11 December 2006 – Published: 23 February 2007
Abstract. During the pilot phase of the Mediterranean Fore-casting System (MFSPP) (2000 2003), a prototype observing system (Mediterranean Moored Multi-sensor Array – M3A) was designed, developed and operated in the Cretan Sea for continuous oceanographic measurements in real time. The main problems encountered were associated with biofouling, underwater and aerial communication and with the design of the surface buoy. In the second phase of the MFS project named Mediterranean Forecasting System Towards Environ-mental Predictions (MFSTEP) (2003–2005), the aim was to solve those problems and to consolidate the M3A. For the minimisation of biofouling a pilot field study was performed and the techniques of bromine solution and copper shielding were evaluated. Additionally, the oligotrophy of the Aegean Sea dictated the need to ignore factory calibrations and to perform site-specific laboratory calibrations of the sensors. This procedure was proved necessary and produced calibra-tion coefficients that gave results comparable to the measure-ments obtained with the laboratory analysis method. Dur-ing the approximately five years of operation, there were 13 scheduled and 15 emergency visits, with a total duration of 65 days. The acquired experience through the maintenance program proved that the continuous observation of such a very important system with a relative low cost is feasible.
1 Introduction
Oceans are very dynamic systems with active processes that include physics, chemistry and biology. The state of knowl-edge concerning our planet’s oceans is built primarily upon the foundation of spatial exploration (Colwell, 2003). How-ever, if these processes are to be understood, if new insights are to be gained, if quantitative models are to be validated sat-Correspondence to: G. Petihakis
M3A
CRETE
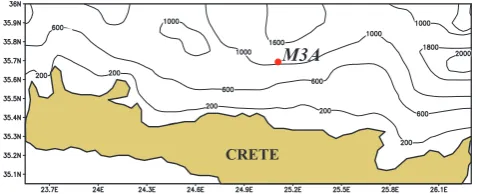
Fig. 1. Location of M3A station.
open sea conditions, characterised as extremely oligotrophic where dense waters with intermediate and deep characteris-tics are formed (Balopoulos et al., 1999; Theocharis et al., 1999).
In the second phase of the MFS project named Mediter-ranean Forecasting System Towards Environmental Predic-tions (MFSTEP) (2001–2005), the aim was to consolidate the M3A and in particular i) to improve the functionality of the system and upgrade its capabilities (new underwa-ter and satellite communications, new bio-optical measure-ments, new surface buoy) and ii) to expand the network with two more buoys, one in the Eastern and one in the West-ern Mediterranean Sea. The three stations together were de-signed to be the data producers for the validation of the basin scale current forecasts, serving as a subsurface extrapolation data set for surface satellite colour data and for assimilation into the ecosystem models.
2 M3A design and configuration
The station was deployed in the Cretan Sea (Fig. 1) in Jan-uary 2000, with coordinates 35◦39,6270N and 24◦59,0800E
at a depth of 1030 m with the 62 m R/V Aegaeo (http://www. hcmr.gr/english site/services/shi sub rovs/aegaio.html). The system configuration involved a triple configuration (Fig. 2) and is described in detail by Nittis et al. (2003). To confront the M3A system problems that became emergent during the first phase, a number of modifications – upgrades were per-formed prior to redeployment at the second phase.
The buoy used in the pilot phase was an available one (Thanos and Pezirtzoglou, 1997), primarily designed as a wave directional data buoy of wave rider type. Since deep water oceanographic buoys, such as M3A, must operate as robust and reduced movement devices, the hull’s movements were minimized by an appropriate floatation shape design. The new buoy was constructed to withstand wave heights up to 12 m with a significant flexibility in the design and with a modular construction (easily exchangeable parts, i.e. elec-tronics, floaters, mast, underwater units and selectable di-mensions). A new compass on board the buoy was installed, in order to reduce the power consumption, and the wind gen-erator was replaced with a significantly lighter one with a
Conductivity,Temparture,Depth
Conductivity,Temparture
-500m
CTD,Turbidity, DO, Chl, PAR Nireus container with pc, Hydroacoustic modem
-150m
-250m
-350m
-65m
-90m -45m
-115m -40m
Conductivity,Temparture
Conductivity,Temparture,Depth Line 1
-35m
Nutrient Analyser CTD,Turbidity, DO, Chl, PAR
CTD,Turbidity, DO, Chl, PAR CTD,Turbidity, DO, Chl, PAR
Line 2
Line 3 ADCP
Fig. 2. M3A station setup.
better energy conversion coefficient. Several cable harnesses inside the instrumentation container were redesigned, in or-der to fulfill the worldwide standards while the meteorologi-cal package was enriched with new sensors (solar radiation, rainfall). Additionally, new underwater and satellite commu-nication systems were implemented, i.e. satellite transceiver, mobile phones, under-water acoustic bi-directional modems, enabling two-way signal transferring IMC modems while the underwater hardwired network was embedded into the buoy container and attached on the mooring line. To overcome the problem of communication between the two lines dur-ing summer (thermocline development), higher rates (up to 4800 Bits/s) were developed. Finally, the underside of the hull instrumentation was replaced with a simpler package.
As line 2 during the first phase proved to be quite effi-cient, it was decided that it should remain practically as orig-inally developed (Nittis et al., 2003), with the exception of the necessary improvements in order to minimise biofouling. From the very first deployment it became evident that flu-orometers and the transmissometers factory calibration was not appropriate, as biological production in the Cretan Sea is significantly lower compared to most other areas where marine observatories are operating. Thus, laboratory experi-ments were designed and bibliographic information was used in order to perform site-specific calibrations for those optical sensors and to estimate the range of values to be used prior to deployment.
the Pilot Project, biofouling posed a problem for the bio-optical measurements (Drakopoulos et al., 2003), despite the oligotrophy of the Cretan Sea (Tselepides and Polychronaki, 2000). Thus, it was decided that some sort of antifouling technique would have to be applied, in order to improve the quality of the bio-optical measurements during the MFSTEP project. In order to select the most appropriate technique, a pilot study described below was conducted.
3 Pre-target operational period (pre-top)
3.1 Testing anti-fouling techniques
Most of anti-biofouling techniques depend on maintaining a toxic environment to the marine organisms close to the sen-sors’ location. This usually is achieved either with the pres-ence of copper near the sensor (by means of a copper shutter or tubing) or with a bromine solution. Despite the fact that incorporation of copper-shutters is a very promising technol-ogy, it could not be used in this case, as the already existing instrumentation did not have a provision for the mounting of such a device. Thus, the methods of bromine solution and copper tubing were tested and compared.
For the open instruments (PAR sensors) two configura-tions were deployed, one with a copper disk attached bellow the sensor’s diffusing bulb and a standard one without any particular action to prevent biofouling. For the rest of the sensors four different configurations were deployed, one with no protection, one with copper tubing, one with bromine and a final one with a combination of both. The copper configu-ration simply included the replacement of most of the plastic tubing adjacent to the fluorometer and transmissometer (both upstream and downstream) with copper tubing (∅10 mm) of similar length. The bromine system incorporated a vented canister with bromine tablets, attached between the fluorom-eter and the transmissomfluorom-eter, in order to slowly and con-stantly release bromine solution through diffusion towards both sensors. Erroneous readings were avoided in all sensors by means of flushing for 15 s prior to measurement.
In order to evaluate the above different approaches, an ex-periment was carried out close to a fish-farm situated off the islet of Patroklos in Saronikos Gulf, Greece. This site was chosen for its relatively eutrophic environment due to inten-sive fishfarming activities, thus minimizing the duration of the experiment. The experimental site was approximately 50 m eastwards from the fish cages directly influenced by the farm, as indicated by the increased deposition of organic ma-terial on the benthic system. A total of two antifouling-test deployments were made.
The four different CTD setups were deployed at the same depth (10 m) in neighboring moorings at a total water depth of 18 m and set to sample hourly. The choice of deploying four moorings instead of one was taken in order to maintain the CTD platforms at the same depth (identical conditions
01/06 01/07
100 150 200 250 300 350 400 450
Figure 3. Lowpass filtered PAR (blue) and incoming solar radiation (green). Note the progressive increase of the distance of the two lines, suggesting the buildup of biofouling on the surface of the PAR sensor bulb.
Fig. 3. Lowpass filtered PAR (blue) and incoming solar radiation
(green). Note the progressive increase in the distance of the two lines, suggesting the buildup of biofouling on the surface of the PAR sensor bulb.
of light/nutrients and chlorophyll) and thus obtain compara-ble measurements. To aid the interpretation of the results, a current meter was included in one of the moorings and a weather station was set at the aquaculture facility. The first deployment started on 20 May 2003, and lasted until 8 July 2003, when it was retrieved due to the strong algal buildup as observed by in situ scuba.
Analysis of the collected data showed that the open sen-sors (PARs) behaved in a similar manner regardless of the anticipated toxic environment at the moorings with bromine and copper. An intercomparison of PAR and incoming solar radiation time series after the removal of the daily cycle by means of filtering, showed a decrease of sensitivity of the or-der of 40% in 50 days, with an accelerating trend towards the end of the deployment period (Fig. 3).
The fluorometers recorded no obvious increase in chloro-phyll concentration, despite the external buildup of organ-isms, with the exception of the one with no protection, which showed an increasing trend towards the end of the deploy-ment. It should be noted here that the chlorophyll concentra-tion as measured from bottle samples in the lab, ranged from 0.06 to 0.09µg/lt.
The interpretation of the transmissometer’s readings was more straightforward. An exponential increase was evident in all configurations that had no bromine canister, indicative of optical window contamination. An interesting result was that the one with the least biofouling was the setup, which in-corporated both copper tubing and bromine solution (Fig. 4). This was in contrast to the results reported elsewhere (Manov et al., 2003; Seim et al., 2000).
01/06/03 01/07/03 0
0.5 1 1.5 2 2.5 3 3.5
TIME
c(660) m
−
1
Bromine+Copper Copper
Fig. 4. Beam attenuation coefficient time series for two
transmis-someters, one with the copper tubing (dashed line) and one with the combined bromine solution and copper tubing (solid line).
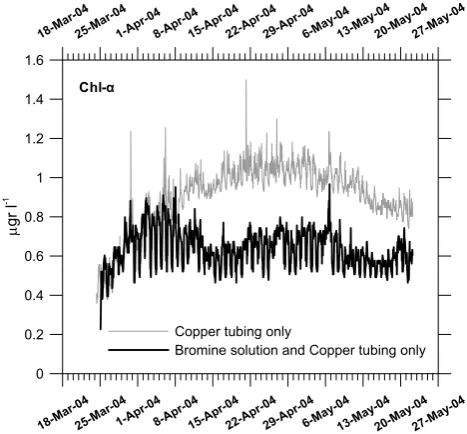
Considering the low content of chl-αexperienced during the first deployment, a second trial took place in the same area in spring 2004, aiming to record the spring bloom. The two CTD platforms were deployed in separate moorings at an approximate depth of 7 m, at a water column depth of about 20 m. The deployment took place on 24 March and the re-covery on 22 May 2004. The platform S1 was equipped only with copper tubing, while the platform S2 employed both copper tubing and bromide solution.
On producing the engineering units of chl-αfluorescence, the calibration coefficients produced during the 19 May 2003 laboratory calibration experiment, were used. As the calibra-tion coefficients for the 2930 sensor (S4) gave unaccepted values, it was decided to use those for the 2928 (S2) sensor (see Sect. 3.2).
The fluorometers produced almost identical time series for about 10 days, which is the time when the S4 fluorometer measurements started diverging in relation to S1 measure-ments (Fig. 5). This in effect suggests that the calibration procedure was rather successful. After 3 April the chl-α flu-orescence recorded by S4 was systematically lower than S1, showing no trend at all, while the S1 reached a maximum value of 1.2µg/l before a slow, gradual decrease to lower val-ues. Overall, there was no clear sign of a strong spring bloom which we were hoping to record. The negative trend of the S1 fluorometer measurements during the second half of the deployment period suggests that the measurements were not infested by biofouling.
3.2 Laboratory sensor calibration
During the first phase, soon after each maintenance using the recorded values by the M3A instruments and the
refer-18-M ar-04 25-M
ar-04 1-A
pr-04 8-A
pr-04 15-Ap
r-04 22-Ap
r-04 29-Ap
r-04 6-May
-04 13-May
-04 20-May
-04 27-May
-04
0 0.2 0.4 0.6 0.8 1 1.2 1.4 1.6
µ
gr l
-1
18-Ma r-04
25-Ma r-04
1-A pr-04
8-A pr-04
15-Ap r-04
22-Ap r-04
29-Ap r-04
6-M ay-04
13-Ma y-04
20-Ma y-04
27-Ma y-04
Copper tubing only
Bromine solution and Copper tubing only
Chl-α
Fig. 5. Comparison of Chl-αfluorometers during the second de-ployment experiment.
ence in-situ measured values, correction coefficients were estimated for the transfer functions that convert the sen-sors’ output to engineering units (Nittis et al., 2003). In all cases, correction coefficients were applied to the oxygen and chlorophyll-α measurements, where the deviation between in-situ and reference measurements was significantly exceed-ing the sensor’s accuracy (0.5–1.2 ml/l for dissolved oxygen, 1.2–3.2µg/l for chlorophyll-α). In fact, the initial values of chlorophyll-αestimated by the M3A fluorometers were one order of magnitude higher than the reference values (0.6– 3.2µg/l instead of 0.05–0.5µg/l). This was most probably related to the fact that the sensors had been calibrated by the manufacturer to inappropriate phytoplankton concentra-tions. As already mentioned, the area of the M3A deploy-ment is characterized by extreme oligotrophism, with at least one order of magnitude lower range of values compared to the instrument’s range (0–75µg/l). Thus, in an attempt to perform site-specific calibrations for this very oligotrophic environment of the Cretan Sea, laboratory experiments were designed and bibliographic information was used, in order to estimate the range of values to be used.
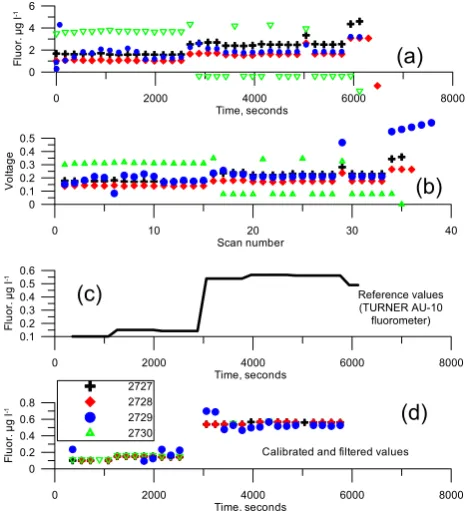
The fluorometer calibration that was performed the day be-fore the Patroklos deployment is presented in Fig. 6. The chlorophyll-αfluorescence of the cultivated samples, based on the reference measurements, ranged between 0.1 and 0.6µg/l (Fig. 6c). The output voltages of most of the sen-sors under calibration exhibited co-varied; however, one of the sensors exhibited several “bad” values that were later at-tributed to the presence of an air-bubble in the closed cir-cuit providing water to the sensors (Fig. 6b). Comparing the range of the chl-αvalues obtained using the factory cali-brations (Fig. 6a) with the range obtained after applying the calibration coefficients obtained with the presently described method (Fig. 6d), it becomes evident that the calibration was a necessary exercise, as the use of the factory calibrations would result in a severe overestimation of the phytoplank-ton concentrations during the experiment. Thus, considering the above result, it was decided that the newly-obtained cal-ibration coefficients would be adopted. Furthermore, it is interesting to note the unstable behavior of the fluorometer with s/n 2729, and the zero values that periodically sensor s/n 2730 produced. The latter were attributed to air bubbles trapped in the tubing in the vicinity of the fluorometer sensor, while the unstable behavior of the 2729 sensor (which be-haved well throughout the field experiment), was most likely due to a rather inefficient experimental design. In order to facilitate and accelerate the whole process, the fluorometer measurements were performed on the same control solutions. Thus, a single water circuit was designed, connecting the tub-ing of all four CTD platforms, and forctub-ing the same solution to be sampled by all sensors. As 2729 sensor was the last in the row, it is assumed that the phytoplankton had lost its fluorescence responsiveness as a result of the three previous successive light stimulations.
Transmissometers were post deployment calibrated by the standard method of blocking the receiver and obtaining a dark reading of output voltage and by taking several voltage readings in de-ionized water to obtain a clean water offset.
4 Target operational period (top)
4.1 Periodic maintenance
As already mentioned, a significant aspect right from the start of the project was the minimisation of cost, achieved mainly through the minimization of maintenance effort. The three line configuration approach adopted could ensure the low operation cost, as only a relatively small part of the equip-ment had to be frequently removed. More specifically, for line 1 hosting the buoy a bimonthly servicing schedule was decided only for the buoy sensors with an on-site procedure, while for the CTs the servicing interval due to the absence of fouling was limited to battery replacement every 12 months. Since the sensors on line 2 were in the euphotic zone, foul-ing was expected to significantly affect the accuracy of the
0 2000 4000 6000 8000
Time, seconds 0
2 4 6
F
luor
. µ
g
l
-1
0 10 20 30 40
Scan number 0
0.1 0.2 0.3 0.4 0.5
V
o
ltage
2727 2728 2729 2730
0 2000 4000 6000 8000
Time, seconds 0.1
0.2 0.3 0.4 0.5 0.6
F
luor
. µ
g
l
-1
Reference values (TURNER AU-10 fluorometer)
0 2000 4000 6000 8000
Time, seconds 0
0.2 0.4 0.6 0.8
F
luor
. µ
g
l
-1
Calibrated and filtered values
(a)
(b)
(c)
(d)
Fig. 6. Fluorometer calibration results are presented, as time series
of (a) chl-αconcentration of the alternating control solutions based on factory calibration values, (b) corresponding voltage of the flu-orometers, (c) reference values obtained via the laboratory method and (d) calibrated and filtered values.
measurements prohibiting long deployment intervals. Addi-tionally, the wet chemistry procedure of nitrate analysis and the 3-h sampling frequency of all sensors determined a bi-monthly maintenance interval. Although the design was such that during servicing the full line had to be recovered and redeployed, the whole operation could be carried out with a small R/V, such as the 26 m Philia (http://www.hcmr.gr/ english site/services/shi sub rovs/philia.html). For line 3 the 30-min sampling program chosen, forcing an approximate service interval of 6 months mainly for battery replacement, data downloading and cleaning. Additionally for emergency visits the 5.25-m rigid hull inflatable IOLKOS was used.
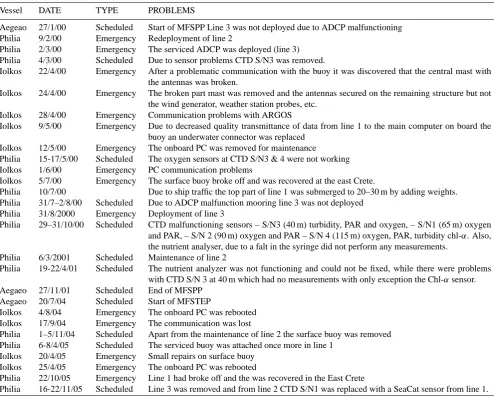
Table 1. Visits to M3A.
Vessel DATE TYPE PROBLEMS
Aegeao 27/1/00 Scheduled Start of MFSPP Line 3 was not deployed due to ADCP malfunctioning
Philia 9/2/00 Emergency Redeployment of line 2
Philia 2/3/00 Emergency The serviced ADCP was deployed (line 3)
Philia 4/3/00 Scheduled Due to sensor problems CTD S/N3 was removed.
Iolkos 22/4/00 Emergency After a problematic communication with the buoy it was discovered that the central mast with the antennas was broken.
Iolkos 24/4/00 Emergency The broken part mast was removed and the antennas secured on the remaining structure but not the wind generator, weather station probes, etc.
Iolkos 28/4/00 Emergency Communication problems with ARGOS
Iolkos 9/5/00 Emergency Due to decreased quality transmittance of data from line 1 to the main computer on board the buoy an underwater connector was replaced
Iolkos 12/5/00 Emergency The onboard PC was removed for maintenance
Philia 15-17/5/00 Scheduled The oxygen sensors at CTD S/N3 & 4 were not working
Iolkos 1/6/00 Emergency PC communication problems
Iolkos 5/7/00 Emergency The surface buoy broke off and was recovered at the east Crete.
Philia 10/7/00 Due to ship traffic the top part of line 1 was submerged to 20–30 m by adding weights.
Philia 31/7–2/8/00 Scheduled Due to ADCP malfunction mooring line 3 was not deployed
Philia 31/8/2000 Emergency Deployment of line 3
Philia 29–31/10/00 Scheduled CTD malfunctioning sensors – S/N3 (40 m) turbidity, PAR and oxygen, – S/N1 (65 m) oxygen and PAR, – S/N 2 (90 m) oxygen and PAR – S/N 4 (115 m) oxygen, PAR, turbidity chl-α. Also, the nutrient analyser, due to a falt in the syringe did not perform any measurements.
Philia 6/3/2001 Scheduled Maintenance of line 2
Philia 19-22/4/01 Scheduled The nutrient analyzer was not functioning and could not be fixed, while there were problems with CTD S/N 3 at 40 m which had no measurements with only exception the Chl-αsensor.
Aegaeo 27/11/01 Scheduled End of MFSPP
Aegaeo 20/7/04 Scheduled Start of MFSTEP
Iolkos 4/8/04 Emergency The onboard PC was rebooted
Iolkos 17/9/04 Emergency The communication was lost
Philia 1–5/11/04 Scheduled Apart from the maintenance of line 2 the surface buoy was removed
Philia 6-8/4/05 Scheduled The serviced buoy was attached once more in line 1
Iolkos 20/4/05 Emergency Small repairs on surface buoy
Iolkos 25/4/05 Emergency The onboard PC was rebooted
Philia 22/10/05 Emergency Line 1 had broke off and the was recovered in the East Crete
Philia 16-22/11/05 Scheduled Line 3 was removed and from line 2 CTD S/N1 was replaced with a SeaCat sensor from line 1.
was performed. Additionally, all sensors on board the buoy were cleaned by divers who also examined the anchoring and cable systems. Once at Heraklion harbour, the 4 CTDs and the nutrient analyzer were transported into HCMR facilities for further maintenance and downloading of data.
During the second day at the HCMR facilities, the fixed oxygen samples were analyzed with the Winkler (Carpenter, 1965) method while the nutrient analyzer was cleaned and data were downloaded. The syringe and the inlet – outlets were dismantled and washed with mild acid to remove any organic deposits while the colorimeter was flushed with a mild soap. The analyzer bags were filled with fresh chem-icals and a new cadmium column was prepared. The effi-ciency of the colorimeter was tested in the lab against known concentration solutions and once satisfactory, the sampling protocol was programmed. Data from the CTDs and Nireus was downloaded and all sensors were dismantled, carefully
cleaned and serviced according to the manufacturer’s instruc-tions. On several occasions, malfunctioning sensors as re-vealed by the acquired data had to be removed for servicing, either on the spot or sent to the corresponding factory. Fi-nally, all sensor batteries were evaluated and when appropri-ate replaced with new ones. Once serviced, instruments were transported into R/V Philia where the line was re-assembled and set to standby (instruments were not powered).
Early in the third day before departure and after a final check, all instruments were activated, in order to have the same reference measurements prior to the deployment.
Phase I
14.0 15.0 16.0 17.0 18.0 19.0 20.0 21.0 22.0 23.0 24.0
6/12/99 5/3/00 3/6/00 1/9/00 30/11/00 28/2/01 29/5/01 27/8/01 25/11/01
T
e
mp
erat
u
re
oC
40m 65m 90m 115m
Phase II
14.0 15.0 16.0 17.0 18.0 19.0 20.0 21.0 22.0 23.0 24.0
6/12/03 5/3/04 3/6/04 1/9/04 30/11/04 28/2/05 29/5/05 27/8/05 25/11/05
T
e
m
p
er
atu
re
oC
40m 65m 90m 115m
Phase I
13.5 14.5 15.5 16.5 17.5
6/12/99 5/3/00 3/6/00 1/9/00 30/11/00 28/2/01 29/5/01 27/8/01 25/11/01
T
e
mp
erat
u
re
oC
150m 250m 350m 500m
Phase II
13.5 14.5 15.5 16.5 17.5
6/12/03 5/3/04 3/6/04 1/9/04 30/11/04 28/2/05 29/5/05 27/8/05 25/11/05
T
e
m
p
er
atu
re
oC
150m 250m 350m
500m
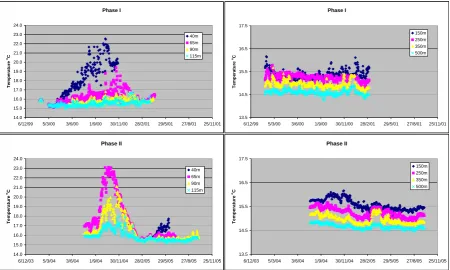
Fig. 7. Temperature measurements at various depths during Phase I and Phase II of MFS project.
were compared against reference CTD measurements carried out by the SBE-25 of R/V Philia and the SBE-911 of R/V Ae-gaeo, respectively. Salinity measurements of the reference CTD casts were corrected against a salinometer analysis of the water samples.
Emergency trips were mainly done with the HCMR inflat-able IOLKOS for a number of causes, most of which were related to communication problems.
4.2 Problems encountered
The main problem during the first phase of the project was caused by a false connection of the umbilical cable with the surface buoy which eventually broke off (Nittis et al., 2003). Apart from the problematic Argos antenna, all light sen-sors suffered from biofouling while PAR sensen-sors also exhib-ited problems associated with their amplifiers.
Soon after the start of the second phase of the project, there were problems associated with the bi-directional data transfer and remote reprogramming of the buoy, causing in-efficient data transfer. Although these problems were suc-cessfully solved on site during an emergency visit, soon af-ter the communication was completely lost. Thus in the course of a scheduled maintenance the buoy was removed and transferred to HCMR for servicing. Apart from a cou-ple of flooded solar panel junction boxes, which were easily repaired, the main problem of the buoy was a destroyed PC motherboard. Since a replacement part was not available, the
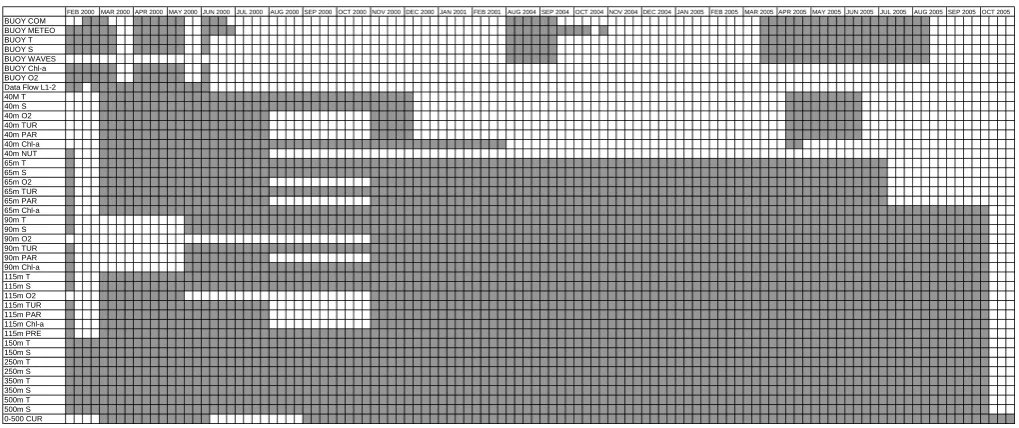
Table 2. System performance (white colour indicates absence or bad data).
20 Table 2. S
FEB 2000M CT 2005
BUOY COM BUOY METEO BUOY T BUOY S BUOY WAVES BUOY Chl-a BUOY O2 Data Flow L1-2 40M T 40m S 40m O2 40m TUR 40m PAR 40m Chl-a 40m NUT 65m T 65m S 65m O2 65m TUR 65m PAR 65m Chl-a 90m T 90m S 90m O2 90m TUR 90m PAR 90m Chl-a 115m T 115m S 115m O2 115m TUR 115m PAR 115m Chl-a 115m PRE 150m T 150m S 250m T 250m S 350m T 350m S 500m T 500m S 0-500 CUR
AR 2000 APR 2000MAY 2000 JUN 2000JUL 2000AUG 2000 SEP 2000OCT 2000 NOV 2000 DEC 2000 JAN 2001FEB 2001AUG 2004 SEP 2004OCT 2004 NOV 2004 DEC 2004 JAN 2005FEB 2005MAR 2005 APR 2005MAY 2005 JUN 2005JUL 2005 AUG 2005 SEP 2005O
5 Buoy performance
In Table 2, the overall performance of the M3A system dur-ing the two phases is presented. It is evident that the most reliable instruments were the four CTs, producing non-stop measurements of temperature and salinity in contrast with the nitrate analyser, which had a working period of approx-imately 4 months. Although the latter was one of the first instruments produced and unavoidably had a number of de-fects, the data produced were exceptionally, good even for the oligotrophic Cretan Sea. Additionally, most of the prob-lems related to the optical sensors during the first phase were successfully solved, while the serious disadvantage of the CTDs relying solely on power for data storage, resulted in the loss of significant data. The surface buoy was proved to be the weakest part of the system, since it had the longer periods of inactivity due to a malfunction of different sub-components. Since this buoy has already extended its ex-pected lifetime, its upgrade or replacement is among the highest priorities for the next few years. Finally, the line-3 ADCP had an overall very good performance and provided a long time series of current profiles in the 0–500 m layer.
The temperature time series at various depths are shown in Fig. 7. Comparing the top part of the water column dur-ing the two phases, one can observe a clear warmdur-ing of the upper 100 m between the periods. Such variability can be justified by the fast response of the seasonal thermocline to interannual variability of atmospheric forcing. The respec-tive differences in the lower part (100–500 m) of the water column are smaller but an increased temporal variability and a stronger stratification is presented in phase 2 compared to phase 1. This can be attributed either to interannual
variabil-ity of vertical mixing and diffusive processes (i.e. reduced intermediate water formation during the previous winter(s)) or to shorter time scale variability of the mesoscale features (horizontal displacement or intensification of the cyclonic-anticyclonic dipole) that control the dynamics of the M3A site in the Cretan Sea (Cardin et al., 2003).
The calibrated chlorophyll-αmeasurements from the four fluorometers in line 2 during the two phases are shown in Fig. 8. A noticeable feature is the reduced variability in all chl-αmeasurements during the second phase, although the data at 40 m, which is the depth expected to show such phe-nomena, is rather inadequate.
Table 3. Cost analysis.Table 3. Cost analysis
COSTS Euros
Capital Costs
Surface buoy 120,000
Equipment 252,000 Initial Deployment Costs
R/V Aegaeo 12,000
Personnel 1,000
INITIAL COSTS
TOTAL 385,000
Calibration Costs (1 year)
Consumables 1,800 Personnel 11,400 Maintenance Costs (1 year)
R/V Philia /d 24,000
Consumables/maintenance 6,000 Personnel/maintenance 7,800 Communication Costs (1 year)
GSM 960 Iridium 4800
Argos 1440
ANNUAL COSTS
TOTAL 58,200
Emmergency Costs
R/V Iolkos 120
Personnel 100
UNFORESEEN COSTS
TOTAL 220
Figure 1.Location of M3A station
Figure 2. M3A station setup
Figure 3. Lowpass filtered PAR (blue) and incoming solar radiation (green). Note the progressive increase of the distance of the two lines, suggesting the buildup of biofouling on the surface of the PAR sensor bulb.
Figure 4. Beam attenuation coefficient time series for two transmissometers, one with the copper tubing (dashed line) and one with the combined bromine solution and copper tubing (solid line).
Figure 5. Comparison of Chl-α fluorometers during the second deployment experiment
Figure 6. Fluorometer calibration results are presented, as time series of (a) chl-α
concentration of the alternating control solutions based on factory calibration values, (b) corresponding voltage of the fluorometers, (c) reference values obtained via the laboratory method and (d) calibrated and filtered values.
Figure 7.Temperature measurements at various depths during Phase I and Phase II of MFS project
Figure 8.Chlorophyll-a measurements at various depths during Phase I and Phase II of MFS project
21 6 Conclusions
During the pilot phase of the Mediterranean Forecasting Sys-tem, a prototype observing system was designed, developed and operated in the Cretan Sea, aiming towards the continu-ous recording of multi-parametric data. Such time series are a valuable tool for both the insight into the system dynamics, as well as a prerequisite for model development, calibration and validation. The low maintenance cost, a key aspect of the project, forced one towards a modular design, allowing different servicing intervals between the various parts of the system. Thus, only the necessary components were main-tained at each visit, avoiding the use of large and expen-sive vessels and at the same time ensuring a fast response to system failures. The main problems encountered were as-sociated with communication and data transfer both between lines 1 and 2 and between line 1 and HCMR. The other sig-nificant source of the problems was the optical sensors which were found to be very sensitive to biofouling and in particu-lar, the light transmittance sensors.
With the significant experience gained during the 2000– 2001 deployment, the project moved to the second phase with three major aims, the first of which was the im-provement of both underwater and aerial communications. Thus, under-water acoustic bi-directional modems and IMC modems were used, while the underwater hardwired network was embedded into the buoy container and attached on the mooring line. To overcome the problem of communication between the two lines during summer (thermocline develop-ment), higher rates (up to 4800 Bits/s) were developed. For
Phase I
0.0 0.2 0.4 0.6 0.8 1.0 1.2 1.4 1.6
6/12/99 5/3/00 3/6/00 1/9/00 30/11/00 28/2/01 29/5/01 27/8/01 25/11/01
C
h
l (µg/l)
40m 65m 90m 115m
Phase II
0 0.2 0.4 0.6 0.8 1 1.2 1.4 1.6
6/12/03 5/3/04 3/6/04 1/9/04 30/11/04 28/2/05 29/5/05 27/8/05 25/11/05
C
h
l (µg/l)
40m 65m 90m 115m
the aerial communication, a tested and very reliable tech-nology used on the 11 Seawatch buoys that operate in the Aegean Sea in the framework of the Poseidon project (Nittis et al., 2001) was selected, transmitting all data through the Inmarsat-C satellite. The disadvantages of the new system were the increased energy requirements and the increased running cost, but at the same time there was the possibility of two-way communication, an important feature, as minor problems (re-programming) could be solved from HCMR, thus avoiding on-site visits.
The second aim was the redesign of the surface buoy, thereby increasing modularity and flexibility and at the same time decreasing complexity and servicing requirements. Par-ticular attention was paid in the optimisation of the hull’s hydrodynamic performance.
The final aim was the minimisation of the biofouling ef-fect, especially for the optical sensors. To overcome this problem new methods and anti-fouling techniques have been developed worldwide, such as the generation of biocide chlo-rine compounds on tin oxide coating, the use of UV pulses, the incorporation of cooper shutters, the use of copper tub-ing and the bromide pumptub-ing technique, each one with its advantages and disadvantages. As not all of the above meth-ods were applicable, a pilot field study was performed with the techniques of bromine solution and copper shielding (tub-ing). The short experimental study suggested that a combina-tion of copper tubing and bromine solucombina-tion would be more ef-ficient than each one separately; therefore, this was selected for application to the M3A mooring. This pilot test demon-strates that the M3A system could be used in the future as a test bed, where prototypes and new methodologies are evalu-ated. Parallel to the above, several quality control procedures accompanied the deployment of the M3A platform during the second phase. The oligotrophy of the Aegean Sea dic-tated the need to ignore factory calibrations of the fluorom-eters, and to perform site-specific laboratory calibrations of the sensors. This procedure was proved necessary and pro-duced calibration coefficients that gave results comparable to the measurements obtained with the laboratory analysis method.
It should be noted that in the course of several projects in-volving moorings, like POSEIDON (Nittis et al., 2002; Nittis et al., 2001), MFSTEP and INTERPOL (Tragou et al., 2005), we have encountered the problem of improving the quality of the mooring time series through post-processing or compar-ison with reference measurements obtained through higher accuracy methods in the field. Based on previous experience from field hydrographic measurements, where salinity sam-ples from bottles are routinely used as reference measure-ments to improve the quality of CTD data, a first approach is to follow a similar methodology for mooring measurements. This approach would consist of collecting field samples from the instrument depths during the frequent maintenance visits, and after the retrieval of the complete time series produce a least-squares fit between the mooring measurements and the
reference values produced from the higher accuracy labora-tory methods. This approach was abandoned from the very early stages of our involvement in the quality assurance of mooring measurements, as the measurements made at a sin-gle depth usually exhibit small variability when compared to the potential range of the parameters in the area. This problem is rectified by the fact that the periodic maintenance visits provided a few reference samples that, in most cases, covered a very small range, even compared to the range of values of the collected time series. Thus, this approach leads to a bad estimate of the correlation slope between instrument and reference. To overcome this problem, it was decided that for mooring measurements it is imperative to perform pre-deployment and post-retrieval calibrations, if possible, in the laboratory, thus covering the whole possible range of param-eters under consideration.
Thus, in our experience, post-processing can be used as an assessment for the characterization and flagging of mea-surements, but not really for the recuperation of the time series. Even this process, however often, presumes some hypotheses (like long-term stationarity) that may not nec-essarily hold, and it might be unwise to adopt them in the process of just producing a reliable time series. Some pa-rameters require specific treatment. Transmissometers often exhibit rather linear drifts, which may be easily corrected if such intervention is justified by field measurements and the subsequent deployment of a “clean” sensor. The same holds for conductivity measurements. Fluorometers, however, ex-hibit a less linear behaviour. Very often, a shift at a new “background” value follows a recorded bloom, which may influence the effective geometry of the sensor’s window. An attempt to recuperate such measurements would involve the use of a combination of removing a linear trend and a step function. However, as mentioned above, in order to follow such a procedure in a justified way, while involving as few assumptions and perceptual models as possible, it is imper-ative to have high-frequency reference measurements, unaf-fected by biofouling. Only in the case of near-surface wa-ters it is possible to correlate with time-series provided by biofouling-free satellite measurements, in order to remove the drift of moored instruments like fluorometers, and even in this case, the newly-produced values should be flagged as “estimated”.
(increased eddy dipole intensity) can enrich the euphotic zone, initiating small-scale phytoplankton blooms (Tselepi-des and Polychronaki, 2000). The above features result in a highly variable environment with phenomena at very short time scales, almost impossible to capture with traditional sampling trips, thus demonstrating the importance of con-tinuous, multidisciplinary monitoring.
One of the common issues related to ocean observatories is the limited use of the data produced by the scientific com-munity. This problem is both due to the limited access to the data and to the fact that the data needs of the modellers and/or the experimentalists are rarely taken into account during the design of the platforms. In the case of the M3A this first issue has been adequately tackled by making widely available all data sets through the project web site. Additionally, during the system design phase, there was significant feedback be-tween the possible users as to where and what sensors should be used. As a result, the data has been used for both process studies that improve our understanding of the Mediterranean Sea functioning (Cardin et al., 2003) and for the development of ecological models that simulate its ecosystem variability (Allen et al., 2002; Petihakis et al., 2002; Siddorn and Allen, 2003; Triantafyllou et al., 2003b). A very important aspect of the data produced is its use in assimilation methods de-veloped by HCMR, in order to be able to use real-time M3A data into the MFS operational forecasting system (Hoteit et al., 2004; Hoteit et al., 2005; Hoteit et al., 2003; Triantafyl-lou et al., 2003a).
There are a number of marine research topics that obser-vation systems will offer a great deal in the future, such as the high frequency study of biogeochemical processes and in particular, the influence of anthropogenic perturbations in the ecosystem dynamics (Nittis et al., 2003), the ocean – climate coupling and the understanding of carbon diox-ide sequestration and the model development. The three-dimensional modelling of marine ecosystems is lagging be-hind the modelling of marine physics, because it requires ro-bust hydrodynamic models, adequate computing resources and most importantly, adequate field data. Additionally, in order to achieve predictive capabilities, deterministic ecosys-tem models need to be updated with biological, physical and chemical data at relevant space-time scales. Unfortunately, in most areas, long, high-frequency time series, which are crucial for the models as system parameters, do not exist. A network of ocean observatories collecting a wide range of high-resolution measurements, along with the capability of adaptive sampling of environmental events, would greatly enhance the ability of researchers to develop and improve models of oceanographic processes (Isern and Clark, 2003).
The overall experience from the two phases of the MFS project suggests that a continuous operation of the M3A sys-tem is feasible at relatively low cost, although new develop-ments and improvedevelop-ments in particular parts remains an open issue. During the last years important technological solutions have been produced by the continuously growing research
industry. Thus, more and more parameters can nowadays be measured both on board platforms and underwater in a wide range of conditions and with rather long servicing intervals. Although there is still a great deal on this research topic un-known, especially on biochemical parameters, the future is very promising.
Acknowledgements. The work was carried out in the framework of the Mediterranean Forecasting System – Pilot Project (MFSPP) and Towards Environmental Predictions (MFSTEP) projects. We acknowledge the support of the European Commission MAST3 Program that financed the project the General Secretary of Re-search and Technology of the Hellenic Ministry of Development for co-financing.
Edited by: D. Webb
References
Allen, J. I., Somerfield, P. J., and Siddorn, J. R.: Primary and bac-terial production in the Mediterranean Sea: a modelling study, J. Mar. Syst., 33–34, 473–495, 2002.
Balopoulos, T. E., Theocharis, A., Kontoyiannis, H., Varnavas, S., Voutsinou-Taliadouri, F., Iona, A., Souvermezoglou, A., Ignati-ades, L., Gotsis-Skretas, O., and Pavlidou, A.: Major advances in the oceanography of the southern Aegean Sea – Cretan Straits system (eastern Mediterranean), Prog. Oceanogr., 44, 109–130, 1999.
Cardin, V., Gaˇci´c, M., Nittis, K., Kovaˇcevi´c, V., and Perini, L.: Sub-inertial variability in the Cretan Sea from M3A buoy, Ann. Geo-phys., 21, 89–102, 2003,
http://www.ann-geophys.net/21/89/2003/.
Carpenter, J. H.: The accuracy of the Winkler method for the dis-solved oxygen analysis, Limnology and Oceanology, 10, 135– 140, 1965.
Colwell, R.: Ocean research interactive observatories networks (ORION): Planning for the future of ocean science at the Na-tional Science Foundation, Ocean Observing Systems, 37(3), 15–20, 2003.
Drakopoulos, P., Petihakis, G., Valavanis, V., Nittis, K., and Tri-antafyllou, G.: Optical variability associated with phytoplank-ton dynamics in the Cretan Sea during 2000 and 2001, Elsevier Oceanography Series, Elsevier BV, 554–561, 2003.
Georgopoulos, D., Chronis, G., Zervakis, V., Lykousis, V., Pou-los, S., and Iona, A.: Hydrology and circulation in the Southern Cretan Sea during the CINCS experiment (May 1994–September 1995), Prog. Oceanogr., 46, 89–112, 2000.
Hoteit, I., Triantafyllou, G., and Petihakis, G.: Towards a data as-similation system for the Cretan sea ecosystem using a simplified Kalman filter, J. Mar. Syst., 45, 159–171, 2004.
Hoteit, I., Triantafyllou, G., and Petihakis, G.: Efficient data assim-ilation into a complex 3-D physical-biogeochemical model using a semi-evolutive partially-local Kalman filters, Ann. Geophys., 23, 1–15, 2005,
http://www.ann-geophys.net/23/1/2005/.
Isern, A. R. and Clark, H. L.: The ocean observatories initiative: A continued presence for interactive ocean research, Ocean Ob-serving Systems, 37(3), 26–41, 2003.
Manov, D. V., Chang, G. C., and Dickey, T. D.: Methods for re-ducing biofouling of moored optical sensors, J. Atmos. Oceanic Technol., 21, 958–968, 2004.
Nittis, K., Tziavos, C., Thanos, I., Drakopoulos, P., Cardin, V., Gacic, M., Petihakis, G., and Basana, R.: The Mediterranean Moored Multi-sensor Array (M3A): System Development and Initial Results, Ann. Geophys., 21, 75–87, 2003,
http://www.ann-geophys.net/21/75/2003/.
Nittis, K., Zervakis, V., Papageorgiou, E., and Perivoliotis, L.: At-mospheric and Oceanic observations from the POSEIDON buoy network: Initial results, The Global Atmosphere and Ocean Sys-tem, 8(2–3), 87–99, 2002.
Nittis, K., Zervakis, V., Perivoliotis, L., Papadopoulos, A., and Chronis, G.: Operational Monitoring and Forecasting in the Aegean Sea: System Limitations and Forecasting Skill Evalu-ation, Marine Pollution Bulletin, 43(7–12), 154–163, 2001. Petihakis, G., Triantafyllou, G., Allen, J. I., Hoteit, I., and Dounas,
C.: Modelling the Spatial and Temporal Variability of the Cretan Sea Ecosystem, J. Mar. Syst., 36(3–4), 173–196, 2002.
Pinardi, N. and Flemming, E.: The Mediterranean Forecasting Sys-tem, Science Plan, 11. EuroGOOS Publication, Southampton, 1998.
Seim, H., Nelson, J., Bane, J., Blanton, J., Werner, F., Jahnke, R., Moran, M., Zepp, R., and Paffenhofer, G.: SABSOON sci-ence report, in: Skidaway Institute of Oceanography, edited by: Group, S., Savannah, USA, 2000.
Siddorn, J. R. and Allen, J. I.: Surface heat fluxes and ecosystem function in the Cretan Sea (eastern Mediterranean): a modelling study, Ann. Geophys., 21, 377–388, 2003,
http://www.ann-geophys.net/21/377/2003/.
Thanos, I. and Pezirtzoglou, E.: Design and Construction of a Pro-totype Wave Directional Data Buoy, Hellenic Symposium on Oceanography and Fisheries, NCMR, Kavala, Greece, 1997. Theocharis, A., Balopoulos, E., Kioroglou, S., Kontoyiannis, H.,
and Iona, A.: A synthesis of the circulation and hydrography of the South Aegean Sea and the Straits of the Cretan Arc (March 1994–January 1995), Progress in Oceanography, 44, 469–509, 1999.
Tragou, E., Zervakis, V., Papageorgiou, E., Stavrakakis, S., and Lykousis, V.: Monitoring the physical forcing of resuspension events in the Thermaikos Gulf – NW Aegean during 2001–2003, Continental Shelf Research, 25, 2315–2331, 2005.
Triantafyllou, G., Hoteit, I., and Petihakis, G.: A singular evolutive interpolated Kalman filter for efficient data assimilation in a 3-D complex physical-biogeochemical model of the Cretan Sea, J. Mar. Syst., 40–41, 213–231, 2003a.
Triantafyllou, G., Petihakis, G., and Allen, J. I.: Assessing the per-formance of the Cretan Sea ecosystem model with the use of high frequency M3A buoy data set, Ann. Geophys., 21, 365–375, 2003b.
Tselepides, A. and Polychronaki, T.: The CINCS project: introduc-tion, Progress in Oceanography, 46, 85–88, 2000.