www.atmos-meas-tech.net/4/2823/2011/ doi:10.5194/amt-4-2823-2011
© Author(s) 2011. CC Attribution 3.0 License.
Measurement
Techniques
A critical examination of spatial biases between MODIS and MISR
aerosol products – application for potential AERONET deployment
Y. Shi1, J. Zhang1, J. S. Reid2, E. J. Hyer2, T. F. Eck3, B. N. Holben3, and R. A. Kahn3
1Department of Atmospheric Sciences, University of North Dakota, Grand Forks, ND, USA 2Marine Meteorology Division, Naval Research Laboratory, Monterey, CA, USA
3NASA GSFC, Greenbelt, MD, USA
Received: 12 May 2011 – Published in Atmos. Meas. Tech. Discuss.: 8 July 2011
Revised: 4 November 2011 – Accepted: 17 November 2011 – Published: 22 December 2011
Abstract. AErosol RObotic NETwork (AERONET) data are the primary benchmark for evaluating satellite-retrieved aerosol properties. However, despite its extensive coverage, the representativeness of the AERONET data is rarely dis-cussed. Indeed, many studies have shown that satellite re-trieval biases have a significant degree of spatial correla-tion that may be problematic for higher-level processes or inverse-emissions-modeling studies. To consider these issues and evaluate relative performance in regions of few surface observations, cross-comparisons between the Aerosol Opti-cal Depth (AOD) products of operational MODIS Collec-tion 5.1 Dark Target (DT) and operaCollec-tional MODIS CollecCollec-tion 5.1 Deep Blue (DB) with MISR version 22 were conducted. Through such comparisons, we can observe coherent spatial features of the AOD bias while sidestepping the full analy-sis required for determining when or where either retrieval is more correct. We identify regions where MODIS to MISR AOD ratios were found to be above 1.4 and below 0.7. Re-gions where lower boundary condition uncertainty is likely to be a dominant factor include portions of Western North America, the Andes mountains, Saharan Africa, the Arabian Peninsula, and Central Asia. Similarly, microphysical bi-ases may be an issue in South America, and specific parts of Southern Africa, India Asia, East Asia, and Indonesia. These results help identify high-priority locations for possible fu-ture deployments of both in situ and ground based remote sensing measurements. The Supplement includes a kml file.
Correspondence to: J. Zhang ([email protected])
1 Introduction
The AErosol RObotic NETwork (AERONET), a global scale sun photometer network, has been providing robust aerosol spectral optical depth measurements, and some con-straints on column-effective particle properties, for nearly two decades. As such, it is often used as the primary stan-dard for validating satellite aerosol products (e.g., Holben et al., 1998; Kahn et al., 2010; Levy et al., 2010; Hsu et al., 2006). AERONET has included 443 sites globally, with un-der half that number operating at any one time, on average, during the past decade. Only 11 sites have data records that are longer than seven years, and 39 sites have data records that are longer than five years. Field campaigns, which ex-tensively measure the environment in support of verification, target specific areas of interest but are sporadic and short lived. This ephemeral nature of observations suitable for satellite product characterization leads to fundamental ques-tions about the representativeness of available validation data sets. For example, are there any regions with poor surface ob-servation data that clearly require future deployments of sun photometer instruments and/or in situ measurements, espe-cially for the purpose of validating satellite observations?
Recently Shi et al. (2011), Hyer et al. (2011) and Levy et al. (2010) published evaluations of the over water and land MODIS Dark Target (DT) Collection 5 aerosol prod-ucts. Over water, low and high biases are quite clear for fine and coarse mode aerosol particles, respectively. Wind and cloud related biases are visible as well. Uncertainties are also shown over coastal regions, where runoff and/or biolog-ical activity create issues for the surface boundary conditions (e.g., Kahn et al., 2010). Biases in the over-water aerosol optical depth (AOD) product were found to be largely cor-rectable through model data and information contained in the retrieval (e.g., Zhang and Reid, 2006). The over-land prob-lem, however, is much more complicated. The lower bound-ary condition for MODIS DT Collection 5 is empirical and cannot cope with all land forms everywhere. The more com-plicated land surface also reduces the degrees of freedom in available microphysical models that can be utilized by the re-trievals. As a consequence, Hyer et al. (2011) reported many cases where correlations between satellite and AERONET AOD are good within regions, but slopes are vastly differ-ent. Such regionally correlated biases are particularly prob-lematic for higher-level investigations that require consistent data over large areas, such as inverse modeling or lifecycle studies. Also, Kahn et al. (2010) identified MISR – MODIS DT AOD differences over India, Eastern China, and South-eastern Asia that they attributed, in part, to dark particles ab-sent from the current algorithm particle climatologies. They noted that a lack of mixtures containing dust and smoke opti-cal analogs in the algorithms create AOD discrepancies over Sub-Saharan Africa and several other locations (also see Eck et al., 2010 regarding mixtures).
One way to approach spatially correlated biases is through cross-comparisons between satellite aerosol products, not only over the AERONET sites, but also over regions that may lack ground-based observations. Several studies have conducted comparisons of aerosol retrievals among differ-ent sensors mostly highlighting the differences among satel-lite aerosol optical depth retrievals (Myhre et al., 2004; Ab-dou et al., 2005; Mishchenko et al., 2007, 2009; Liu and Mishchenko, 2008; Kahn et al., 2007, 2009, 2010, 2011). Although some spatial information is presented in these ef-forts, a pair-wise map of regions of spatially coherent bias be-tween sensor products has yet to be published. Indeed, such a product is useful not only to understand error covariance – a necessary constraint for data assimilation, but more funda-mentally, we want to know how well such bias features relate to areas of ground truth, such as AERONET sites. Such prod-ucts do not specifically resolve global issues related to quan-titative error characterization, but are beneficial in determin-ing the overall scientific uncertainty of aerosol properties. In regions with large differences among products, the data need to be understood and the causes of the discrepancies should be studied. This need has been addressed to some extent in the studies cited above, and it motivates the current study, which aims specifically at helping direct future deployments
of surface measurements to support the refinement of future generations of algorithms.
To evaluate regions of spatially correlated bias, three com-monly used global satellite aerosol products were selected for this study: the Terra operational Moderate Resolution Imaging Spectroradiometer (MODIS) Collection 5.1 Dark Target (DT) aerosol product, the Terra MODIS Collection 5.1 Deep Blue (DB) aerosol product, which retrieves aerosol properties, especially but not limited to, over bright surfaces, and the Multiangle Imaging SpectroRadiometer (MISR) ver-sion 22 aerosol product. Note that these three products were chosen because they are widely used by the community for various applications ranging from climate to air quality to real-time operational forecasts (Zhang et al., 2001, 2008a,b; Kaufman et al., 2002; Remer et al., 2009; Kahn et al., 2009; Reid et al., 2009; Hsu et al., 2006; Zhang and Reid, 2006). All three products were spatially and temporally collocated, and were used for evaluating the existing aerosol observation system. We conclude with a discussion of regions showing clear inconsistency between sensor retrieval results, propos-ing areas that have an urgent need for additional, suborbital measurements.
2 Datasets
use of the MODIS near UV channels (Hsu et al., 2006). The Collection 5.1 MODIS AQUA DB AOD has reported uncertainties on the order of 20–30 %.
MISR, which is onboard the Terra satellite, provides near-simultaneous observations at nine viewing angles (nadir,
±26.1, ±45.6,±60.0, and ±70.5 degrees) in four spectral bands at 446.4 nm, 557.5 nm, 671.7 nm, and 866.4 nm. It has a much narrower swath of∼380 km (Diner et al., 2002) compared with 2330 km of MODIS, providing global cov-erage about once per week. MISR has been successfully used to retrieve aerosol properties globally, including over bright desert surfaces (Kahn et al., 2010). Kahn et al. (2005, 2010) showed that approximately one standard deviation of uncertainty in MISR retrieved AOD is on the order of 0.05 or 0.2×AOD, whichever is larger. Biases and uncertainties in MISR AOD values are associated with cloud contamina-tion, and lower boundary conditions in some locations (Kahn et al., 2010). Uncertainties are also found over regions that have mixtures of dust and smoke aerosol types, as only lim-ited numbers of aerosol models are used in the retrieval pro-cess. Specific biases have been identified for retrievals with AOD values lower than 0.025 or higher than 0.5 (Kahn et al., 2010). Besides AOD, constraints on particle shape, size, and absorption are also reported by the MISR aerosol product.
Different sensors have different spatial coverage and over-pass times. For fair comparisons, pairs of observations from different instruments need to be collocated spatially and tem-porally. Since both MISR and MODIS are onboard the Terra satellite, it is possible to have simultaneous observations over the same location from both instruments. However, the two aerosol products have different spatial resolutions (10 km for MODIS DT and DB, and 17.6 km for MISR) and are not exactly overlapping. Therefore, to spatially collocate the MODIS DT (MODIS DB) products with MISR, all three products were averaged into 0.5◦×0.5◦ (Lat/Lon) gridded products for every six hours. Note that the MODIS swaths overlap near the poles, so gridding over six hours will po-tentially combine data from different orbits. However, this does not affect the analysis presented in this paper because such overlaps will only occur at the swath edges for MODIS and MISR swaths do not overlap. At the second step, the six-hour gridded aerosol products were collocated in both space and time, and pairs of data points with valid AOD values from both MODIS DT (or MODIS DB) and MISR aerosol products were chosen for the tests described in the following section. Two comparison datasets were used in this study: (1) spatially and temporally collocated Terra Col-lection 5.1 MODIS DT and MISR Version 22 aerosol prod-ucts from 2005–2007 and (2) spatially and temporally collo-cated Terra Collection 5.1 MODIS DB and MISR Version 22 aerosol products from 2005–2007.
3 Results
In this paper, our results begin by presenting example satel-lite to AERONET AOD regressions for eight important ge-ographical regions. This demonstrates the nature of aerosol retrievals against some ground truth. Then, to understand the size of the satellite-to-satellite AOD bias features, we find the ratio of MODIS to MISR AOD retrievals, and study the spatial patterns through spatially and temporally collocated comparisons. From these comparisons, we return to our orig-inal eight comparisons with AERONET, and discuss limita-tions in spatial coverage of the current ground-based obser-vations in the problematic regions identified from our results. 3.1 Example AERONET comparisons
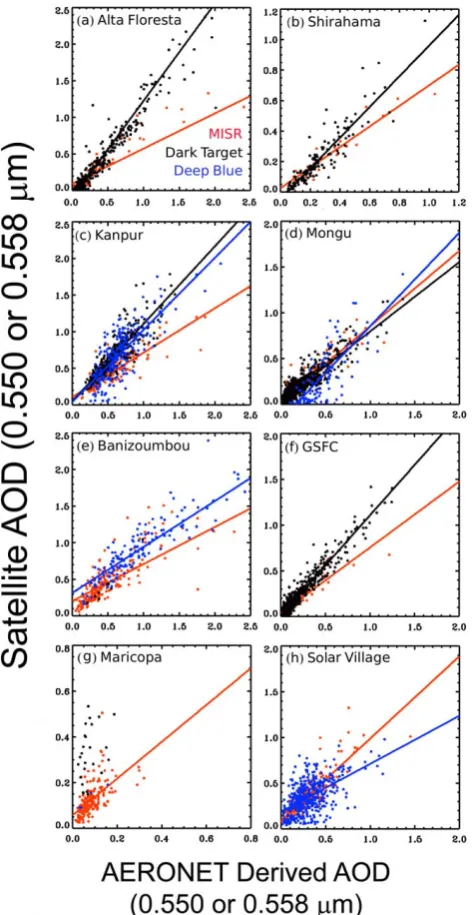
Eight AERONET sites, which have at least five-year data records that provide observations to the aerosol state of a given region, were selected: Alta Floresta (for South Amer-ica), Banizoumbou (for North AfrAmer-ica), GSFC (for the East-ern US), Maricopa (for the WestEast-ern US), Kanpur (for India), Mongu (for South Africa), Solar Village (for Saudi Arabia) and Shirahama (for East Asia). AERONET direct sun mea-surements of AOD are highly accurate, with uncertainties on the order of∼0.01 in the visible and near-infrared channels for the level 2 product (Eck et al., 1999). Using the stan-dard Angstrom linear fit in log-log space, AERONET obser-vations from the 0.50 or 0.44 and 0.67 µm channels were used to estimate AOD values at the 0.55 (for MODIS) and 0.558 (for MISR) µm channels (Shi et al., 2011). Within a±30 min temporal window and 0.1 degree spatial difference, one-to-one collocated operational MODIS/MISR (level 2) and AERONET AOD were used for the comparisons for 2000 to 2007. Regressions are shown in Fig. 1, with regression line parameters andr2values presented in Table 1. Because the behavior of satellite retrievals can change when AODs are due, in part, to multiple scattering, and because only some regions have high AODs (resulting in sampling bias between regions), we provide statistics for all data and also for those AODs less than 0.5. Slopes, intercepts,r2, number of data points and the 95 % confidence interval of correlation coefficients (Spiegel and Stephens, 1999) are provided.
24
Figure 1
Fig. 1. One to one comparisons between MODIS Dark Target (MODIS Deep Blue)/MISR and AERONET AOD at seven sites for year 2000–2008. (a) Alta Floresta, (b) Shirahama, (c) Kanpur,
(d) Mongu, (e) Banizoumbou, (f) GSFC, (g) Maricopa, (h) Solar
Village.
an underestimation is observed for high MISR AOD values (AOD>0.5), in almost all regions, except Mongu (as previ-ously reported in Kahn et al., 2010), the influence of lower boundary conditions (generally manifested in the intercept of the regressions) is less evident in MISR-AERONET than the MODIS-AERONET comparisons (Kahn et al., 2010; Hyer et al., 2011; Shi et al., 2011). For example, over the West-ern US, where AERONET reported AOD values are mostly
smaller than 0.2, collocated AOD values from the opera-tional MODIS DT aerosol products show a much higher AOD range up to 0.6. Note that the black regression line for MODIS is not provided from the Maricopa plot due to an insufficient number of data points, as well as a scattered and non-linear pattern of the data distribution that makes a linear regression less representative. Also, large intercept values are observed for the comparisons between the MODIS DB and AERONET AOD values at the Mongu site, showing that uncertainties can exist for the MODIS DB products over low surface albedo regions. In contrast, observations from the Banizoumbou and Solar Village sites confirm that both the MODIS DB and MISR have capability to retrieve aerosols over bright surfaces (e.g., Diner et al., 2001; Martonchik et al., 2004; Hsu et al., 2006).
However, point comparisons are not sufficient and may not fully represent the performance of satellite AOD retrievals. For example, the spatial comparisons between MISR and MODIS over South Africa in Sect. 3.2 (Fig. 4) indicate larger differences than what the point comparisons show at the AERONET site. Here we simply want to point out that sparse point comparisons may not be representative of the perfor-mance of a product over a region. Similar observations are also made over the Arabian Peninsula. Comparisons between satellite AOD products are therefore evaluated globally for the rest of the paper.
3.2 Global ratios
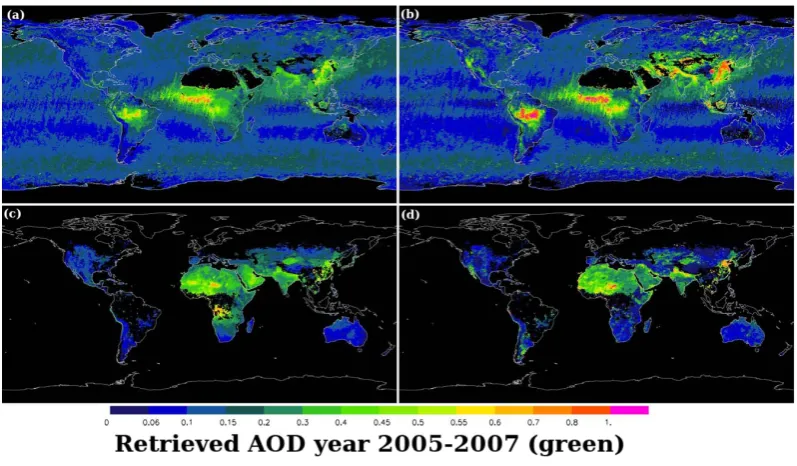
The regressions shown in the previous section reveal a com-mon observation: satellite products often correlate well with each other, but suffer from slope or Y-intercept biases. In-deed, Hyer et al. (2011) reported highly variable regression slopes of MODIS collection 5 against AERONET for differ-ent sites in the same geographical region. The question there-fore becomes: Over what area do these regressions hold? We begin with an examination of overall AOD for the 2005–2007 timeframe in Fig. 2, keyed to data of simultaneous MODIS and MISR retrievals. Also, as part of the Supplement, Fig. 2 is repeated seasonally (DJF, MAM, JJA, SON).
Table 1. Regression coefficients and 95 % confidence interval (CI) for correlation coefficients in Fig. 1 with all AOD and satellite AOD
smaller than 0.5 in parentheses. No statistics are shown when number of points are smaller than 25.
Site Satellite Slope Intercept r2 # of points Upper CI Lower CI
Alta Floresta (9◦S, 56◦W) MISR 0.48 (0.81) 0.09 (0.00) 0.77 (0.82) 107 (88) 0.92 (0.94) 0.83 (0.86) MODIS DT 1.33 (1.01) 0.1 (−0.05) 0.92 (0.82) 467 (353) 0.97 (0.92) 0.95 (0.89)
Shirahama (33◦N, 135◦E) MISR 0.67 (0.66) 0.03( 0.03) 0.90 (0.84) 29 (26) 0.98 (0.96) 0.89 (0.82) MODIS DT 1.01 (0.85) 0.05 (−0.02) 0.83 (0.79) 146 (137) 0.93 (0.92) 0.88 (0.84)
Kanpur (26◦N, 80◦E)
MISR 0.61 (0.47) 0.11 (0.13) 0.70 (0.54) 136 (89) 0.88 (0.82) 0.78 (0.62) MODIS DT 1.06 (0.54) 0.05 (0.21) 0.79 (0.43) 411 (142) 0.91 (0.74) 0.87 (0.55) MODIS DB 0.98 (0.28) 0.04 (0.19) 0.60 (0.11) 213 (68) 0.82 (0.52) 0.72 (0.09)
Mongu (52◦S, 23◦E)
MISR 0.82 (0.74) 0.03 (0.04) 0.88 (0.75) 210 (192) 0.95 (0.90) 0.92 (0.82) MODIS DT 0.76 (0.67) 0.04 (0.05) 0.83 (0.71) 870 (820) 0.92 (0.86) 0.90 (0.82) MODIS DB 1.02 (0.54) 0.17 (−0.04) 0.60 (0.34) 99 (78) 0.84 (0.72) 0.68 (0.42)
Banizoumbou (13◦N, 2◦E)
MISR 0.51 (0.51) 0.20 (0.14) 0.61 (0.49) 220 (153) 0.83 (0.77) 0.72 (0.61)
MODIS DT – (–) – (–) – (–) – (–) – (–) – (–)
MODIS DB 0.63 (–) 0.32 (–) 0.81 (–) 148 (–) 0.93 (–) 0.87 (–)
GSFC (38◦N, 76◦W) MISR 0.72 (0.80) 0.03 (0.02) 0.87 (0.90) 175 (171) 0.95 (0.96) 0.91 (0.93) MODIS DT 1.1 (1.06) 0.01 (0.01) 0.94 (0.84) 744 (671) 0.97 (0.93) 0.97 (0.91)
Maricopa (33◦N, 111◦W)
MISR 0.8 (0.77) 0.06 (0.06) 0.35 (0.39) 180 (179) 0.68 (0.70) 0.49 (0.52)
MODIS DT – (–) – (–) – (–) – (–) – (–) – (–)
MODIS DB – (–) – (–) – (–) – (–) – (–) – (–)
Solar Village (24◦N, 46◦E) MISR 0.9 (0.68) 0.09 (0.13) 0.74 (0.66) 261 (227) 0.89 (0.85) 0.82 (0.77) MODIS DB 0.53 (0.29) 0.19 (0.21) 0.35 (0.12) 440 (350) 0.65 (0.43) 0.52 (0.25)
25
Figrue 2
Fig. 2. Average of spatial distribution of MISR (0.558 µm) and operational MODIS Dark Target (DT) and MODIS Deep Blue (DB) (0.55 µm)
for 2005–2007. The MISR and operational MODIS DT/MODIS DB AOD data were first collocated both in space and time, and only collocated MISR and MODIS retrievals were used in generating this plot. Data were gridded every 0.5◦×0.5◦(Lat/Lon). (a) MISR AOD that corresponds with operational MODIS DT, (b) Operational MODIS DT AOD, (c) MISR AOD that corresponds with MODIS DB, and
of dust, smoke and pollutants are observable over East and South Asia (Reid et al., 2009; Eck et al., 2005). Long-range aerosol transports are also shown. Asian dust plumes cross the Pacific Ocean and reach the West Coast of the US; North African dust plumes cross the Atlantic Ocean and reach the Caribbean. A high AOD band is also noticeable over high latitude southern oceans. However, this feature is probably produced by cloud artifacts (e.g., Zhang et al., 2005; Shi et al., 2011; Kahn et al., 2010; Smirnov et al., 2011).
Figure 2b shows the corresponding operational MODIS DT AOD distributions. Because only pairs of MODIS and MISR data that possess valid AOD values were used in creating Fig. 2, the differences between Fig. 2a and b are mostly related to the differences in the retrieval processes, as sampling biases between the two products are minimized. High AOD features over the Western US, the Andes moun-tains, and the Namibian desert from Fig. 2b are not found in the spatially and temporally collocated MISR AOD plot in Fig. 2a. These results for the Western US agree with the results reported in van Donkelaar et al. (2006, 2010). Also, MODIS DT AOD values are higher than the collocated MISR AOD values over regions such as East and Central Asia, India, Indonesia, South Africa, and South America. Note that the differences seem significant, yet could mostly be explained with the known limitations of each product. For example, for the MODIS DT aerosol product, overestima-tion of AOD values that are greater than 0.5, which appear over sparely vegetated land (e.g., the Andes mountains, the Namibian desert, and the Western US), could be due to the uncertainties in surface characteristics, which deviate from the surface reflectance model used in the operational MODIS product. In another case, higher MODIS DT AOD values over South America, South Africa, and Central Asia could be related to the underestimation of the MISR aerosol prod-uct for high AOD (Kahn et al., 2009, 2010; Olga Kalash-nikova, personal communication, 2010). This effect can be observed in the Alta Foresta data (Fig. 1), in which the MISR retrieval underestimates the biomass burning AOD compared to AERONET.
Figure 2c and d are structured the same as Fig. 2a and b, but they show the comparison of MODIS DB and MISR aerosol products. Figure 2c shows the three-year (2005– 2007) averaged spatial plot of MISR AOD (collocated with the MODIS DB product). Heavy aerosol loadings are found for dust over North Africa and the Arabian Peninsula, for smoke over South Africa, and for pollutant mixed dust over Northern India and East Asia. Figure 2d shows the corre-sponding MODIS DB AOD distributions. For South Amer-ica, Northern India (e.g., the Kanpur site), and East Asia, higher AOD values are shown for the MODIS DB prod-uct. Conversely, MODIS DB has much lower AODs in central Africa and parts of the Arabian Peninsula. Over desert regions such as North Africa and the Middle East, the AOD values from the two products have differences around 0.1 to 0.3.
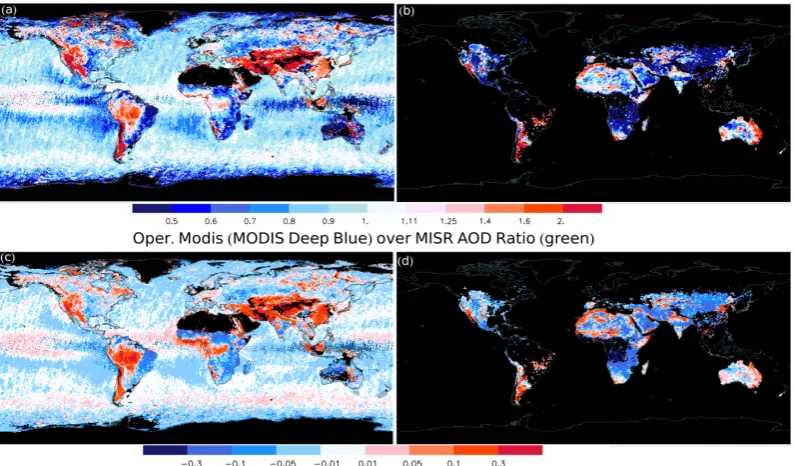
To better illustrate the differences, Fig. 3a and b show spa-tial plots of the MODIS DT and MODIS DB AOD divided by the MISR AOD. There is a small wavelength difference be-tween MODIS and MISR channels around 550 nm (550.0 nm for MODIS and 557.5 nm for MISR). Not accounting for the wavelength difference also leads to small differences in the AODs themselves. Red colors represent regions in which MODIS retrieves higher AOD than MISR, and blue colors show the opposite. For Fig. 3a, ratios larger than 1.4 are found over Western and Northeast Canada, the Western US, the Andes mountains, most of the Amazon, and Central and East Asia, indicating that the MODIS DT AOD values are much higher than the MISR AOD values over these regions. Ratios smaller than 0.7 are found over the Central US, the east coasts of South America and South Africa, and North-Central Asia. Also, even over regions like South Africa and South America, where we expect both sensors to have bet-ter performance due to relatively low surface reflectivity, ra-tios of 1.1–1.5 are found. Shown in the left-hand panels of Fig. 3, the patterns are consistent with Kahn et al. (2010) and Mishchenko et al. (2009). Some of this behavior also appears in the sensor-AERONET comparisons for the Alta Floresta site in Fig. 1. Figure 3b shows that over parts of the Western US, Southern South America, North Africa, Cen-tral Asia, Northern India, and Eastern AusCen-tralia, the ratios between MODIS DB and MISR AOD are greater than 1.4. Regions where MISR retrievals are much greater than those from MODIS DB are South Africa, the middle of the Ara-bian Peninsula, Mid-India, and part of Central Asia. How-ever, the ratio plots from Fig. 3a and b can be misleading, because high ratio values over regions with small AOD val-ues can skew the picture. Therefore, the AOD differences (MODIS DT – MISR) and (MODIS DB – MISR) for the green band are shown in Fig. 3c and d, respectively. The main patterns of Fig. 3c and d are very similar to that of Fig. 3a and b. However, regions with low AOD values and very high ratio values, such as the Western US, have AOD differences on the order of 0.1–0.3. Conversely, over Cen-tral Africa, where the ratio plot does not show a large in-consistency, Fig. 3c and d highlight the regions with AOD differences larger than 0.1. Also, AOD differences over the tropical and high-latitude oceans are small, despite showing large ratios in places (Fig. 3a and c, respectively).
26
Fig. 3. (a) The ratio of operational MODIS DT over MISR AOD in green channel for year 2005–2007. (b) Similar to (a) but for MODIS
DB. (c) The differences between operational MODIS DT and MISR AOD in green channel for year 2005–2007, and (d) Similar to (c) but for MODIS DB. Note the color scales are different between the top and the bottom panels.
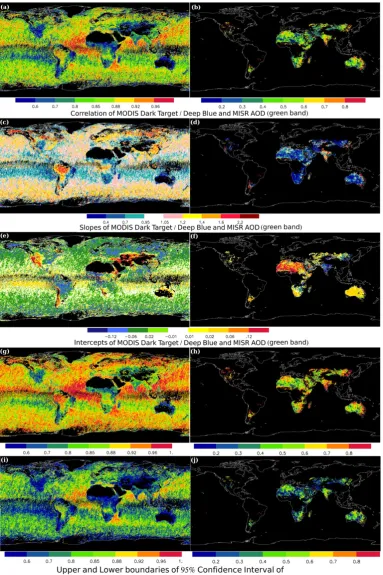
collocated MODIS and MISR data with AOD values between 0–0.5 (MODIS = MISR×slope + intercept). Figure 4a, c and e show spatial distributions of correlation, slope, and inter-cept values, respectively, for the regression analysis using the collocated operational MODIS DT and MISR AOD data. Like Fig. 2, Seasonal regressions are included in the Sup-plement. Similar to the studies of Kahn et al. (2009), corre-lation values greater than 0.8 are found over global oceans and most land regions. Regions with correlation values less than 0.7 are found over the Western US, the Andes moun-tains, the Namibian desert, and parts of the Middle East, Central Asia, and Northern Australia. Most of the regions showing poor correlations are highlighted in intercept plot of Fig. 4e as well. Regions with large intercept values indicate locations where surface reflectance values may be underes-timated for the MODIS DT retrievals, typically in arid and semi-arid regions with high surface reflectance (Kahn et al., 2010; Hyer et al., 2011). Also, although the correlations be-tween MISR and MODIS DT AOD data are above 0.8 over the Amazon region, slope values of 1.2 and above are found (Fig. 4c). Similar slope and correlation patterns can also be found over the middle of South Africa and Southeast Asia, suggesting potential aerosol microphysical biases over these regions. Issues with aerosol type in the retrievals for some of these regions have been noted previously (e.g., Kahn et al., 2010; Levy et al., 2010). However, field campaigns can further improve satellite retrievals over regions where bet-ter aerosol property information is lacking. Also, for both
satellite products, high correlations of 0.8 or greater were found compared with ground-based sun photometer obser-vations on a global basis (Shi, 2009; Hyer et al., 2011; Shi et al., 2009), showing that:
1. There are still regions that have no or few sites that would assist in refining assumed aerosol properties for satellite retrievals.
2. Additional AERONET sites are desired for some of the regions with large MODIS/MISR ratio values, espe-cially for regions where it is suspected that aerosol op-tical property assumptions cause large uncertainties in satellite retrievals.
3. For regions where satellite products need better aerosol property information to constrain assumptions, field measurements can play an important role, including aircraft in situ observations, especially where multiple layers of different aerosol types are present.
4. Note that building up a statistically useful database for new AERONET sites may take time, but such efforts are potentially beneficial to not only current but most importantly to future sensors.
Fig. 4. The regression and correlations between MISR and operational MODIS DT (right panel) / MODIS DB (left panel) for year 2005-2007
MODIS and MISR data, lower correlation, larger intercept values and lower slope values were found. However, most regions shown in Fig. 4b, d and f are either desert regions or areas with complex surface features, and therefore, lower correlations between two aerosol products are expected, due to lower sensitivity to aerosol properties over bright surfaces. Still, detailed analyses of the uncertainties for the two aerosol products over these regions, similar to the studies conducted for the MODIS DT aerosol products (e.g., Shi et al., 2011; Hyer et al., 2011), are necessary.
In sum, the areas with large disagreements between satellite retrievals can be divided into three categories:
1. Complicated surface conditions: transition areas from bare land to areas with dense or sparse vegetation cover; 2. Complicated aerosol type: inaccurate representations of aerosol microphysics in the retrieval processes over the dark vegetation areas or dark surfaces;
3. Desert regions with very bright surfaces.
Most problematic areas belong in the first category. These re-gions include: the Somalia region (0–20◦N, 35–50◦E), the North Coast of Africa (20–35◦N), the Sahel zone (∼12◦N across Africa), the West Coast of Africa (15–25◦S), the East Coast of Africa and Madagascar (10–20◦S), the East Coast of Brazil, the Andes mountains, the West Coast of US, the East Coast of Australia, Kazakhstan, and Mongolia. The Yellow Sea region near coastal China also has a surface-type problem, as it is a region with turbid waters. Regions that fall into the second category (complicated aerosol types) in-clude: 5◦N–5◦S and 10–30◦E of Africa, 5–10◦S and 60–
70◦W of South America, 20–35◦N and 100–115◦E of China
and Korea, the south and north end of Japan, Malaysia, In-donesia, and the Philippines. Better agreement for aerosol retrievals among sensors is expected for the regions with low surface reflectivity in the visible spectrum. However, the AOD differences between the two products can still be rel-atively large (AOD>0.1). This indicates that the compli-cated aerosol type is a likely source of uncertainty. For ex-ample, some places are known to have dark particles or mix-tures of smoke or pollution and dust. Regions that fall into the third category include: Northwestern India (70◦E and 35◦N), Iran and Afghanistan (45–60◦E and 25–35◦N), Ti-bet, the East Coast of the Arabian Peninsula (45–60◦E, 10– 30◦N), and high latitude areas. Also, differences in MISR
and MODIS retrievals do not always point to a lack of un-derstanding of the basic aerosol properties in the region. Rather, they sometimes indicate satellite algorithm issues for one or both instruments. For example, numerous field cam-paigns have been conducted over regions such as 5–10◦S and 60–70◦W of South America (e.g., Reid et al, 1998, 2005, SCAR-B and SMOCC campaigns), where many AERONET observations are available. Even with extensive in situ and ground based observations, such regions may also reveal the
difficulty of fully understanding aerosol properties and their spatial/temporal variations from limited ground and in situ observations.
4 Discussion: relationship to spatial distribution of AERONET sites
Most of the problem areas listed in Sect. 3 are very remote and under-developed. Hence, this increases the difficulty in establishing long-term AERONET sites, which would be useful for validating the satellite aerosol retrievals over those regions. Conversely, regions with the best agreement often have the highest density of AERONET sites, even though the surrounding areas might have large inconsistencies. This is partially because the aerosol climatology used by the MODIS DT over-land algorithm is based on AERONET data (Levy et al., 2010). Also, this may, in part, be related to the concentration of sites in more developed “darker” re-gions where vegetation cover is greater. The distribution of sites results in a sampling bias. The use of “global” statistics from AERONET to measure product efficacy biases verification statistics in favor of satellite retrievals. Long-term AERONET observations greatly improve the satellite retrievals regionally by providing developers with valuable verification data that is coupled with some aerosol optical property information from sun-sky retrievals.
However, several issues were raised with the previous analysis. First, some significant differences occur in regions with existing AERONET sites, and the differences between MISR and MODIS are due largely to the assumed aerosol properties in the satellite algorithms and/or limitations in the algorithm, such as high AOD for MISR (this is seen in Fig. 1 in the Amazon region with dark surfaces) or high surface re-flectance for MODIS. Second, the ratio of AOD retrievals between two sensors/algorithms in regions of low AOD is not necessarily a good measure of whether errors are signifi-cant. Third, even if there are AERONET sites in high surface reflectance areas, the main issue in satellite retrievals is of-ten the poor surface reflectance characterization, and more AERONET sites will not necessarily improve that situation.
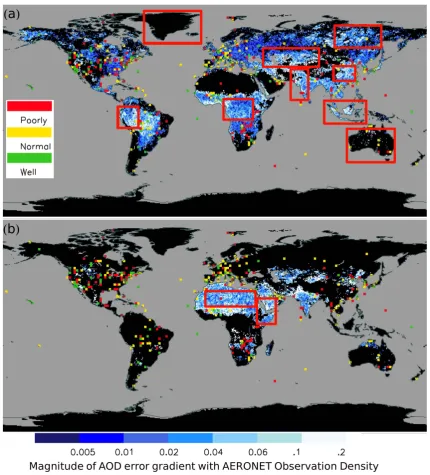
In response to these questions, a gradient map of AOD differences (1AOD, MODIS DT / MODIS DB minus MISR AOD at the green channel) between satellite aerosol products was computed, as shown in Fig. 5. Over-plotted in Fig. 5 are the frequency indices of available AERONET data. To create the gradient map of 1AOD, only regions with both satellite AOD values larger than 0.1 were used. The gradient is computed based on Eq. (1),
AOD Error Gradient= s
∂1AOD
∂x 2
+
∂1AOD
∂y 2
Fig. 5. The spatial distribution of the gradient of AOD differences (1AOD) between the MODIS and MISR aerosol products. The1AOD was computed by subtracting MODIS DT/MODIS DB (0.55 µm) AOD from MISR AOD (0.558 µm). Only land regions that have reported AOD larger than 0.1 from both products were used for computing the gradient. Over-plotted on top of the gradient map is the AERONET density map. For AERONET observation density, for every one by one degree grid, one AERONET site that has observation for a month during the 1993–2009 periods is counted as one. Regions that have index of 0–12, 12–60, and above 60 are considered poorly, normal, well observed area for red, yellow and green, respectively. Oceans are plotted in grey. (a) for MODIS DT and (b) for MODIS DB.
1AOD gradient shows the spatial variation of uncertainties in satellite aerosol products. Regions with small1AOD gra-dient values are shown in dark blue, indicating that a few AERONET sites would be sufficient to validate retrievals for the whole region. Regions with large1AOD gradient values are shown in lighter colors (such as white). These regions have large spatial variance in 1AOD, and denser
distributions of AERONET sites would help future valida-tion efforts, for example: Northern India, and western South America.
Y. Shi et al.: Application for potential AERONET deployment 2833
30
Figure 6.
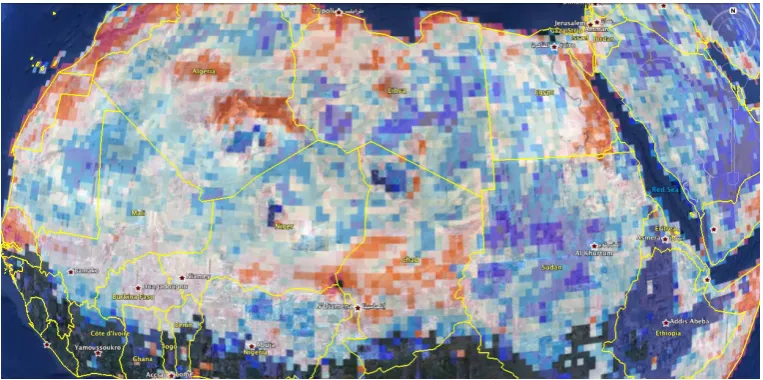
Fig. 6. Overlay of Fig. 3b on Google Earth over North Africa.
measurement during one month of the time series. If there are two AERONET sites, and each has at least one obser-vation during any one month, the index number is set to 2. We increment the index value for a given region even if only a fraction of a month has sun photometer data. For one AERONET site that provides continuous observations for a year, the index for the lat/lon grid that the AERONET site locations is set to 12. Regions with indexes of 0–12, 12–60, and above 60 (for the seventeen year period) are defined as poorly observed (red), normal (yellow), and well observed (green) regions respectively. Figure 5 includes four by four (4×4) degree averages, which were developed from the one by one (1×1) degree averages, by picking the largest index value of any 1×1 degree box inside the 4×4 degree grid to highlight the signal. Since only regions with AOD values larger than 0.1 from both satellite products were used in cre-ating Fig. 5, it is necessary to compare Fig. 5 with the AOD ratio/difference plot (Fig. 3) that includes all scenarios. Two regions that are not included in Fig. 5, but are highlighted in Fig. 3, are the Andes mountains and the West Coast of the US. Again, both regions have complex surface characteris-tics that can create problems for space-borne satellite aerosol retrievals.
Figure 5 shows that Europe and the West and East Coasts of US are well covered with sun photometer observations. However, it is still useful to identify regions for future AERONET sites for three scenarios: (1) type A region: regions where it is suspected that aerosol optical prop-erty assumptions are poor in satellite retrievals; (2) type B region: regions with moderate to high AOD and lack of AERONET sites; (3) type C region: any sites in large re-gions of the earth that have no or few sites. Based on Fig. 5, type A regions include Central Africa and Northwest-ern South America. Type B regions include the Middle East, the high latitude Asian part of Russia, Central Asia, Western
India, and especially the Malaysia – Indonesia region. The type C regions include Australia and Greenland. All of the previously discussed regions are highlighted with red boxes in Fig. 5.
Lastly, based on the discussions from this section, we identified regions that require better surface boundary con-ditions: (1) Central Asia; (2) Malaysia – Indonesia (3) Cen-tral Africa, near Zaire; (4) the CenCen-tral Sahara; (5) the Eastern Arabian Peninsula; (6) Greenland and Australia, where no long-term monitoring effort is present for a large area. The Malaysia – Indonesia region is also highlighted in this study, yet we expect new sites to be established for the 7-SEAS and SEAC4RS field campaigns; some of these sites will likely remain as long-term sites. AERONET data from the United Arab Emirates (UAE) could be used to study retrieval related issues over the Eastern Arabian Peninsula. Also, large dis-crepancies are found over the high-latitude southern ocean that invite further experiments in order to understand the cause of the high AOD band over this area. This question has been at least partially addressed by the ship based sun photometer measurements from the Maritime Aerosol Net-work (MAN netNet-work) (Smirnov et al., 2011). The measured AOD in this region is very low.
5 Discussion: community effort
The purpose of this paper is not simply to point to areas of diverging AOD products, but rather to inform the larger sci-entific community that there are likely regions where local measurements can be made to maximize the benefit for re-trieval development. Regional measurements of aerosol or lower boundary condition properties, even over short field studies, could have significant value when measurements are made in poorly observed regions.
To this end, as part of the Supplement of this paper, we provide our annual data as well as seasonal breakouts for community use. These are provided in KML format. In-deed, even when using the simple overlay tools in KML in Google Earth, hotspots of divergence can be seen related to land surface features (e.g., Fig. 6).
6 Summary and conclusions
Using spatially and temporally collocated MODIS and MISR aerosol optical depth retrievals, we examined the spatial dif-ference between the operational MODIS and MISR aerosol products. Differences are indicative of the spatially corre-lated biases, which are highly detrimental to higher order data analysis methods such as data assimilation and inverse modeling. The spatial comparisons of the two collocated aerosol products reveal regions that need further improve-ments in future satellite studies. For the first time, our analysis identified the regions that would most benefit from long-term point measurements and field campaigns for future satellite aerosol studies. The key results from our study are:
1. The ratio of MODIS to MISR AOD is much larger than 1 for the Western US, South America, East and Central Asia, and Indonesia. Regions where the ratio is sig-nificantly less than 1 were found over the East Coast of South Africa, the East Coast of South America, the Arabian Peninsula, and Western Australia. Note that the ratio in regions of low AOD is not necessarily a good measure of whether errors are significant, as indicated by the AOD difference plot from Fig. 3c and d.
2. A closer look at the comparisons between MODIS DT and MISR data shows that over the Western US, the An-des mountains, and Russia, high AOD “features,” which are only visible from the MODIS DT aerosol product, are possibly due to the surface-reflectivity-introduced bias. Also, over South America, China, and the In-donesia regions, MODIS DT tends to overestimate, and MISR tends to underestimate AOD values, due, in part, to differences in the aerosol optical properties used in the MODIS DT and MISR AOD retrievals. Some of these observations support the results of previous stud-ies, in which some causes are also identified (Kahn et al., 2009, 2010; Levy et al., 2010).
3. This study also identifies the locations where additional ground based and in situ measurements would have the greatest impact on improving satellite aerosol retrievals. Adding more AERONET sites in and of themselves will not resolve the discrepancies among satellite products. How-ever, if AERONET data is used properly, it will help developers and data users alike understand the true nature of uncertainty in important regions of the globe. Already, AERONET data are being used as a golden standard to val-idate most, if not all, satellite aerosol products, especially AOD. We show that the performance of the satellite prod-ucts could be dramatically different from their performance over the AERONET sites (sampling bias of the AERONET network). This study identifies regions where large discrep-ancies are found among satellite products and where no cov-erage exists from existing AERONET sites. What we now have is an estimate of diversity among commonly used prod-ucts, but little information about true uncertainty in any of the products. We hope this study will aid in future decisions of constructing ground based and in situ aerosol observing network stations.
In the Supplement to this paper, a KML file is provided. We hope these can be useful to the scientific community in order to develop priorities for enhanced sampling by sun pho-tometers or regional in situ studies.
Supplementary material related to this article is available online at:
http://www.atmos-meas-tech.net/4/2823/2011/ amt-4-2823-2011-supplement.zip.
Acknowledgements. This research was funded by the Office of Naval Research Code 322, the Office of Naval Research Young Investigator Program, and the NASA Interdisciplinary Science Program. We acknowledge and appreciate the AERONET program and their contributing principal investigators, as well as their staff for establishing and maintaining the sites used in this investigation. We would like to thank Christina Hsu for her thoughtful comments and suggestions. We also thank Michael Garay, Mike Mishchenko and other five anonymous reviewers for their suggestions.
Edited by: A. Kokhanovsky
References
Abdou, W. A., Diner, D. J., Martonchik, J. V., Bruegge, C. J., Kahn, R. A., Gaitley, B. J., Crean, K. A., Remer, L. A., and Holben, B.: Comparison of coincident MISR and MODIS aerosol optical depths over land and ocean scenes containing AERONET sites, J. Geophys. Res., 110, D10S07, doi:10.1029/2004JD004693, 2005.
Diner, D. J., Abdou, W. A., Bruegge, C. J., Conel, J. E., Crean, K. A., Baitley, B. J., Helmlinger, M. C., Kahn, R. A., Martonchik, J. V., Pilorz, S. H., and Holben, B. N.: MISR aerosol optical depth retrievals over southern Africa during the SAFARI-2000 dry season campaign, Geophys. Res. Lett., 28, 3127–3130, 2001. Diner, D. J., Beckert, J. C., Bothwell, G. W., and Rodriguez, J. I.: Performance of the MISR instrument during its first 20 months in earth orbit, IEEE T. Geosci. Remote Sens., 40, 1449–1466, 2002.
Eck, T. F., Holben, B. N., Reid, J. S., Dubovik, O., Smirnov, A., O’Neill, N. T., Slutsker, I., and Kinne, S.: Wavelength depen-dence of the optical depth of biomass burning, urban, and desert dust aerosol, J. Geophys. Res., 104, 31333–31349, 1999. Eck, T. F., Holben, B. N., Dubovik, O., Smirnov, A., Goloub, P.,
Chen, H. B., Chatenet, B., Gomes, L., Zhang, X.-Y., Tsay, S.-C., Ji, Q., Giles, D., and Slutsker, I.: Columnar aerosol opti-cal properties at AERONET sites in central eastern Asia and aerosol transport to the tropical mid-Pacific, J. Geophys. Res., 110, D06202, doi:10.1029/2004JD005274, 2005.
Eck, T. F., Holben, B. N., Sinyuk, A., Pinker, R. T., Goloub, P., Chen, H., Chatenet, B., Li, Z., Singh, R. P., Tripathi, S. N., Reid, J. S., Giles, D. M., Dubovik, O., O’Neill, N. T., Smirnov, A., Wang, P., and Xia, X.: Climatological aspects of the optical prop-erties of fine/coarse mode aerosol mixtures, J. Geophys. Res., 115, D19205, doi:10.1029/2010JD014002, 2010.
Holben, B. N., Eck, T. F., Slutsker, I., Tanre, D., Buis, J. P., Set-zer, A., Vermote, E., Reagan, J. A., Kaufman, Y. J., Nakajima, T., Lavenu, F., Jankowiak, I., and Smirnov, A.: AERONET – A Federated Instrument Network and Data Archive for Aerosol Characterization, Remote Sens. Environ., 66, 1–16, ISSN 0034-4257, doi:10.1016/S0034-4257(98)00031-5, 1998.
Hsu, N. C., Tsay, S. C., King, M. D., and Herman, J. R.: Deep blue retrievals of Asian aerosol properties during ACE-Asia, IEEE T. Geosci. Remote Sens., 44, 3180–3195, 2006.
Husar, R. B., Prospero, J. M., and Stowe, L. L.: Charac-terization of tropospheric aerosols over the oceans with the NOAA advanced very high resolution radiometer optical thick-ness operational product, J. Geophys. Res., 102, 16889–16909, doi:10.1029/96JD04009, 1997.
Hyer, E. J., Reid, J. S., and Zhang, J.: An over-land aerosol opti-cal depth data set for data assimilation by filtering, correction, and aggregation of MODIS Collection 5 optical depth retrievals, Atmos. Meas. Tech., 4, 379–408, doi:10.5194/amt-4-379-2011, 2011.
Kahn, R. A., Gaitley, A., B., Martonchik, J., Diner, D., Crean, K., and Holben, B. N.: MISR global aerosol optical depth valida-tion based on two years of coincident AERONET observavalida-tions. J. Geophys. Res., 110, D10S04, doi:10.1029/2004JD004706, 2005.
Kahn, R. A., Garay, M. J., Nelson, D. L., Yau, K. K., Bull, M. A., Gaitley, B. J., Martonchik, J. V., and Levy, R. C.: Satellite-derived aerosol optical depth over dark water from MISR and MODIS: Comparisons with AERONET and implica-tions for climatological studies, J. Geophys. Res., 112, D18205, doi:10.1029/2006JD008175, 2007.
Kahn, R. A., Nelson, D. L., Garay, M., Levy, R. C., Bull, M. A., Martonchik, J. V., Diner, D. J., Paradise, S. R., Wu, D. L., Hansen, E. G., and Remer, L. A.: MISR Aerosol prod-uct attributes, and statistical comparisons with MODIS. IEEE T.
Geosci. Remote Sens., 47, 4095–4114, 2009.
Kahn, R. A., Gaitley, B. J., Garay, M. J., Diner, D. J., Eck, T. F., Smirnov, A., and Holbem, B. N.: Multiangle Imaging Spec-troRadiometer global aerosol product assessment by comparison with Aerosol Robotic Network, J. Geophys. Res., 115, D23209, doi:10.1029/2010JD014601, 2010.
Kahn, R. A., Garay, M. J., Nelson, D. L., Levy, R. C., Bull, M. A., Diner, D. J., Mar- tonchik, J. V., Hansen, E. G., Remer, L. A., and Tanre`ı, D.: Response to “Toward unified satellite climatology of aerosol properties. 3. MODIS versus MISR versus AERONET”, J. Quant. Spectrosc. Rad. Transf., 112, 901–909, 2011.
Kaufman, Y. J., Tanre `I, D., and Boucher, O.: A satellite view of aerosols in the climate system, Nature, 419, 215–223, 2002. Levy, R. C., Remer, L. A., Kleidman, R. G., Mattoo, S., Ichoku,
C., Kahn, R., and Eck, T. F.: Global evaluation of the Collection 5 MODIS dark-target aerosol products over land, Atmos. Chem. Phys., 10, 10399–10420, doi:10.5194/acp-10-10399-2010, 2010. Liu, L. and Mishchenko, M. I.: Toward unified satellite climatol-ogy of aerosol properties: direct comparisons of advanced level 2 aerosol products. J. Quant. Spectrosc. Rad. Transf., 109, 2376– 2385, 2008.
Liu, Y., Koutrakis, P., Kahn, R., Turquety, S., and Yantosca, R. M.: Estimating fine particulate matter component concentrations and size distributions using satellite-retrieved fractional aerosol opti-cal depth: Part 2 – A case study, J. Air Waste Manage. Assoc., 57, 1360–1369, 2007.
Martonchik, J. V., Diner, D. J., Kahn, R., Gaitley, B., and Hol-ben, B. N.: Comparison of MISR and AERONET aerosol op-tical depths over desert sites, Geophys. Res. Lett., 31, L16102, doi:10.1029/2004GL019807, 2004.
Mishchenko, M. I., Geogdzhayev, I. V., Cairns, B., Carlson, B. E., Chowdhary, J., Lacis, A. A., Liu, L., Rossow, W. B., and Travis, L. D.: Past, present, and future of global aerosol climatologies derived from satellite observations: a perspective. J. Quant. Spec-trosc. Radiat. Transfer, 106, 325–347, 2007.
Mishchenko, M. I., Geogdzhayev, I. V., Liu, L., Lacis, A. A., Cairns, B., and Travis, L. D.: Toward unified satellite climatol-ogy of aerosol properties: what do fully compatible MODIS and MISR aerosol pixels tell us?, J. Quant. Spectrosc. Radiat. Trans-fer, 110, 402–408, 2009.
Myhre, G., Stordal, F., Johnsrud, M., Ignatov, A., Mishchenko, M. I., Geogdzhayev, I. V., Tanr´e, D., Deuz´e, J. L., Goloub, P., Naka-jima, T., Higurashi, A., Torres, O., and Holben, B.: Intercompar-ison of satellite retrieved aerosol optical depth over the ocean, J. Atmos. Sci., 61, 499–513, 2004.
Reid, J. S., Hobbs, P. V., Ferek, R. J., Blake, D. R., Martins, J. V., Dunlap, M. R., and Liousse, C.: Physical, chemical, and opti-cal properties of regional hazes dominated by smoke in Brazil, J. Geophys. Res., 103, 32059–32080, doi:10.1029/98JD00458, 1998.
Reid, J. S., Eck, T. F., Christopher, S. A., Koppmann, R., Dubovik, O., Eleuterio, D. P., Holben, B. N., Reid, E. A., and Zhang, J.: A review of biomass burning emissions part III: intensive optical properties of biomass burning particles, Atmos. Chem. Phys., 5, 827–849, doi:10.5194/acp-5-827-2005, 2005.
and lessons from the fire locating and modeling of burning emis-sions (FLAMBE) program, IEEE J. Sel. Top. Appl., JSTARS-2009-00034, 2009.
Remer, L. A., Kaufman, Y. J., Tanre, D., Mattoo, S., Chu, D. A., Martins, J. V., Li, R. R., Ichoku, C., Levy, R. C., Kleidman, R. G., Eck, T. F., Vermote, E., and Holben, B. N., The MODIS aerosol algorithm, products and validation, J. Atmos. Sci., 62, 947–973, 2005.
Remer, L. A., Chin, M., DeCola, P., Feingold, G., Halthore, R., Kahn, R. A., Quinn, P. K., Rind, D., Schwartz, S. E., Streets, D., and Yu, H.: Executive summary, atmospheric aerosol properties and climate impacts. A report by the U.S. climate change sci-ence program and the subcommittee on global change research, edited by: Chin, M., Kahn, R. A., and Schwartz, S. E., National Aeronautics and Space Administration, Washington, D.C., USA, 2009.
Shi, Y.: Development of data-assimilation-quality MODIS and MISR over ocean aerosol products, University of North Dakota, Thesis of M.S., 2009.
Shi, Y., Zhang, J., Reid, J. S., Hyer, E. J., and Kalashnikova, O.: Evaluation of MISR aerosol optical depth product for aerosol data assimilation and multi-sensor data fusion. The 2009 Ameri-can Geophysical Union Fall Meeting, San Francisco, CA, 14–18 December, 2009.
Shi, Y., Zhang, J., Reid, J. S., Holben, B. N., Hyer, E. J., and Curtis, C.: An analysis of the collection 5 MODIS over-ocean aerosol optical depth product for its implication in aerosol as-similation, Atmos. Chem. Phys., 11, 557–565, doi:10.5194/acp-11-557-2011, 2011.
Smirnov, A., Holben, B. N., Giles, D. M., Slutsker, I., O’Neill, N. T., Eck, T. F., Macke, A., Croot, P., Courcoux, Y., Sakerin, S. M., Smyth, T. J., Zielinski, T., Zibordi, G., Goes, J. I., Harvey, M. J., Quinn, P. K., Nelson, N. B., Radionov, V. F., Duarte, C. M., Losno, R., Sciare, J., Voss, K. J., Kinne, S., Nalli, N. R., Joseph, E., Krishna Moorthy, K., Covert, D. S., Gulev, S. K., Milinevsky, G., Larouche, P., Belanger, S., Horne, E., Chin, M., Remer, L. A., Kahn, R. A., Reid, J. S., Schulz, M., Heald, C. L., Zhang, J., Lapina, K., Kleidman, R. G., Griesfeller, J., Gaitley, B. J., Tan, Q., and Diehl, T. L.: Maritime aerosol network as a component of AERONET - first results and comparison with global aerosol models and satellite retrievals, Atmos. Meas. Tech., 4, 583–597, doi:10.5194/amt-4-583-2011, 2011.
Spiegel, M. R. and Stephens, L. J.: Theory and Problems of Statis-tics 3rd edition, McGraw-Hill, 1999.
van Donkelaar, A., Martin, R. V., and Park R. J.: Estimat-ing ground-level PM2.5 usEstimat-ing aerosol optical depth determined from satellite remote sensing, J. Geophys. Res., 111, D21201, doi:10.1029/2005JD006996, 2006.
van Donkelaar, A., Martin, R. V., Brauer, M., Kahn, R., Levy, R., Verduzco, C., and Villeneuve, P. J.: Global estimates of am-bient fine particulate matter concentrations from satellite-based aerosol optical depth: Development and application, Environ. Health Perspect., 118, 847–855, 2010.
Zhang, J. and Reid, J. S.: MODIS Aerosol Product Analysis for Data Assimilation: Assessment of Level 2 Aerosol Optical Thickness Retrievals, J. Geophys. Res.-Atmos., 111, D22207, doi:10.1029/2005JD006898, 2006.
Zhang, J., Christopher, S. A., and Holben, B. N.: Intercomparison of aerosol optical thickness derived from GOES-8 Imager and Ground-Based Sun Photometers, J. Geophys. Res.-Atmos., 106, 7387–7398, 2001.
Zhang, J., Reid, J. S., and Holben, B. N.: An analysis of potential cloud artifacts in MODIS over ocean aerosol op-tical thickness products, Geophys. Res. Lett., 32, L15803, doi:10.1029/2005GL023254, 2005.
Zhang, J., Reid, J. S., Turk, J., and Miller, S.: Strategy for study-ing nocturnal aerosol optical depth usstudy-ing artificial lights, Int. J. Remote Sens., 29, 4599–4613, 2008a.
Zhang, J., Reid, J. S., Westphal, D. L., Baker, N. L., and Hyer, E. J.: A system for operational aerosol optical depth data as-similation over global oceans, J. Geophys. Res., 113,D10208, doi:10.1029/2007JD009065, 2008b.
Zhang, J. and Reid, J. S.: An analysis of clear sky and contextual biases using an operational over ocean MODIS aerosol product, Geophys. Res. Lett., 36, L15824, doi:10.1029/2009GL038723, 2009.