R E S E A R C H
Open Access
Toward the precision breast cancer survival
prediction utilizing combined whole
genome-wide expression and somatic
mutation analysis
Yifan Zhang
1, William Yang
2, Dan Li
1, Jack Y Yang
1, Renchu Guan
1and Mary Qu Yang
1*FromSelected articles from the IEEE BIBM International Conference on Bioinformatics & Biomedicine (BIBM) 2017: medical genomics
Kansas City, MO, USA. 13-16 November 2017
Abstract
Background:Breast cancer is the most common type of invasive cancer in woman. It accounts for approximately
18% of all cancer deaths worldwide. It is well known that somatic mutation plays an essential role in cancer development. Hence, we propose that a prognostic prediction model that integrates somatic mutations with gene expression can improve survival prediction for cancer patients and also be able to reveal the genetic mutations associated with survival.
Method:Differential expression analysis was used to identify breast cancer related genes. Genetic algorithm (GA)
and univariate Cox regression analysis were applied to filter out survival related genes. DAVID was used for enrichment analysis on somatic mutated gene set. The performance of survival predictors were assessed by Cox regression model and concordance index(C-index).
Results:We investigated the genome-wide gene expression profile and somatic mutations of 1091 breast invasive
carcinoma cases from The Cancer Genome Atlas (TCGA). We identified 118 genes with high hazard ratios as breast cancer survival risk gene candidates (log rankp< 0.0001 and c-index = 0.636). Multiple breast cancer survival related genes were found in this gene set, includingFOXR2,FOXD1,MTNR1BandSDC1. Further genetic algorithm (GA) revealed an optimal gene set consisted of 88 genes with higher c-index (log rankp< 0.0001 and c-index = 0. 656). We validated this gene set on an independent breast cancer data set and achieved a similar performance (log rankp< 0.0001 and c-index = 0.614). Moreover, we revealed 25 functional annotations, 15 gene ontology terms and 14 pathways that were significantly enriched in the genes that showed distinct mutation patterns in the different survival risk groups. These functional gene sets were used as new features for the survival prediction model. In particular, our results suggested that the Fanconi anemia pathway had an important role in breast cancer prognosis.
(Continued on next page)
* Correspondence:[email protected]
1MidSouth Bioinformatics Center and Joint Bioinformatics Ph.D. Program of
University of Arkansas at Little Rock and Univ. of Arkansas Medical Sciences, 2801 S. Univ. Ave, Little Rock 72204, USA
Full list of author information is available at the end of the article
(Continued from previous page)
Conclusions:Our study indicated that the expression levels of the gene signatures remain the effective indicators
for breast cancer survival prediction. Combining the gene expression information with other types of features derived from somatic mutations can further improve the performance of survival prediction. The pathways that were associated with survival risk suggested by our study can be further investigated for improving cancer patient survival.
Keywords:Breast Cancer, Somatic mutations, Whole genome-wide expression, Survival analysis, Precision survival
prediction
Background
Breast cancer is the most commonly occurring female cancer in developed countries. Over 40,000 breast can-cer deaths and approximately 250,000 new cases were reported in 2016 [1]. The survival rate in HER2+ breast cancer patients [2] has been remarkably increased through targeted therapies including tyrosine kinase in-hibitors. Adjuvant treatments such as chemotherapy also improved the 5-year survival rate of the breast patients [3,4]. However, the significant side effects of chemother-apy can shorten the lifespan of cancer patients in some cases [5]. Additionally, due to potential metastasis and invasion of cancer, the overall outcome for breast cancer patients remains bleak. An effective survival predictor, which is capable of helping cancer treatment and fore-seeing the clinical outcomes, can improve life quality and lifespan of cancer patients. Thus, better prognostic biomarkers of survival risk prediction are needed.
In clinical practice, clinicopathological prognostic indi-cators, such as tumor size, lymph node (LN) status and pathological grade [6, 7] have been widely used in prog-nostic analysis models. However, in some cases, the treat-ment responses vary greatly even with similar prognoses. Recently, single cell genomics analysis have shown that os-tensibly similar tumor defined by traditional pathological analysis could be distinct diseases at the cell levels [8–10]. Due to the highly heterogeneous nature of cancer cells, the predictive ability of some traditional indicators can be less effective for over 50% of patients [11].
Multiple survival analysis models have developed mainly based on gene expression profiles. The cox regression model and machine learning algorithms have been widely used to reveal molecular signatures related to survival. Bair et al. [12] used semi-supervised methods to cluster patients with different survival risk based on gene expres-sion profiles and clinical data. Sun et al. [13] applied uni-variate Cox regression analysis and identified nine long noncoding RNAs (lncRNAs) that were highly associated with their metastasis-free survival for breast cancer pa-tients. Zhang et al. [14] developed a two-stage method, using Bayesian hierarchical Cox model and the penalized Cox model, and incorporated pathway information with gene expression profiles to predict survival.
Most survival prediction methods mainly utilize gene expression profiles. Somatic mutations are involved in the cancer development [15]. Several studies showed that genetic mutations are associated with cancer sur-vival, such as BRCA1- and BRCA2-related mutations, and HER2 somatic mutations [16, 17]. Thus, identifying survival related mutations are meaningful for prognosis and treatment. However, it is difficult to detect mutation patterns in a patient cohort for survival analysis since most commonly mutated genes are found in less than 10% of patients. Consequently, using common mutations alone to predict survival is less effective. To address this issue, we integrated somatic mutations with pathway, function annotation and gene ontology (GO) analysis. We then synergistically used the significantly mutated gene sets as predictors coupled with gene expression for survival analysis. Our results suggested that combining somatic mutations improved the performance of survival risk prediction.
Results
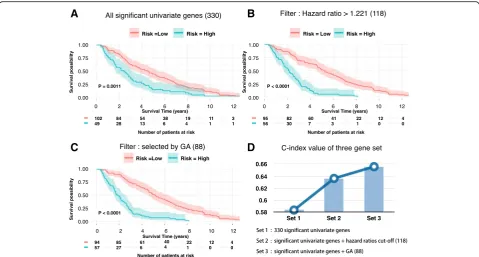
Gene differential expression and survival risk detection
Out of the 330 genes, we further selected 118 genes with hazard ratio > 1.221. The resulting new prediction model yielded a higher C-index, 0.636.(P-value < 0.001). Accord-ing to Kaplan–Meier curve (Fig. 1b), the survival rate of 1500 days (4 years and 1 month) was 63.2% and 12.5% for patients in the low risk group and high risk group, re-spectively (Fig. 1b). The 118 genes contained several well-known breast cancer survival related genes or onco-genes, including FOXR2, FOXD1, MTNR1B and SDC1
[18–24]. Additionally, PANTHER [25] pathway analysis revealed 17 biological processes that were significantly enriched in the 118 genes (Additional file 1). Some are known biological process related to cancer, such as: DNA replication (P-value = 0.037), structural molecule activity (P-value = 0.00035), system development (P-value =0.00047), and cytoskeleton (P-value 0.000062) [26–28], while some others have not been well studied (Additional file1), such as peptide cross-linking (P-value=0.00027).
Survival-related genes selected by genetic algorithm
We developed a genetic algorithm (GA)-based method to further optimize gene selection from original 330 sig-nificant univariate genes. The method is able to as-sess the combinatorial effects of multiple genes on survival. As a result, 88 genes were revealed as the opti-mal gene set which maximized the C-index. Using this gene set, we conducted survival analysis (Fig. 1c) and achieved a better c-index 0.656 compared to 0.636 yielded by the model constructed based on the 118
genes selected by hazard ratio. We found that 67 of 88 (75.3%) genes were overlapped with the 118-gene set. Hence, hazard ratio from the univariate test may not be the only factor that determines the prediction accuracy. Nevertheless, genes with higher hazard ratio tend to have higher possibility to generate more accurate sur-vival prediction. (Fig.2a).
We obtained an independent data set from Molecular Taxonomy of Breast Cancer International Consortium (METABRIC) [29] to validate our models. This dataset includes the expression profile and clinical data for 2509 breast cancer tissue samples. We found 61 genes in the 88-gene set and 64 genes in the 118-gene set shown in the expression profile of this patient cohort. Similar data normalization and survival analysis were performed. The models based on both gene sets were able to separate the high-risk and low-risk survival groups (P-value < 0.0001, Fig. 2b and Additional file 2). The C-index was 0.614 and 0.6004 for the models based on 61 GA-selected genes and 64 hazard-ratio-selected genes, respectively. Consistent with the result for the TCGA dataset, the gene set that was identified by GA searching yielded higher prediction accuracy.
Survival-related somatic mutations
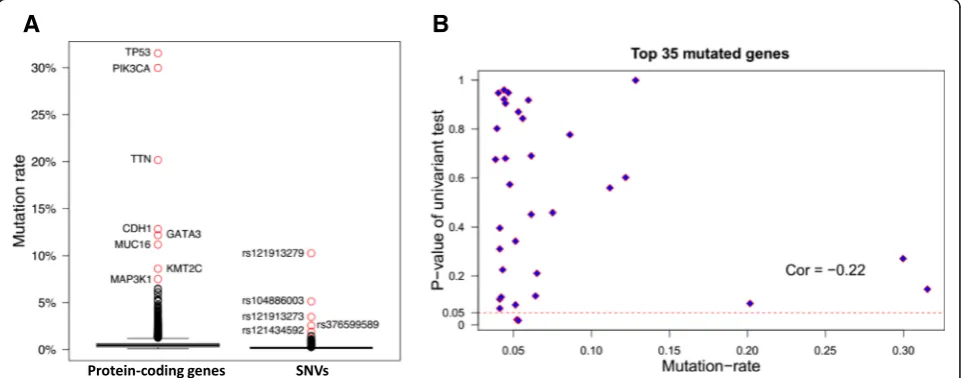
A total of 105,425 single-nucleotide variances (SNVs) were identified in 1044 breast cancer patient samples (1044 of 1091 patients have mutation data). The max-imum and median SNV mutation rate was 10.4% and
A
B
C
D
0.095%, respectively (Fig. 3a), while the maximum and median gene mutation rate was 32.95% and 0.48%, re-spectively. rs121913279 was the most frequent SNP, which was located at the PIK3CA gene. TP53, PIK3CA,
TTN, CDH1, GATA3, MUC16, KMT2C and MAP3K1
were the top frequently mutated genes (Fig. 3a). The gene pairs consisting of these eight genes have differen-tial mutation patterns, four pairs tend to mutual exclu-sively, while six pairs tend to be co-occurred (P-adjust <= 0.008) (Table1). The C-index andP-value of the sur-vival model based on these eight top mutated genes were 0.539 and 0.085. We expanded the mutated gene list to 88, 118, 330, which matched the number of differential genes used in the survival models. The resulting c-index for these different gene signature set was 0.565, 0.522
and 0.567, and corresponding P-value was 0.035, 0.23 and 0.028. Thus, the top mutated genes were not neces-sarily effective gene signatures for survival prediction; the correlation coefficient of gene mutation rates and P-values of the univariate tests was−0.22 (Fig.3b).
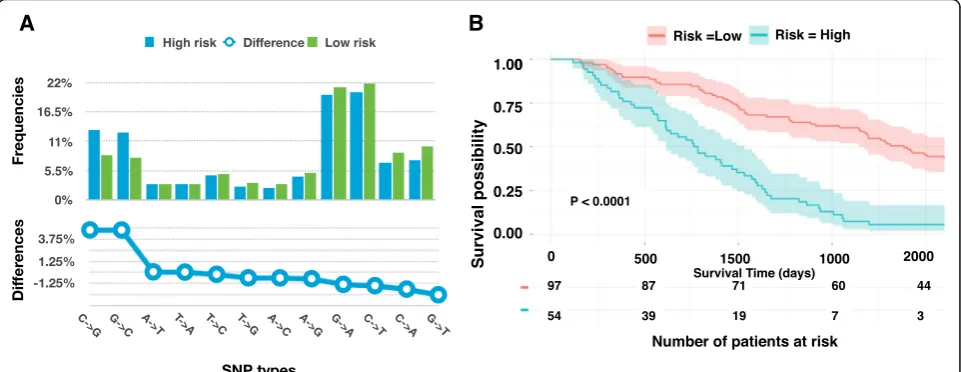
To combine gene expression and mutation for survival analysis, we first clustered the breast cancer patients into two groups (high survival risk and low survival risk) based on the expression levels of 118 genes. Then we analyzed the corresponding somatic mutation profiles for the pa-tients in the distinct groups. We found that 48,404 and 57,024 SNVs were found for the patients in the high-risk group and the low risk group, respectively.
We compared the percentage of different types of SNVs in the two groups (Fig. 4a). The C- > G and G- > C SNVs
Total Selected by GA
Hazard ratios
2.0
1.5
1.0
0.5
0.0
Risk = High Risk = Low 1.00
0.75
0.50
0.25
0.00
0 2 4 6 8 10 12 14 16 18 20 Survival Time (years)
Number of patients at risk
Survival possibility
708 1196
642 1117
551 982
472 861
381 750
288 620
218 512
167 410
114 311
76 216
37 135 P < 0.0001
A
B
Fig. 2The hazard ratio values and the Kaplan–Meier estimator for an independent patient dataset.aThe hazard ratios of 330 significant univariate genes (yellow) and 88 genes (blue) selected by GA.bThe Kaplan–Meier curve using 61 of 88 GA selected genes for a METABRIC breast cancer patient dataset
A
B
frequencies in the high-risk group were significantly higher than these SNVs (13.1% versus 8.31%, 12.6% versus 7.82%) in the low risk group (t-test, P-value = 5.5e-14, P-value = 1.3e-14). We thus used C- > G and G- > C SNP frequencies as the two features to perform survival ana-lysis. The survival risk curves showed a noticeable yet in-significant difference ( P-value= 0.36). Combining the 118 gene expression with C- > G and G- > C SNP frequencies, we conduct another survival analysis. We obtained similar prediction accuracy as using the gene expression alone (Fig. 4b). Our results suggested that GC SNV fre-quencies were weaker features for survival prediction.
We also calculated the mutation rates of all genes in the high-risk and low-risk groups. The mutation rate here refers to the percentage of the patients who har-bored somatic mutation(s) in a specific gene in the pa-tient group. Then we computed the mutation rate differential scores (MRDS)(Method) for each individual genes.
Some genes showed quite distinct mutation rates in the different groups. For example, the mutation rates of
TP53 in the high and low risk group were 0.634 and 0.208, respectively. We selected the top 2000 genes ranked by MRDS. Multiples genes in this list present in breast cancer related pathways. For example,ATM, ATR, TP53, PTEN, CASP8, and IGFBP3participate in p53 sig-nal pathway, while MMP, EGFR, CREP, PLC, and RAS
participate in estrogen signaling pathway.
Based on DAVID analysis [30, 31], we identified 30 pathways, 114 functional annotations and 38 Gene Ontology (GO) terms that were significantly enriched of the 2000 mutated genes (P-value < 0.05). We then build new features using these molecular function gene sets. If a patient carried mutation(s) in at least one gene of indi-vidual enriched function gene sets, we set the corre-sponding feature value as 1; otherwise we set the value as 0. Then we performed a univariate Cox regression analysis for each of new features. As a result, we
Table 1The top mutated genes in the TCGA 1044 breast cancer dataset
Gene A Gene B A Not B B Not A Both Log Odds Ratio Adjustedp-Value Tendency
TP53 CDH1 338 125 9 −2.067 < 0.001 Mutual exclusivity
TP53 GATA3 336 116 11 −1.771 < 0.001 Mutual exclusivity
TP53 MAP3K1 336 79 11 −1.327 < 0.001 Mutual exclusivity
TP53 PIK3CA 265 266 82 −0.641 < 0.001 Mutual exclusivity
PIK3CA CDH1 284 70 64 0.735 0.002 Co-occurrence
TP53 TTN 264 104 83 0.62 0.004 Co-occurrence
PIK3CA KMT2C 296 55 52 0.75 0.006 Co-occurrence
TTN KMT2C 154 74 33 0.846 0.007 Co-occurrence
PIK3CA MAP3K1 303 45 45 0.798 0.008 Co-occurrence
TTN MUC16 146 68 41 1.209 < 0.001 Co-occurrence
A
B
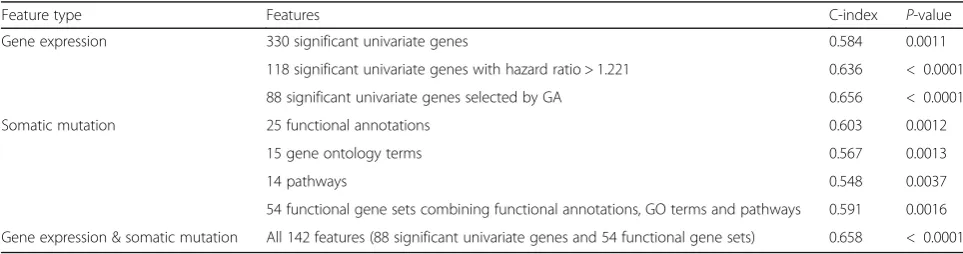
identified 15 function annotations (FA), 15 GO terms and 14 pathways that were significant in the univariate test (P-value < 0.05 and hazard ratio > 1.221). Using a total of 54 mutated functional gene set, the C-index survival model was 0.591 (P-value = 0.0016). The C-index of the models that utilized different type of gene set (Table 2) showed that integrating gene expression and mutation analysis generated a survival model with better accuracy (Table2) (Fig.4b).
Discussion
The gene signatures derived from expression profiles have commonly been used in survival analysis [18–21,24]. The survival-related genes are often selected through the uni-variate regression model. The resulting P-value and/or hazard ratio were used as criteria for gene selection. How-ever, the gene list composed of the gene selected from the univariate tests may not be necessary the optimal gene set for the survival prediction. To address this limitation, we employed a GA searching algorithm to optimize gene set selection for accurate survival prediction. The GA search-ing enables the assessment of the combinatorial effect of a gene set on the survival analysis. As expected, we identi-fied a set of genes that yielded higher prediction accuracy than the gene list obtained from the univariate regression model. In this study, the GA only searched for the best gene combination of 330 univariate genes, which was the length of initial chromosome. The pre-filtered gene candi-date set can reduce the searching space of the GA algo-rithm and save the computation time, however, the optimal gene set could be overlooked by this strategy.
The cancer survival analysis merely using the gene ex-pression levels shows the limited ability for accurate sur-vival risk prediction [32]. The genetic mutations have an important role in cancer development. Hence, the gen-etic mutation profiles can provide additional values for survival analysis and lead to uncover genetic variations that are associated with patient survival [27]. We found that the most frequently mutated genes were not neces-sarily significant in survival analysis. The correlation co-efficient of the top eight mutated genes and theP-values
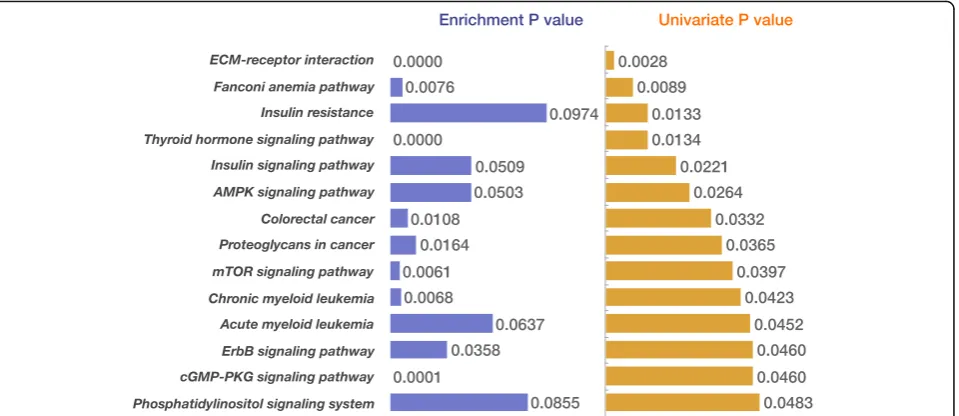
from the univariate regression model is −0.22 in the breast cancer dataset that we studied. The mutated genes selected by the univariate regression test often re-sulted in very unbalanced survival risked groups (Add-itional file 3). In addition, it is commonly known that the drive gene mutations in a pathway tend to be mutu-ally exclusive. Here, we proposed a system biology method: first projected the somatic mutations onto the pathways and gene function sets, then used significantly mutated pathways or function gene sets as additional signatures for survival analysis. For example, we found 14 pathways were significant abundance of the mutated genes as well as showed significance in the univariate re-gression test (Fig. 5). The mutated rates of these pathway-genes were relatively low (Additional file4).
Despite of low mutation rate of pathway-gene, they tended to be more effective for survival prediction. In the Cox univariate regression, the 14 pathways consist-ently demonstrated lowerP-values than the top mutated genes set (Additional file 5). Here, the number of top mutated genes set is the same as the number of mutated genes in the corresponding pathways. We also per-formed multivariate regression test. In the multivariate test, each individual mutated gene in the pathways or the top mutated genes was considered a feature. We found most pathway-genes tend to have high P-value than the individual top mutated genes, excepting the Fanconi anemia pathway and ECM-receptor interaction pathways. Specially, the Fanconi anemia pathway performed well in both univariate regression and multivariate regression models (Additional file5), suggest this pathway has an es-sential role in the breast cancer survival.
In this study, we integrated somatic mutations with gene expression in our survival analysis and built an proved model for survival risk prediction. Further im-provement could be achieved when several related issues are solved. First, previous studies showed that somatic mutation identification remains inaccurate [33, 34]. The mutations identified by different mutation callers often have relatively low overlap. Better mutation caller can po-tentially improve survival prediction accuracy. Second,
Table 2C-index of the Cox proportional hazards models based on different features
Feature type Features C-index P-value
Gene expression 330 significant univariate genes 0.584 0.0011
118 significant univariate genes with hazard ratio > 1.221 0.636 < 0.0001
88 significant univariate genes selected by GA 0.656 < 0.0001
Somatic mutation 25 functional annotations 0.603 0.0012
15 gene ontology terms 0.567 0.0013
14 pathways 0.548 0.0037
54 functional gene sets combining functional annotations, GO terms and pathways 0.591 0.0016
somatic mutations are highly heterogeneous among pa-tients. Identifying survival driver genes could be valuable for survival prediction. In addition, allele frequency, the mutation positions and the other mutation information can be further incorporated into the survival model for survival model enhancement. Unlike gene expression, the quantita-tive relationship between somatic mutation and phenotypic characteristics are unknown. With better understanding of somatic mutation roles in the patient survival, we can build a better prognosis model for survival analysis.
Conclusions
Our study suggested that expressions of genes were the ef-fective indicators for breast cancer survival prediction. By coupling with somatic mutations, we were able to improve the survival predict model, however, the improvement was marginal. Also, we found that some genes demonstrated significantly distinct mutation rates between high risk and low risk breast cancer patients. Better utilizing the muta-tion difference for cancer prognostic analysis can be fur-ther investigated.
Methods
Breast cancer datasets
We obtained RNAseq datasets including raw counts and FPKM (Fragments Per Kilobase of transcript per Mil-lion) counts from TCGA (The Cancer Genome Atlas) project. The RNAseq datasets were generated from 1091 breast tumor tissue samples. We downloaded the som-atic mutation profile generated by MuTect2 workflow, for 1044 tumor tissue samples. Out of 1044 cases in the somatic mutation file, 980 were common cases with gene expression profiles. Survival information was
obtained from the metadata for each individual cases. All TCGA datasets used in the study are publicly avail-able at the GDC Portal website ( https://portal.gdc.can-cer.gov/).
An independent breast cancer datasets including the patient clinical information and the expression profile for 2509 breast cancer patients were downloaded from
cBioportal (www.cbioportal.org/). The data was gener-ated by the Molecular Taxonomy of Breast Cancer Inter-national Consortium (METABRIC).
An R-package ‘edgeR’ was applied for differential ex-pression analysis. We used adjusted P-value lower than 0.01 and absolute log fold change larger than 2 to define significantly differentially expressed genes.
Feature selection
We first used the univariate Cox regression analysis to choose features for survival analysis. The output of the re-gression analysis includes three important statistics: statis-tical significance (p), regression coefficients (coef ) (Eq.1), and hazard ratios (HR) (Eq.2). These statistics were used to select the significant survival-related features.
coef ¼ n
P
xy
ð Þ−PxPy
ffiffiffiffiffiffiffiffiffiffiffiffiffiffiffiffiffiffiffiffiffiffiffiffiffiffiffiffiffiffiffiffiffiffiffiffiffiffiffiffiffiffiffiffiffiffiffiffiffiffiffiffiffiffiffiffiffiffiffiffiffiffiffiffiffiffiffiffi
nPx2−ðPxÞ2
nPy2−ðPyÞ2
q ð1Þ
HR¼ exp coefð Þ ð2Þ
where x and y are two vectors that represent the sur-vival time and one predictor variable. Base on C-index
statistics, we chose the thresholds P-value < 0.05 and hazard ratios > 1.221 for selecting survival-related genes.
Survival analysis
We normalized each feature gene-wisely using the follow-ing equation:
gi;j− min
j∈N gi;j
max
j∈N gi;j− minj∈N gi;j
i¼1;2;…;M ð3Þ
where gi, j represent the value of feature i in the
sample j. N is the total number patient samples and M is the total number of features. Then, we used k-means algorithm to identify high survival risk and low survival risk groups. Subsequently, each individual samples were labeled accordingly. Using R package “survival”, the Cox proportional hazards model was fitted with the data and the corresponding C-index was calculated. The R package ‘survminer’ was used to plot the Kaplan–Meier curve.
Genetic algorithm identifies survival indicators
The genetic algorithm (GA) is a heuristic method for searching the global optimum. We employed the GA to reveal a gene set that yields the best survival pre-diction accuracy. An R package “Genalg” was used for GA searching. [35]. We set the population size as 200. The chromosome is a 0/1 vector with the length of 330. Here, 330 is the total number of significant univariate genes, 1 means the corresponding gene is selected while 0 refer to the unselected gene. Mutate rate was set to 0.01. The fitness score was calculated by (1 - C-index) of each candidate gene set. The number of generation is set to 100.
Building somatic mutation and functional gene set based features
Based on the gene signatures derived from the ex-pression profiles, we divided the patients into high and low survival risk groups. Then, the somatic muta-tion profiles for patients in each group were extracted from the annotated somatic mutation file accordingly. For SNPs, we calculated and compared the percentage of various types of SNPs in the two groups. The t-test was applied to assess whether a type of SNPs demonstrated significantly different mutation rate be-tween the two survival risk groups.
For mutated genes, we compared the mutation rate of each gene (i) in the two groups. Mutation rate (R) was calculated using the number of the samples containing the mutated gene divided by the total number of samples in the individual groups. Then, we calculated a mutation rate differential score (MRDS) for each gene (Eq. 4). The top 2000 genes
with higher MRDS were selected for enrichment analysis.
MRDSi¼
Rðhigh;iÞ
Rðlow;iÞ
eRðhigh;iÞ−Rðlow;iÞ ð4Þ
The DAVID [30,31] analysis was used to identify func-tional annotation sets, gene ontology terms and path-ways that were enriched by the top differentially mutated genes.
Additional files
Additional file 1:PATHER significantly enriched terms base on 118 survival related genes. (DOCX 15 kb)
Additional file 2:The Kaplan–Meier estimator for an independent patient dataset. The survival curve base on 64 of 118 hazard-ratio-selected genes for METABRIC breast cancer patient dataset. (PDF 119 kb)
Additional file 3:The Kaplan–Meier estimator using top 35 mutated genes. The Kaplan–Meier curves using 35 mutated genes selected by the univariate regression as predictors displayed two very unbalanced survival risk groups. (PDF 15 kb)
Additional file 4:The comparison of mutation rates for top mutated genes and 14 pathway genes. The mutation rates for 15 different gene sets, including one top-35-mutated gene set and 14 pathway-based gene sets. The genes in each set were ordered by their mutation rates. (PDF 36 kb)
Additional file 5:TheP-value of the Cox univariate regression analysis using different gene sets. (A) TheP-values of the Cox univariate regression analysis for pathway-based genes (blue) and top mutated genes (orange). (B) The P-values of univariant test and multivariant test for pathway-based genes (blue and grey) and top mutated genes (orange and purple). (PDF 344 kb)
Abbreviations
C-Index:Concordance Index; GA: Genetic Algorithm; GO: Gene ontology; LN: Lymph node; LOOCV: Leave-one-out cross-validated;
METABRIC: Molecular Taxonomy of Breast Cancer International Consortium; SNPs: Single-Nucleotide Polymorphisms; TCGA: The Cancer Genome Atlas; TKIs: Tyrosine Kinase Inhibitors
Acknowledgements
This research was supported by United States National Institutes of Health (NIH) Academic Research Enhancement Award 1R15GM114739 and National Institute of General Medical Sciences (NIH/NIGMS) 5P20GM103429, and Arkansas Science and Technology Authority (ASTA) Basic Science Research 15-B-23 and 15-B-38. However, the information contained herein represents the position of the author(s) and not necessarily that of the NIH.
Funding
The publication cost of this article was funded by United States National Institutes of Health (NIH) Academic Research Enhancement Award 1R15GM114739.
Availability of data and materials
The original data set used in this paper are publicly available on GDC data portal(https://portal.gdc.cancer.gov/) and cBioPortal(http://
www.cbioportal.org/).
About this supplement
This article has been published as part ofBMC Medical Genomics Volume 11 Supplement 5, 2018: Selected articles from the IEEE BIBM International Conference on Bioinformatics & Biomedicine (BIBM) 2017: medical genomics.
Authors’contributions
MQY conceived the project. YZ and MQY designed the experiments. YZ performed the experiments and analysis. WY, DL, JY and RG participate in discussions. All authors have read and approved final manuscript.
Ethics approval and consent to participate
Not applicable.
Consent for publication
Not applicable.
Competing interests
The authors declare that they have no competing interests.
Publisher’s Note
Springer Nature remains neutral with regard to jurisdictional claims in published maps and institutional affiliations.
Author details
1MidSouth Bioinformatics Center and Joint Bioinformatics Ph.D. Program of
University of Arkansas at Little Rock and Univ. of Arkansas Medical Sciences, 2801 S. Univ. Ave, Little Rock 72204, USA.2Department of Computer Science, Carnegie Mellon University School of Computer Science, 5000 Forbes Ave, Pittsburgh 24105, USA.
Published: 20 November 2018
References
1. Siegel RL, Miller KD, Jemal A. Cancer statistics, 2016. CA Cancer J Clin. 2016; 66:7–30.
2. Yang Y, Zhou X, Xu M, Piao J, Zhang Y, Lin Z, et al.β-Lapachone suppresses tumour progression by inhibiting epithelial-to-mesenchymal transition in NQO1-positive breast cancers. Sci Rep. 2017;7:2681.
3. Weigelt B, Peterse JL, van’t VLJ. Breast cancer metastasis: markers and models. Nat Rev Cancer. 2005;5:591–602.
4. Early Breast Cancer Trialists' Collaborative Group (EBCTCG), Effects of chemotherapy and hormonal therapy for early breast cancer on recurrence and 15-year survival: an overview of the randomised trials. Lancet. 2005;365: 1687–17.
5. Liu B, Yang M, Li R, Ding Y, Qian X, Yu L, et al. The antitumor effect of novel docetaxel-loaded thermosensitive micelles. Eur J Pharm Biopharm. 2008;69:527–34.
6. Li J, Chen Z, Su K, Zeng J. Clinicopathological classification and traditional prognostic indicators of breast cancer. Int J Clin Exp Pathol. 2015;8:8500–5. 7. Gong G, Kwon MJ, Han J, Lee HJ, Lee SK, Lee JE, et al. A new molecular
prognostic score for predicting the risk of distant metastasis in patients with HR+/HER2−early breast cancer. Sci Rep. 2017;7:45554.
8. Alizadeh AA, Eisen MB, Davis RE, Ma C, Lossos IS, Rosenwald A, et al. Distinct types of diffuse large B-cell lymphoma identified by gene expression profiling. Nature. 2000;403:503–11.
9. Sørlie T, Perou CM, Tibshirani R, Aas T, Geisler S, Johnsen H, et al. Gene expression patterns of breast carcinomas distinguish tumor subclasses with clinical implications. Proc Natl Acad Sci. 2001;98:10869–74.
10. van de Vijver MJ, He YD, van‘t Veer LJ, Dai H, Hart AAM, Voskuil DW, et al. A gene-expression signature as a predictor of survival in breast Cancer. N Engl J Med. 2002;347:1999–2009.
11. Network TCGA. Comprehensive molecular portraits of human breast tumours. Nature. 2012;490:61–70.
12. Bair E, Tibshirani R. Semi-supervised methods to predict patient survival from gene expression data. PLoS Biol. 2004;2:e108.
13. Sun J, Chen X, Wang Z, Guo M, Shi H, Wang X, et al. A potential prognostic long non-coding RNA signature to predict metastasis-free survival of breast cancer patients. Sci Rep. 2015;5:16553.
14. Zhang X, Li Y, Akinyemiju T, Ojesina AI, Buckhaults P, Liu N, et al. Pathway-structured predictive model for Cancer survival prediction: a two-stage approach. Genetics. 2017;205:89–100.
15. Nik-Zainal S, Davies H, Staaf J, Ramakrishna M, Glodzik D, Zou X, et al. Landscape of somatic mutations in 560 breast cancer whole-genome sequences. Nature. 2016;534:47–54.
16. Zhong Q, Peng H-L, Zhao X, Zhang L, Hwang W-T. Effects of BRCA1- and BRCA2-related mutations on ovarian and breast cancer survival: a meta-analysis. Clin Cancer res. 2014;:clincanres1816.2014.
17. Tonghui W, Ye X, Shuyan S, Hua Y, Tao O, Li J, et al. HER2 somatic mutations are associated with poor survival in HER2-negative breast cancers. Cancer Sci. 2017;108:671–7.
18. Pucci F, Rickelt S, Newton AP, Garris C, Nunes E, Evavold C, et al. PF4 promotes platelet production and lung Cancer growth. Cell Rep. 2016;17: 1764–72.
19. Zhao Y-F, Zhao J-Y, Yue H, Hu K-S, Shen H, Guo Z-G, et al. FOXD1 promotes breast cancer proliferation and chemotherapeutic drug resistance by targeting p27. Biochem Biophys Res Commun. 2015;456:232–7. 20. Song H, He W, Huang X, Zhang H, Huang T. High expression of FOXR2 in
breast cancer correlates with poor prognosis. Tumor Biol. 2016;37:5991–7. 21. Mathew S, Merdad A, Al-Maghrabi J, Dallol A. Identification of frequent
MTNR1B methylation in breast cancer following the application of high-throughput methylome analysis. BMC Genomics. 2014;15:P44. 22. Reis-Filho JS, Pusztai L. Gene expression profiling in breast cancer:
classification, prognostication, and prediction. Lancet. 2011;378:1812–23. 23. Fakhraldeen SA, Clark RJ, Roopra A, Chin EN, Huang W, Castorino J, et al.
Two isoforms of the RNA binding protein, coding region determinant-binding protein (CRD-BP/IGF2BP1), are expressed in breast epithelium and support Clonogenic growth of breast tumor cells. J Biol Chem. 2015;290: 13386–400.
24. Syndecan-1 in Breast Cancer Stroma Fibroblasts Regulates Extracellular Matrix Fiber Organization and Carcinoma Cell Motility - Am J Patholhttp://ajp. amjpathol.org/article/S0002-9440(10)00086-6/abstract. Accessed 9 Apr 2018. 25. Thomas PD, Campbell MJ, Kejariwal A, Mi H, Karlak B, Daverman R, et al.
PANTHER: a library of protein families and subfamilies indexed by function. Genome Res. 2003;13:2129–41.
26. Liao L, Kuang S-Q, Yuan Y, Gonzalez SM, O’Malley BW, Xu J. Molecular structure and biological function of the cancer-amplified nuclear receptor coactivator SRC-3/AIB1. J Steroid Biochem Mol Biol. 2002;83:3–14. 27. Jass JR, Do K-A, Simms LA, Iino H, Wynter C, Pillay SP, et al. Morphology of
sporadic colorectal cancer with DNA replication errors. Gut. 1998;42:673–9. 28. Hall A. The cytoskeleton and cancer. Cancer Metastasis Rev. 2009;28:5–14. 29. Curtis C, Shah SP, Chin S-F, Turashvili G, Rueda OM, Dunning MJ, et al. The
genomic and transcriptomic architecture of 2,000 breast tumours reveals novel subgroups. Nature. 2012;486:346–52.
30. Huang DW, Sherman BT, Lempicki RA. Systematic and integrative analysis of large gene lists using DAVID bioinformatics resources. Nat Protoc. 2009;4:44–57. 31. Huang DW, Sherman BT, Lempicki RA. Bioinformatics enrichment tools:
paths toward the comprehensive functional analysis of large gene lists. Nucleic Acids Res. 2009;37:1–13.
32. Gatza ML, Lucas JE, Barry WT, Kim JW, Wang Q, Crawford MD, et al. A pathway-based classification of human breast cancer. Proc Natl Acad Sci. 2010;107:6994–9.
33. Xu H, DiCarlo J, Satya RV, Peng Q, Wang Y. Comparison of somatic mutation calling methods in amplicon and whole exome sequence data. BMC Genomics. 2014;15:244.