R E S E A R C H
Open Access
CpGIMethPred: computational model for
predicting methylation status of CpG islands in
human genome
Hao Zheng
1, Hongwei Wu
1, Jinping Li
2, Shi-Wen Jiang
2*From
The 2011 International Conference on Bioinformatics and Computational Biology (BIOCOMP
’
11)
Las Vegas, NV, USA. 18-21 July 2011
Abstract
DNA methylation is an inheritable chemical modification of cytosine, and represents one of the most important epigenetic events. Computational prediction of the DNA methylation status can be employed to speed up the genome-wide methylation profiling, and to identify the key features that are correlated with various methylation patterns. Here, we develop CpGIMethPred, the support vector machine-based models to predict the methylation status of the CpG islands in the human genome under normal conditions. The features for prediction include those that have been previously demonstrated effective (CpG island specific attributes, DNA sequence composition patterns, DNA structure patterns, distribution patterns of conserved transcription factor binding sites and conserved elements, and histone methylation status) as well as those that have not been extensively explored but are likely to contribute additional information from a biological point of view (nucleosome positioning propensities, gene functions, and histone acetylation status). Statistical tests are performed to identify the features that are significantly correlated with the methylation status of the CpG islands, and principal component analysis is then performed to decorrelate the selected features. Data from the Human Epigenome Project (HEP) are used to train, validate and test the predictive models. Specifically, the models are trained and validated by using the DNA methylation data obtained in the CD4 lymphocytes, and are then tested for generalizability using the DNA methylation data obtained in the other 11 normal tissues and cell types. Our experiments have shown that (1) an eight-dimensional feature space that is selected via the principal component analysis and that combines all categories of information is effective for predicting the CpG island methylation status, (2) by incorporating the information regarding the nucleosome positioning, gene functions, and histone acetylation, the models can achieve higher specificity and accuracy than the existing models while maintaining a comparable sensitivity measure, (3) the histone modification (methylation and acetylation) information contributes significantly to the prediction, without which the
performance of the models deteriorate, and, (4) the predictive models generalize well to different tissues and cell types. The developed program CpGIMethPred is freely available at http://users.ece.gatech.edu/~hzheng7/
CGIMetPred.zip.
Background
Epigenetics refers to structural adaptation of chromoso-mal regions to register, signal or perpetuate altered activ-ity states [1]. A major type of epigenetic event is DNA methylation, which involves the addition of a methyl
group to the number 5 carbon of the cytosine pyrimidine ring [2]. In the human genome, is DNA methylation mostly restricted to the cytosines of CpG dinucleotides. Though the human genome generally shows a great defi-cit of CpG dinucleotides (the genome-wide observed-to-expected CpG ratio is ~0.2), and most of these CpG dinucleotides are methylated in somatic cells [3], the CpG dinucleotides are enriched around gene promoters and form CpG islands, and tend to be protected from * Correspondence: [email protected]
2
Department of Biomedical Sciences, Mercer University School of Medicine, GA, USA
Full list of author information is available at the end of the article
DNA methylation [4]. It has been shown that DNA methylation plays an instrumental roles during normal cell development and cell differentiation, and is also involved in a number of key processes including genetic imprinting, X-chromosome inactivation, suppression of retroviral elements, and carcinogenesis [5,6].
A variety of techniques, based on biochemical experi-ments and computational analysis, have been devised for DNA methylation profiling. The biochemical experi-ment-based approaches are mainly based on methyla-tion-sensitive restriction, immunoprecipitation, or bisulfite conversion, combined with the next-generation sequencing technologies [7]. Whereas, computational predictive models have been developed to identify CpG dinucleotides methylated or unmethylated [8,9], CpG islands (or CpG-rich regions) methylated or unmethy-lated [3,10-13], and CpG islands (or CpG-rich regions) differentially methylated in different tissue/cell types or phenotypes [4,14]. These computational approaches can effectively complement the biochemical-experiment based approaches to speed up genome-wide DNA methy-lation profiling and to identify critical factors or pathways controlling DNA methylation patterns.
A key step for building computational predictive models is to select features. Here we provide a brief review of the existing computational models based on their features for prediction. For the prediction of DNA methylation, the features can be roughly grouped into two broad categories: genetic and epigenetic. Given a region of interest (ROI, e. g., a CpG island or a genomic region centered around a particular CpG dinucleotide), the genetic features include (1) general attributes of the ROI (e.g., length of the ROI, and distribution of the CpG dinucleotides in the ROI), (2) patterns of the DNA sequence composition of the ROI, (3) patterns of conserved transcription factor binding sites (TFBSs) or conserved elements within or near the ROI, (4) structural and physicochemical properties of the ROI, (5) functions of the genes within or near the ROI, (6) the extent of the diversity of the ROI within the population, and (7) the extent of the conservation of the ROI among species. And, the epigenetic features mainly regard the methylation and acetylation status of the histones.
Bhasinet al.used DNA composition features to predict the methylation of single cytosines. A 39-nucleotide long DNA fragment centered around the cytosine of interest was considered as the ROI, and each nucleotide in the ROI was coded by using a 5-bit binary sparse code. In this way, each ROI was represented by a series of codes, and the dif-ference between ROIs was able to be quantified. A ~75% accuracy was reported using a support vector machine-based classifier [8]. Luet al.also used DNA composition features for predicting whether a CpG dinucleotide is methylated or not. A 1,000 nucleotide long DNA fragment centered around the CpG dinucleotide was used as the
ROI, and the frequencies of all pentamer oligonucleotides formed the features. A ~77% accuracy was reported for the CD4 lymphocytes data set using a nearest neighbor-based classifier [9]. Feltuset al.used frequencies of seven DNA patterns, TCCCCCNC, TTTCCTNC, TCCNCCNCCC, GGAGNAAG, GAGANAAG, GCCACCCC, and GAG-GAGGNNG with N representing any base, and achieved an ~82% accuracy on the human fibroblast data set when distinguishing between methylation-prone and methyla-tion-resistant CpG islands using a linear programming-based classifier [4].
In addition to DNA composition features, Fanget al.
also used the distribution of the repetitive element AluY as well as the distribution of TFBSs for predicting the methylation status of CpG rich segments, and reported an ~84% specificity and ~84% sensitivity on the human brain data set using a support vector machine-based
clas-sifier [3]. Bocket al. used DNA composition features,
predicted DNA helix structure, attributes of repeat ele-ments and TFBSs, evolutionary conservation of Phast-Cons elements [15] and the number of single nucleotide polymorphisms (SNPs) for the prediction of CpG island methylation [10,11], and their method achieved a high specificity (~98%) but a relatively low sensitivity (~67%) on human lymphocytes using a support vector machine-based classifier [13]. Aliet al.also used the DNA compo-sition information, predicted DNA structure, and SNP features, and reported a ~72% accuracy on the human lymphocytes data set using a K nearest neighbor-based classifier [12]. To predict tissue-specific differentially
methylated regions (DMRs), Previtiet al. used CpG
island specific attributes, attributes of repetitive elements, number and frequency of PhastCons elements, as well as structural and physicochemical properties. When classi-fying CpG islands into four categories: constitutively methylated, constitutively unmethylated, tissue-specific DMR, and lack of methylation exclusively in sperm, they reported an ~89% accuracy using a decision tree-based classifier [14].
data set using a support vector machine-based classifier [13].
In this study, we consider various attributes that are pos-sibly related to the CpG island methylation. These attri-butes include those that have been previously investigated (CpG island specific attributes, DNA sequence composi-tion patterns, DNA structure patterns, distribucomposi-tion pat-terns of conserved TFBS’s and conserved elements, and histone methylation status), and those that have not been extensively investigated but are potentially related to DNA methylation from biochemical perspectives (nucleosome positioning propensities, gene functions, and histone acet-ylation status). The contribution of each individual feature is evaluated by statistical tests; and the correlation between features is reduced by principal component analysis (PCA). These DNA methylation-relevant yet non-intercor-related features are then used to build support vector machine (SVM)-based models to predict the methylation status of CpG islands. The predictive models are evaluated by using the HEP data set. Specifically, the CpG island methylation profiles in the CD4 lymphocytes are used to train and validate the models, while the CpG island methylation profiles in the other 11 tissues/cell types are used to test the generalizability of the models. Through these experiments, we assess the individual and combina-tional influence of the newly added features and the impact of histone modification information.
The rest of the paper is organized as follows. In Section 2, we describe the data collection used to train, validate and test the computational models. In Section 3, we dis-cuss the methods for feature extraction, feature selection, and building the predictive models. The experimental results are reported in Section 4. And finally in Section 5 we draw conclusions.
Data sets
We obtain the methylation profiles of the human genome from HEP. bisulfite DNA sequencing technique, and pro-vides high-resolution data of the genome-wide DNA methylation patterns in various tissues and cell lines [18]. It currently covers chromosomes 6, 20 and 22, and con-tains ~1.9 million CpG methylation values of 2,524 ampli-cons from 12 different tissues and 43 different samples. The methylation values of the CpGs range from 0 to 100 inclusive, where 0 corresponds to the lowest and 100 to the highest methylation intensity.
We define the CpG island as a DNA stretch that is not a repetitive element but satisfies the Gardiner-Garden cri-teria, i.e., with length of≥200 bps, GC content≥50%, and observed to expected CpG ratio≥0.6 [19]. We construct our training data set based on the CpG islands extracted from the UCSC genome browser and the DNA methyla-tion profiles specified by HEP. Specifically, we only con-sider those CpG islands more than 10% of whose CpG
dinucleotides are annotated with methylation intensities. For each tissue or cell type, the methylation intensity of a CpG dinucleotide is calculated as the average in different samples [20]; and the methylation intensity of a CpG island is calculated as the average of all the CpG dinucleo-tides within it. The CpG islands with methylation intensity
≥50 are regarded as the methylated (positive), while those
with methylation intensity ≤ 10 are regarded as the
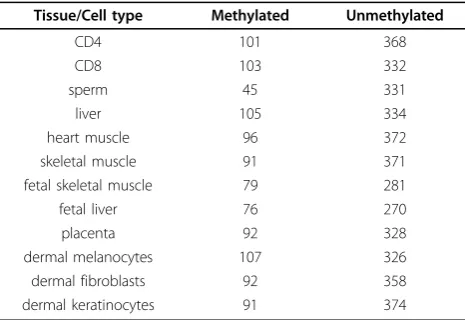
unmethylated (negative) [13]. The number of so-obtained methylated and unmethylated CpG islands are summar-ized in Table 1. In particular, there are 101 methylated and 368 unmethylated CpG islands for the CD4 lympho-cytes, which are used for training and validating the pre-dictive models, while the CpG islands in the other tissues or cell types are used for generalizability testing.
Methods
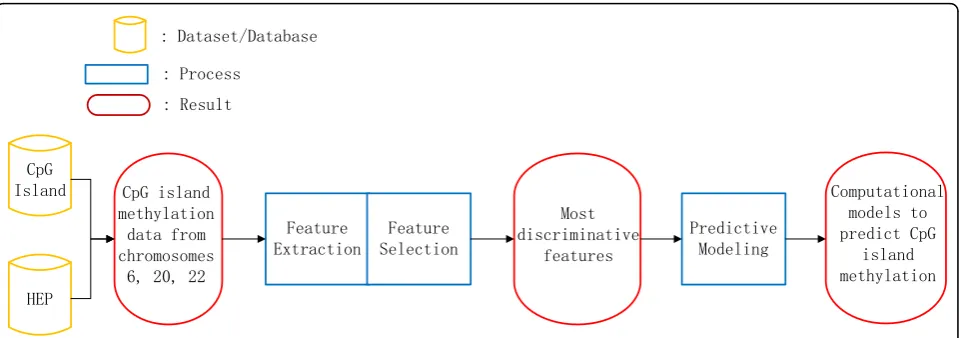
The core of our establishment of the computational pre-dictive models consists of three parts, feature extraction, feature selection and model training and testing, as depicted in Figure 1. We here describe these three steps in detail.
Feature extraction
A key step for building computational predictive models is to select features. It has been shown that the CpG island methylation status is correlated with the following fea-tures: CpG island specific attributes (e.g. length, GC con-tent, GC observed/expected ratio) [14,21,3], patterns of DNA sequence composition [4,21,10], patterns of pre-dicted DNA structure [14,10], patterns of conserved TFBS’s and conserved elements [14], as well as the methy-lation status of nearby histones [13]. Computational pre-diction of CpG island methylation status based on the statistical properties of these features could render fairly reasonable accuracy (e.g., ~89% [4,13]). In this study we
Table 1 Number of methylated and unmethylated CpG islands in the twelve different tissue and cell types based on the DNA methylation profiles of HEP.
Tissue/Cell type Methylated Unmethylated
CD4 101 368
CD8 103 332
sperm 45 331
liver 105 334
heart muscle 96 372
skeletal muscle 91 371
fetal skeletal muscle 79 281
fetal liver 76 270
placenta 92 328
dermal melanocytes 107 326
dermal fibroblasts 92 358
incorporate three more sets of attributes that have not been extensively explored, including (i) the nucleosome positioning propensities of the CpG island, (ii) the acetyla-tion status of nearby histones, and (iii) the functional roles of nearby genes. In the following paragraphs, we describe how these features are extracted.
General attributes
Three attributes, including the GC content, length and observed/expected CpG ratio, are directly obtained from UCSC human genome browser for each CpG island [22].
DNA sequence composition
We use the tetramer frequencies and their correspond-ing z-scores to characterize the DNA composition
pat-terns of the CpG island. The z-score of a tetramer, Z
(N1N2N3N4), depicts how much the observed frequency of the tetramerN1N2N3N4,O(N1N2N3N4), deviates from its expected frequencyE(N1N2N3N4).
Z(N1N2N3N4) =
O(N1N2N3N4)−E(N1N2N3N4) σ(N1N2N3N4)
(1)
whereE(N1N2N3N4) is approximated by using a maxi-mal-order Markov model [23]:
E(N1N2N3N4) =
O(N1N2N3)O(N2N3N4)
O(N2N3)
(2)
and the standard deviations(N1N2N3N4) is calculated based on the observed frequencies of dimers and trimers:
σ(N1N2N3N4) =E(N1N2N3N4)∗
[O(N2N3)−O(N1N2N3)][O(N2N3)−O(N2N3N4)] O2(N2N3) (3)
Altogether, we extract 512 features about DNA sequence composition, including 256 for tetramer fre-quencies and 256 for their z-scores.
Conserved TFBS’s and conserved elements
The distribution patterns of the conserved TFBS’s and conserved elements in the CpG island and the flanking regions are also taken into account. Here a conserved TFBS refers to one that is conserved in human, mouse and rat genomes [24]; and there are 258 such TFBS’s that can roughly be grouped into 115 groups according to their function similarity [10]. Also, a conserved element refers to a genomic segment (other than TFBS) that is conserved across vertebrate, insect, worm and yeast genomes [15]. Each conserved TFBS or conserved element is character-ized by a score quantifying its degree of conservativeness. We consider both the short- and long-range associations between these elements and CpG islands, and therefore select the flanking regions of various lengths (ranging from 100 bps to 2,000 bps with an increment of 100 bps) upstream and downstream of each CpG island. Given a CpG island (and its flanking region of a particular length), for each TFBS group (or conserved element), we count the number of TFBS’s (or conserved elements) that over-lap with this CpG island (and its flanking region) and the average score of these TFBS’s (or conserved elements). Therefore, in terms of conserved TFBS’s and conserved elements, each CpG island is characterized by 210 (115 × 2, for conserved TFBS’s) plus two features (for conserved elements).
Structural properties
We focus on those basic characteristics that capture the DNA 3-D conformation and newly added nucleosome positioning propensities. The DNA conformation related features measure the twist, tilt, roll, shift, slide and rise propensities of dinucleotides [25]. For each of these six features, the average value over all dinucleotides in the CpG island is used.
&S* ,VODQG
+(3
)HDWXUH ([WUDFWLRQ
)HDWXUH 6HOHFWLRQ
3UHGLFWLYH 0RGHOLQJ &S*LVODQG
PHWK\ODWLRQ GDWDIURP FKURPRVRPHV
0RVW GLVFULPLQDWLYH
IHDWXUHV
&RPSXWDWLRQDO PRGHOVWR SUHGLFW&S*
LVODQG PHWK\ODWLRQ 'DWDVHW'DWDEDVH
3URFHVV
5HVXOW
Due to an accumulating body of evidence showing that DNA methylation is influenced by nucleosome positioning propensities [26], we also investigate these features. Nucleosome positioning propensities of the CpG islands are estimated based on the genome-wide prediction of the nucleosome organization map [27]. There are two types of predictions, one at the nucleotide level, and the other at the DNA fragment level. The nucleotide level prediction regards the probability of each nucleotide being covered by any nucleosome, based on which we calculate the mean and standard deviation over the entire CpG island. The fragment level prediction regards the nucleosome positioning potential of each 147 bp (typical length of a nucleosome) DNA fragment, based on which we calculate the mean and standard deviation over all fragments overlapping with the CpG island. Altogether, we extract four features regarding nucleosome positioning propensities.
Functional roles of nearby genes
Since DNA methylation is heavily involved in biological processes such as tumor suppressor gene silencing [28,29], we examine whether a CpG island’s nearby genes are involved in any cancer-related biological processes. A CpG island’s nearby genes refer to those whose promoter region (from the 1,000 bps upstream to the 200 bps downstream of the transcription start site) overlaps with the CpG island. 37 biological processes (30 oncogene related, 11 tumor suppressor related, and 4 common) are determined through gene ontology enrichment analysis of the genes retrieved from the Cancer Gene Census [30]. If the gene ontology annotations of a gene include one or more of these processes, the corresponding gene function feature is 1 and 0 otherwise. We have two features for functional roles of nearby genes, one for oncogene related and the other for tumor suppressor gene related biological processes.
Histone methylation and acetylation
We consider the methylation status of each CpG island’s nearby histones. The histone methylation information is obtained from Barkski et al’s data set, which characterizes the genome wide distribution of 20 histone methylations as well as histone variant H2A.Z, RNA polymerase II, and the insulator binding protein CTCF in CD4 lympho-cytes [31].
Since DNA methylation has also been observed to be associated with histone acetylation [32], we further include the histone acetylation features in the feature set. The histone acetylation information is obtained from Wang et al.’s data set [33], which characterizes the gen-ome-wide patterns of 18 histone acetylations in CD4 lymphocytes.
In both data sets, a nucleotide is tagged if its nearby histone undertakes a methylation or acetylation modifica-tion; hence, the number of tags at each nucleotide can be
interpreted as being proportional to the modification level of nearby histones. We use the average and standard deviation of the number of tags over all nucleotides of a CpG island to represent the methylation (or acetylation) level of the CpG island’s nearby histones. Altogether, we have 46 features for histone methylation and 36 features for histone acetylation.
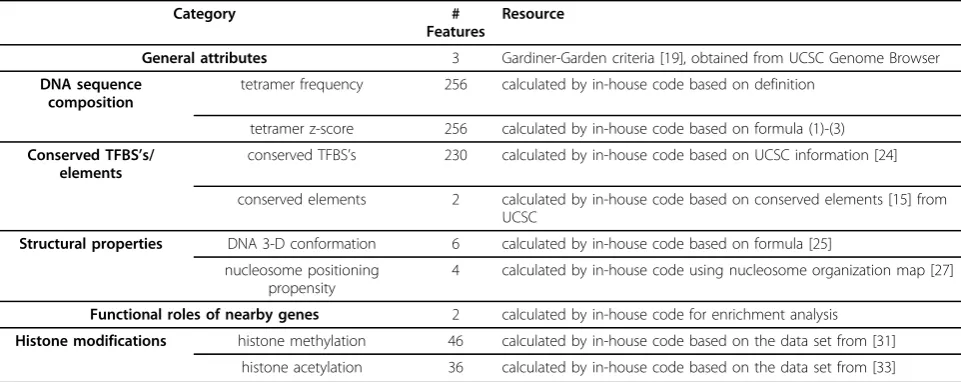
Feature selection
Altogether, we generate 841 features using the above procedure as summarized in Table 2. Compared to the size of our training data set (see Table 1), this dimen-sion of the feature space is prohibitively high, which will potentially lead to classifier designs that are too expen-sive to implement or that cannot well generalize to unseen data. Therefore, we perform a two-step feature selection procedure, where the statistical test is used to select those features that are highly correlated with the methylation status of CpG islands, and PCA is used to minimize the redundancy in the features.
Statistical test
Three statistical tests, Fisher’s exact [34], Chi-squared [35] and Kolmogorov-Smirnov (KS) tests [36], are used to identify those features whose statistical patterns are signifi-cantly different between the positive and negative datasets. Specifically, the Fisher’s exact tests are used for functional roles of nearby genes, for which the feature variable is categorical and some expected values in the contingency tables are extremely small (< 5). The Chi-squared tests are applied to categorical features, including the number of
conserved TFBS’s and conserved elements. And, the KS
tests are applied to the numeric features, including CpG island general attributes, DNA sequence composition fea-tures (frequencies and z-scores), average scores of
con-served TFBS’s and conserved elements, structural
properties, histone methylation and histone acetylation. A feature is selected if thep-value rendered by the statistical test is less than 0.05.
PCA
above statistical tests. The PCA uses an orthogonal trans-formation to convert a set of values of possibly correlated dimensions into a set of values of uncorrelated dimen-sions called principal components [38]. After PCA trans-formation, the feature components are completely decorrelated, and the information contained in the origi-nal feature space before the transformation is maximally retained in the first several number of components of the new feature space. Therefore, by keeping only the first several components of the new feature space, most of the information can still be retained while the redundancy in the feature collection is greatly removed and the dimen-sionality of the feature space is greatly reduced.
Model training, validation and testing
After feature selection through statistical tests and PCA, each CpG island is represented by a multi-dimensional feature vector that corresponds to the retained principal components. The feature is then fed to the models to predict the methylation status of the CpG island. To examine the contribution of the newly added features as well as the impact of the inhibitive-to-acquire histone modification information, we establish 16 models, (1)M1: with all information being incorporated, (2)M2: with all but the histone modification information being incorpo-rated, (3)M3-M9: models with individual or combina-tions of the newly added features being excluded, and (4)
M10-M16: models with individual or combinations of the newly added features as well as the histone methylation information being excluded. Each model is based on the SVM, and outputs binary results indicating whether the CpG islands are methylated or unmethylated and contin-uous results ranging from 0 (minimum) to 100 (maxi-mum) indicating the methylation intensities of the CpG islands. Given the binary predictions provided by a
model and the true methylation status as specified in the HEP data set for a group of CpG islands, we can estimate the specificity, sensitivity and accuracy of the model as in Eqns. (4)-(6):
SP=#correctly classified unmethylated CpG islands
#unmethylated CpG islands (4)
SE= #correctly classified unmethylated CpG islands
#methylated CpG islands (5)
ACC= #correctly classified CpG islands
#CpG islands (6)
where SP, SE, ACC stand for specificity, sensitivity and accuracy, respectively. And, given the continuous predic-tions and the true methylation intensities of the CpG islands, we can calculate their correlation coefficient as:
CC= cov(predicted status, actual status)
σpredicted status∗σactual status (7)
where CC stand for correlation coefficient, cov(·)
denotes the covariance, and s denotes the standard
deviation. Note that the specificity reflects the model’s capabilities in dealing with the negative (unmethylated) data - a high specificity measure implies that a predicted unmethylated CpG island is highly likely truly unmethy-lated. And the sensitivity reflects the models’s capabil-ities in dealing with the positive (methylated) data - a high sensitivity measure implies that a predicted methy-lated CpG island is highly likely truly methymethy-lated. Whereas, the accuracy and correlation coefficient reflect the model’s overall capabilities in dealing with all types of CpG islands - high accuracy and high (close to one)
Table 2 Number of features in each category and information resource for the feature extraction.
Category #
Features
Resource
General attributes 3 Gardiner-Garden criteria [19], obtained from UCSC Genome Browser
DNA sequence composition
tetramer frequency 256 calculated by in-house code based on definition
tetramer z-score 256 calculated by in-house code based on formula (1)-(3)
Conserved TFBS’s/ elements
conserved TFBS’s 230 calculated by in-house code based on UCSC information [24]
conserved elements 2 calculated by in-house code based on conserved elements [15] from UCSC
Structural properties DNA 3-D conformation 6 calculated by in-house code based on formula [25]
nucleosome positioning propensity
4 calculated by in-house code using nucleosome organization map [27]
Functional roles of nearby genes 2 calculated by in-house code for enrichment analysis
Histone modifications histone methylation 46 calculated by in-house code based on the data set from [31]
correlation coefficient implies that the predictions are highly likely true.
Training/validation
All these models are trained and validated by using the CD4 lymphocyte data with a 10-fold cross validation scheme. The 469 CpG islands are randomly partitioned into 10 approximately equally-sized folds. Each fold is used in turn for validation while the remaining folds are used for training. The performance of the model is assessed based on the data in the validation fold. This partition-training-and-validation procedure is repeated for 20 times, and the performance of the model (in terms of specificity, sensitivity, accuracy and correlation coefficient) is averaged over the 200 validation folds (10 validation folds per partition ×20 partitions).
Generalizability test
Two predictive models built on the CD4 lymphocyte data,M1(using all information) andM2 (using all but histone modification information), are also tested for generalizability using the data of the other 11 tissues and cell types. For generalizability testing onM1, we apply the histone modification information of the CD4 lympho-cyte to the other 11 tissues and cell types because corre-lation analysis by ourselves and others has indicated that histone modifications exhibit modest to strong correla-tions for different cell lines [39,13]. The generalizability performance of the model is also measured in terms of specificity, sensitivity, accuracy and correlation coeffi-cient, which are averaged over all the models constructed from all the above training/validation partitions.
Results and discussions Statistical tests and PCA
Out of a total number of 841 features, 342 features are retained whose p-values in the statistical tests are less than 0.05. These features include two of the CpG island specific attributes, 217 DNA sequence compositional fea-tures, and eight DNA structural feafea-tures, 35 features regarding the conserved TFBSs, two features regarding the conserved elements, two features regarding the func-tional roles of the neighboring genes, and 76 features related to the modification status of nearby histones. Par-ticularly, among the newly added features, two out of the four nucleosome positioning features, all of the 36 his-tone acetylation features, and both of the features regard-ing the functional roles of the neighborregard-ing genes are retained after statistical tests.
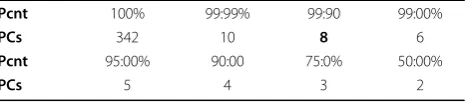
PCA is performed on these 342 selected features to minimize their correlations. Table 3 summarizes the number of principal components that must be retained to keep a certain percentage of the variance of the ori-ginal feature space. Observe that the first eight princi-pal components together can account for the ~99.90% of the total variance and are therefore used to build
the predictive models. Figure 2 depicts the contribution of each of the 342 original feature dimensions to the eight principal components. Observe from Figure 2 that each of the following categories of features, (i) the CpG island general attributes, (ii) DNA sequence com-position, (iii) distribution of the conserved TFBS’s and conserved elements, (iv) DNA structure patterns, (v) gene functions, (vi) histone methylation and acetylation status, makes substantial contributions to one or more principal components, suggesting that these categories of information, though correlated, are complementary to a certain extent for predicting the CpG island methylation.
Performance of the predictive models based on the CD4 lymphocyte data
The specificity, sensitivity, accuracy and correlation
coefficient measures of our predictive model M1 that
incorporates all information are summarized in Table 4. The performance of our classifier is compared to that of Fan et al.’s method (which is based on a similar set of features and represents the state of the art [13]). Note that both models have incorporated the histone modifi-cation information. Observe that our model shows an improved specificity and accuracy while maintaining a comparable sensitivity.
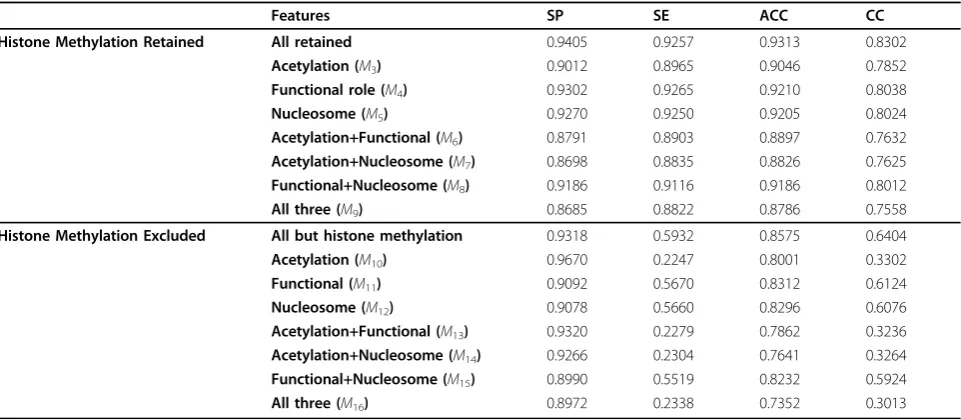
We could argue that the improvement of our model
M1 over the existing model is partly due to the incor-poration of the three new types of features - nucleosome positioning propensities, gene functions, and histone
acetylation status. The performance of our models M3
through M9, each with an individual or a combination
of the new types of features being excluded, are sum-marized in Table 5. Observe that the performance of the predictive model deteriorate to different extents when individual or combinations of the newly added features are excluded. Specifically, the models without histone acetylation information (M3, M6,M7, and M9) deteriorate more than those models with histone acety-lation information but without the other two types of newly added features (M4, M5, andM8). Therefore, his-tone acetylation appears to be the most influential fea-ture to the performance of the predictive model among the newly added features.
Table 3 Number of principal components (PCs) required to retain a certain percentage (Pcnt) of the variance of the original feature space of the 342 features selected through statistical tests.
Pcnt 100% 99:99% 99:90 99:00%
PCs 342 10 8 6
Pcnt 95:00% 90:00 75:0% 50:00%
We suspect that the information carried by the histone methylation features is too dominant to fairly assess the influence of these newly added features; and therefore exclude the histone methylation features and repeat the above experiments excluding individual or combinations of the newly added features. The resultant models areM10
throughM16, and their performance is summarized in
Table 5. Similarly, the models without an individual or a combination of the newly added features deteriorate. It is noteworthy that (1) the histone methylation and acetyla-tion informaacetyla-tion greatly affect the sensitivity of the mod-els, and (2) the loss of histone methylation information could largely be made up by including the histone acetyla-tion informaacetyla-tion. This is not surprising, given that these two forms of histone modifications are closely related as repeatedly observed in various tissues and cell types [37].
Classifier generalizability
The two predictive models, one with the histone modifi-cation information (M1) and the other without (M2), that are both built on the human CD4 lymphocyte data are then tested on the data of the other 11 tissue and cell
types for their generalizability. The sensitivity, specificity, accuracy and correlation coefficient ofM1andM2during these testing experiments are summarized in Tables 6 and 7.
When the histone modification information is incorpo-rated, the classifier model built on the CD4 lymphocyte data can be applied to most of the other tissues and cell types (except for sperm) with little or no performance deterioration. When the histone modification informa-tion is not used, the performance of the predictive model on the data of the other tissues and cell types deteriorate substantially, especially in terms of the sensitivity. How-ever, if compared to the validation results where the his-tone modification information is not used (see Table 3), the performance on the testing data is not unexpected. Therefore, with or without the histone modification information, the predictive model established on the CD4 lymphocyte data can well generalize to the other tissue or cell type data.
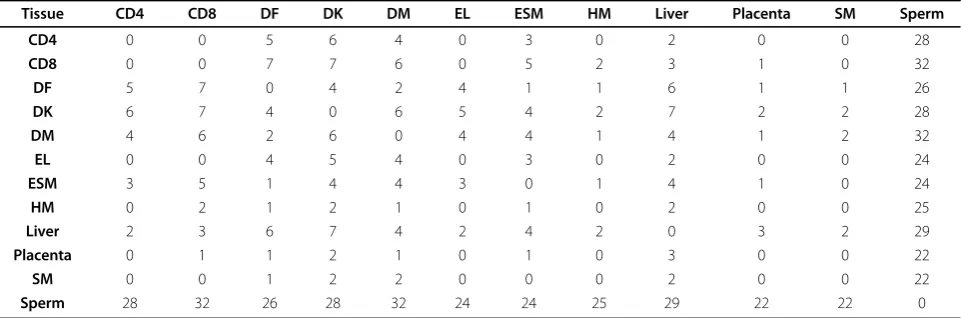
Considering that DNA methylation is heavily involved in cellular differentiation, our results in Tables 6 and 7 may look suspicious. We therefore count the number of differentially methylated CpG islands (Table 8) and cal-culate the correlation of the CpG island methylation levels between any two different tissue and cell types (Figure 3). Observe that between somatic/placenta cells, the number of differentially methylated CpG islands is small and the correlation coefficients are very high, whereas between the somatic/placenta and sperm cells,
PC1 PC2 PC3 PC4 PC5 PC6 PC7 PC8
CpG island specific
DNA composition
DNA structure TFBS Evolutionarily conserved Function of nearby genes Histone methylation
Histone acetylation 0.1
0.2 0.3 0.4 0.5 0.6 0.7 0.8 0.9
Figure 2Contribution of the 342 features to the eight principal components.Each column corresponds to a principal component, and each row corresponds to an original feature dimension. All feature categories make substantial contributions to one or more principal components, suggesting that these categories of information, though correlated, are complementary to a certain extent for predicting the CpG island methylation.
Table 4 Performance of our classifiersM1on CD4 lymphocytes with comparison to the existing method.
Method SP SE ACC CC
M1 0.9405 0.9257 0.9313 0.8302
-the number of differentially correlated CpG islands is relatively larger and the correlation coefficients is rela-tively lower. This suggests that the methylation status of CpG islands are highly correlated in various somatic/pla-centa cells, and therefore do not represent tissue-specific differentially methylated regions. Our observations are consistent with recent studies [17,40] that there are few variance in methylation levels of autosomal CpG island promoters, and there is only a relatively small fraction of CpG islands with tissue-specific methylation. The differ-ence between the somatic/placenta and sperm cells, as reflected by their moderate cross-correlations and the performance deteriorations of our prediction models being applied to the sperm cell data, suggests that
gametes are epigenetically more deviated from somatic cells than somatic cells themselves. This difference is likely related to the meiotic process, the special condi-tions and gene expression required for gamete produc-tion [41].
Conclusions and future works
The establishment of DNA methylation pattern is a cru-cial part of cell differentiation and organ development, suppression of viral genes and deleterious elements, and carcinogenesis. Computational prediction of DNA methylation levels provides an effective, fast and cheap alternative approach for studying the DNA methylation patterns. In this study, we perform the computational
Table 5 Performance of the predictive models (M3throughM16), each with an individual or a combination of the newly added categories of features being excluded.
Features SP SE ACC CC
Histone Methylation Retained All retained 0.9405 0.9257 0.9313 0.8302
Acetylation (M3) 0.9012 0.8965 0.9046 0.7852
Functional role (M4) 0.9302 0.9265 0.9210 0.8038
Nucleosome (M5) 0.9270 0.9250 0.9205 0.8024
Acetylation+Functional (M6) 0.8791 0.8903 0.8897 0.7632 Acetylation+Nucleosome (M7) 0.8698 0.8835 0.8826 0.7625 Functional+Nucleosome (M8) 0.9186 0.9116 0.9186 0.8012
All three (M9) 0.8685 0.8822 0.8786 0.7558
Histone Methylation Excluded All but histone methylation 0.9318 0.5932 0.8575 0.6404
Acetylation (M10) 0.9670 0.2247 0.8001 0.3302
Functional (M11) 0.9092 0.5670 0.8312 0.6124
Nucleosome (M12) 0.9078 0.5660 0.8296 0.6076
Acetylation+Functional (M13) 0.9320 0.2279 0.7862 0.3236 Acetylation+Nucleosome (M14) 0.9266 0.2304 0.7641 0.3264 Functional+Nucleosome (M15) 0.8990 0.5519 0.8232 0.5924
All three (M16) 0.8972 0.2338 0.7352 0.3013
Specificity (SP), sensitivity (SE) and accuracy (ACC) are evaluated for binary classification, and correlation coefficient (CC) for regression models.
Table 6 Performance of the classifier model and the influence of newly added features on the data of 11 different tissues and cell types: with histone modification.
Procedure Tissue/Cell Type with added features without added features
SP SE ACC CC SP SE ACC CC
Validation CD4 0.9405 0.9257 0.9313 0.8302 0.8685 0.8822 0.8786 0.7558
Testing CD8 0.9608 0.8932 0.9448 0.8286 0.8692 0.8534 0.8758 0.7476
liver 0.9680 0.8762 0.9465 0.8292 0.8512 0.8468 0.8698 0.7398
heart muscle 0.9462 0.9479 0.9466 0.8342 0.8678 0.8796 0.8724 0.7542
skeletal muscle 0.9542 0.9451 0.9524 0.8411 0.8714 0.8923 0.8895 0.7612
embryonic skeletal 0.9395 0.9367 0.9389 0.8337 0.8676 0.8802 0.8774 0.7553
embryonic liver 0.9259 0.9342 0.9277 0.8250 0.8490 0.8834 0.8683 0.7324
placenta 0.9695 0.9130 0.9571 0.8412 0.8704 0.8742 0.8802 0.7597
dermal melanocytes 0.9663 0.8785 0.9446 0.8401 0.8677 0.8792 0.8726 0.7498 dermal fibroblasts 0.9525 0.9239 0.9467 0.8332 0.8625 0.8792 0.8656 0.7478 dermal keratinocytes 0.9385 0.9341 0.9376 0.8310 0.8505 0.8690 0.8502 0.7371
prediction of the CpG island methylation by incorporat-ing additional features and effectively selectincorporat-ing and dec-orrelating the features. We incorporate the information regarding the nucleosome positioning propensity, acetyla-tion status of nearby histones, and the funcacetyla-tional roles of nearby genes. These features are first screened through statistical tests and PCA. The most DNA methylation-rele-vant yet non-intercorrelated features are subsequently used to build computational models to predict the methy-lation status of CpG islands. Our experiments on the HEP data set demonstrated that (1) an eight-dimensional fea-ture space, which combines all the eight categories of information, is effective in predicting the methylation sta-tus of CpG islands; (2) by incorporating the information regarding the nucleosome positioning propensities, gene functions, and histone acetylation, our predictive model achieves a higher specificity and accuracy than the existing model while maintaining a comparable sensitivity; (3) the
histone modification attributes carry a weight of informa-tion for the predicinforma-tion, without which the performance of the predictive model deteriorates substantially in terms of sensitivity; (4) with or without the histone modification information, the performance of the predictive models are consistent on the validation and testing data.
Though it is known that DNA methylation is heavily involved in the normal development and differentiation, as well as in the onset and progression of diseases, the exact mechanisms are yet to be discovered. It will certainly help to accelerate biomedical investigations if we can, through computational predictions, comparative analyses, and evo-lutionary studies, identify those DNA regions whose methylation variation patterns are correlated with, indica-tive of, and underlying of the variations in gene expres-sions, histone modifications and chromatin structures that are related to normal development, cell differentiation, genome imprinting, X-chromosome inactivation, and
Table 7 Performances of the classifier model and the influence of newly added features on the data of 11 different tissues and cell types: without histone modification.
Procedure Tissue/Cell Type with added features without added features
SP SE ACC CC SP SE ACC CC
Validation CD4 0.9670 0.2247 0.8001 0.3302 0.8972 0.2338 0.7352 0.3013
Testing CD8 0.9722 0.2108 0.8104 0.3325 0.8978 0.2284 0.7350 0.3009
liver 0.9678 0.2143 0.8122 0.3328 0.8965 0.2325 0.7298 0.3005
heart muscle 0.9562 0.2386 0.8186 0.3402 0.8804 0.2468 0.7190 0.3001
skeletal muscle 0.9594 0.2364 0.8306 0.3268 0.8874 0.2476 0.7268 0.3003
embryonic skeletal 0.9425 0.2298 0.8100 0.3228 0.8805 0.2406 0.7222 0.3002
embryonic liver 0.9389 0.2306 0.8054 0.3217 0.8796 0.2512 0.7350 0.3015
placenta 0.9655 0.2184 0.8276 0.3450 0.9004 0.2216 0.7398 0.3128
dermal melanocytes 0.9700 0.2186 0.8156 0.3358 0.8986 0.2306 0.7354 0.3027 dermal broblasts 0.9605 0.2200 0.8058 0.3286 0.8902 0.2276 0.7308 0.3016 dermal keratinocytes 0.9425 0.2204 0.8095 0.3325 0.8854 0.2304 0.7304 0.3013
sperm 0.8524 0.2365 0.7625 0.2678 0.7906 0.2408 0.6705 0.2317
Table 8 The number of CpG islands that are differentially methylated in any two tissues among 321 common CpG islands for all the 12 tissues.
Tissue CD4 CD8 DF DK DM EL ESM HM Liver Placenta SM Sperm
CD4 0 0 5 6 4 0 3 0 2 0 0 28
CD8 0 0 7 7 6 0 5 2 3 1 0 32
DF 5 7 0 4 2 4 1 1 6 1 1 26
DK 6 7 4 0 6 5 4 2 7 2 2 28
DM 4 6 2 6 0 4 4 1 4 1 2 32
EL 0 0 4 5 4 0 3 0 2 0 0 24
ESM 3 5 1 4 4 3 0 1 4 1 0 24
HM 0 2 1 2 1 0 1 0 2 0 0 25
Liver 2 3 6 7 4 2 4 2 0 3 2 29
Placenta 0 1 1 2 1 0 1 0 3 0 0 22
SM 0 0 1 2 2 0 0 0 2 0 0 22
Sperm 28 32 26 28 32 24 24 25 29 22 22 0
phenotypic changes, respectively. This computational model, with its evidently high specificity and sensitivity, provides an effective tool for identification of new methy-lation targets and therefore lays foundation for our future endeavors in the regulation mechanisms of DNA methylation.
Availability
An standalone program for the CpGIMethPred is freely available for download at http://users.ece.gatech.edu/ ~hzheng7/CGIMetPred.zip. Given the chromosome loca-tion (hg18) of a CpG islands, CpGIMethPred is able to predict the methylation status of it.
Competing interests
The authors declare that they have no competing interests.
Acknowledgements
This study is partially supported by Georgia Cancer Coalition Award RC672
“Establishing the Computational Model to Detect Cancer-Specific Differentially Methylated CpG Islands in Human Genome.”
This article has been published as part ofBMC Medical GenomicsVolume 6 Supplement 1, 2013: Proceedings of the 2011 International Conference on Bioinformatics and Computational Biology (BIOCOMP’11). The full contents of the supplement are available online at http://www.biomedcentral.com/
bmcmedgenomics/supplements/6/S1. Publication of this supplement has been supported by the International Society of Intelligent Biological Medicine.
Author details 1
School of Electrical and Computer Engineering, Georgia Institute of Technology, GA, USA.2Department of Biomedical Sciences, Mercer University School of Medicine, GA, USA.
Published: 23 January 2013
References
1. Bird A:Perceptions of epigenetics.Nature2007,447:396-398. 2. Bird A:CpG-rich islands and the function of DNA methylation.Nature
1986,321:209-213.
3. Fang F, Fan S, Zhang X, Zhang M:Predicting methylation status of CpG islands in the human brain.Bioinformatics2006,22:2204-2209. 4. Feltus F, Lee E, Costello J, Plass C, Vertino P:Predicting aberrant CpG
island methylation.Proceedings of the National Academy of Sciences USA
2003,100:12253-12258.
5. Previti C, Harari O, Zwir I, del Val C:DNA methylation: past, present and future directions.Carcinogenesis2000,21:461-7.
6. Tao Y, Xi S, Shan J, Maunakea A, Che A, Briones V, Lee E, Geiman T, Huang J, Stephens R, Leighty R, Zhao K, Muegge K:Lsh, chromatin remodeling family member, modulates genome-wide cytosine methylation patterns at nonrepeat sequences.Proc Natl Acad Sci USA
2011,108:15535.
7. Zhang M, Smith A:Challenges in understanding genome-wide DNA methylation.Journal of Computer Science and Technology2010,1:26-34. Figure 3Correlation coefficients of the CpG island methylation levels across different tissues and cell types. The methylation status of CpG islands are highly correlated among the somatic and placenta cells. The methylation status of CpG island in sperm exhibits much
8. Bhasin M, Zhang H, Reinherz E, Reche P:Prediction of methylated CpGs in DNA sequences using a support vector machine.FEBS Lett2005, 579:4302-8.
9. Lu L, Lin K, Qian Z, Li H, Cai Y, Li Y:Predicting DNA methylation status using word composition.J Biomedical Science and Engineering2010, 3:672-676.
10. Bock C, Paulsen M, Tierling S, Mikeska T, Lengauer T, Walter J:CpG island methylation in human lymphocytes is highly correlated with DNA sequence, repeats, and predicted DNA structure.PLoS Genetics2006,2: e26.
11. Bock C, Walter J, Paulsen M, Lengauer T:CpG island mapping by epigenome prediction.PLoS Computational Biology2007,3:e110. 12. Ali I, Seker H:Detailed methylation prediction of CpG islands on human
chromosome 21.10th WSEAS International Conference on Mathematics and Computers In Biology and Chemistry2009, 147-152.
13. Fan S, Zhang M, Zhang X:Histone methylation marks play important roles in predicting the methylation status of CpG islands.Biochemical and Biophysical Research Communications2008,374:559-564.
14. Previti C, Harari O, Zwir I, del Val C:Profile analysis and prediction of tissue-specific CpG island methylation classes.BMC Bioinformatics2009, 10:116.
15. Siepel A, Bejerano G, Pedersen J, Hinrichs A, Hou M, Rosenbloom K, Clawson H, Spieth J, Hillier L, Richards S, Weinstock G, Wilson R, Gibbs R, Kent W, Miller W, Haussler D:Evolutionarily conserved elements in vertebrate, insect, worm, and yeast genomes.Genome Research2005, 15:1034-1050.
16. Bernstein B, Mikkelsen T, Xie X, Kamal M, Huebert D, Cu J, Fry B, Meissner A, Wernig M, Plath K, Jaenisch R, Wagscha A, Feil R, Schreiber S, Lander E:A bivalent chromatin structure marks key developmental genes in embryonic stem cells.Cell2006,125:315-326.
17. Weber M, Hellmann I, Stadler M, Ramos L, Paabo S, Rebhan M, Schubeler D: Distribution, silencing potential and evolutionary impact of promoter DNA methylation in the human genome.Nature Genetics2007, 39:457-466.
18. Eckhardt F, Lewin J, Cortese R, Rakyan V, Attwood J, Burger M, Burton J, Cox T, Davies R, Down T, Haefliger C, Horton R, Howe K, Jackson D, Kunde J, Koenig C, Liddle J, Niblett D, Otto T, Pettett R, Seemann S, Thompson C, West T, Rogers J, Olek A, Berlin K, Beck S:DNA methylation profiling of human chromosomes 6, 20 and 22.Nature Genetics2006, 38:1378-1385.
19. Gardiner-Garden M, Frommer M:CpG islands in vertebrate genomes.
Journal of molecular biology1987,196:261-282.
20. Fan S, Zhang X:CpG island methylation pattern in different human tissues and its correlation with gene expression.Biochemical and Biophysical Research Communications2009,383:421-5.
21. Das R, Dimitrova N, Xuan Z, Rollins R, Haghighi F, Edwards J, Ju J, Bestor T, Zhang M:Computational prediction of methylation status in human genomic sequences.Proc Natl Acad Sci USA2006,22:10713-10716. 22. Fujita P, Rhead B, Zweig A, Hinrichs A, Karolchik D, Cline M, Goldman M,
Barber G, Clawson H, Coelho A, Diekhans M, Dreszer T, Giardine B, Harte R, Hillman-Jackson J, Hsu F, Kirkup V, Kuhn R, Learned K, Li C, Meyer L, Pohl A, Raney B, Rosenbloom K, Smith K, Haussler D, Kent W:The UCSC Genome Browser database: update 2011.Nucleic Acids Res2011,39(Database): D876-82.
23. Schbath S, Prum B, Turckheim E:Exceptional motifs in different Markov chain models for a statistical analysis of DNA sequences.Journal of Computational Biology1995,2:417-437.
24. Karolchik D, Baertsch R, Diekhans M, Furey T, Hinrichs A, Lu Y, Roskin K, Schwartz M, Sugnet C, Thomas D, Weber R, Haussler D, Kent W:The UCSC Genome Browser Database.Nucleic Acids Res2003,31:51-54.
25. Goñi J, Pérez A, Torrents D, Orozco M:Determining promoter location based on DNA structure frst-principles calculations.Genome Biology2007, 8:R263.
26. Chodavarapu R, Feng S, Bernatavichute Y, Chen P, Stroud H, Yu Y, Hetzel J, Kuo F, Kim J, Cokus S, Casero D, Bernal M, Huijser P, Clark A, Kramer U, Merchant S, Zhang X, Jacobsen S, Pellegrini M:Relationship between nucleosome positioning and DNA methylation.Nature Letter2010, 466:388-392.
27. Kaplan N, Moore I, Fondufe-Mittendorf Y, Gossett A, Tillo D, Field Y, LeProust E, Hughes T, Lieb J, Widom J, Segal E:The DNA-encoded
nucleosome organization of a eukaryotic genome.Nature Letter2009, 458:362-366.
28. Yamada Y, Watanabe H, Miura F, Soejima H, Uchiyama M, Iwasaka T, Mukai T, Sakaki Y, Ito T:A comprehensive analysis of allelic methylation status of CpG islands on human Chromosome 21q.Genome Research
2004,14:247-266.
29. Hanahan D, Weinberg R:The hallmarks of cancer.Cell2000,100:57-70. 30. Futreal P, Coin L, Marshall M, Down T, Hubbard T, Wooster R, Rahman N,
Stratton M:A census of human cancer genes.Nature Reviews Cancer2004, 4:177-183.
31. Barski A, Cuddapah S, Cui K, Roh T, Schones D, Wang Z, Wei G, Chepelev I, Zhao K:High-resolution profiling of histone methylations in the human genome.Cell2007,129:823-837.
32. Dobosy J, Selker E:Emerging connections between DNA methylation and histone acetylation.Cell Mol Life Sci2001,58:721-727.
33. Wang Z, Zang C, Rosenfeld J, Schones D, Barski A, Cuddapah S, Cui K, Roh T, Peng W, Zhang M, Zhao K:Combinatorial patterns of histone acetylations and methylations in the human genome.Nature Genetics Letter2008,40:879-903.
34. Agresti A:A survey of exact inference for contingency tables.Proceedings of the National Academy of Sciences USA1992,7:131-153.
35. Turner N:Chi-squared test.Journal of Clinical Nursing2000,9:93. 36. Marsaglia G, Tsang W, Wang J:Evaluating Kolmogorov’s distribution.
Journal of Statistical Software2003,8:1-4.
37. Zhang K, Siino J, Jones P, Yau P, Bradbury E:A mass spectrometric Western blot to evaluate the correlations between histone methylation and histone acetylation.Proteomics2004,4:3765-3775.
38. Jolliffe I:Principal component analysis.Springer-Verlag1986, 487. 39. Koch C, Andrews R, Flicek P, Dillon S, Karaoz U, Clelland G, Wilcox S,
Beare D, Fowler J, Couttet P, James K, Lefebvre G, Bruce A, Dovey O, Ellis P, Dhami P, Langford C, Weng Z, Birney E, Carter N, Vetrie D, Dunham I:The landscape of histone modifications across 1% of the human genome in five human cell lines.Genome Res2007,17:691-707.
40. Irizarry R, Ladd-Acosta C, Wen B, Wu Z, Montano C, Onyango P, Cui H, Gabo K, Rongione M, Webster M, Ji H, Potash J, Sabunciyan S, Feinberg A: The human colon cancer methylome shows similar hypo- and hypermethylation at conserved tissue-specific CpG island shores.Nature Reviews Cancer2009,41:178-186.
41. Nawapen P, Junpen S, Dion H, Michael D, Bernie C, Mongkol T:Different DNA methylation patterns detected by the Amplified Methylation Polymorphism Polymerase Chain Reaction (AMP PCR) technique among various cell types of bulls.Acta Veterinaria Scandinavica2010,52:18.
doi:10.1186/1755-8794-6-S1-S13
Cite this article as:Zhenget al.:CpGIMethPred: computational model for predicting methylation status of CpG islands in human genome. BMC Medical Genomics20136(Suppl 1):S13.
Submit your next manuscript to BioMed Central and take full advantage of:
• Convenient online submission
• Thorough peer review
• No space constraints or color figure charges
• Immediate publication on acceptance
• Inclusion in PubMed, CAS, Scopus and Google Scholar
• Research which is freely available for redistribution