InterconnectIon between nItrIc oxIde
formatIon and hypersensItIvIty parameters
under guInea pIg model of acute asthma
wIth multIple challenges
O. O. ParIlOVa, S. G. ShaNdreNkO
Palladin Institute of Biochemistry, National academy of Sciences of Ukraine, kyiv; e-mail: [email protected]
an immunoregulatory role of nitric oxide (NO) in the development of adaptive immune responses associated with allergic diseases is very important. The present study extended these observations by the examination of the reciprocal changes in characteristic immunologic parameters of the disease and NO level of bronchoalveolar lavage (Bal) cells under guinea pig model of acute asthma with multiple challenges. development of guinea pig Th2 mediated asthma was accompanied by increasing the level of allergic
mark-ers: ovalbumin (OVA) specific IgG and IL-4. We demonstrated that the infiltrate of airway cells contributes to NO synthesis in the respiratory tract during allergic inflammation. The level of intracellular NO formation significantly correlated with plasma allergen specific IgG value in OVA-induced asthma. The presented data evidence that the elevated intracellular NO level in BAL fluid may reflect a nitrosative stress in respiratory
tract in general, when allergic asthma exacerbation is present.
K e y w o r d s: ovalbumin-induced asthma, sensitization, allergic inflammation, nitric oxide, broncho alveolar lavage.
A
sthma, a chronic inf lammatory airway disease, is associated with bronchial hy-perreactivity, tissue remodelling, andre-versible airflow obstruction, which leads to recur
-rent coughing and dyspnea [1]. In general, asthma includes allergic, non-allergic and intrinsic pheno-types. Clinically, allergic asthma is characterized by allergen-induced, IgE-mediated early and late bronchial obstructive reactions, acute and transient airway hyperresponsiveness (AHR) after these
reac-tions and infiltration of inflammatory cells, particu
-larly eosinophils and Th2 type lymphocytes into the airways [2].
Increased generation of reactive nitrogen spe-cies is well documented in asthma [3, 4]. Though nitric oxide (NO) produced in the lungs is an impor-tant regulator of airway events, including modifying airway tone, regulating pulmonary vascular tone, stimulating mucin secretion, modulating mucocil-liary clearance [5]. Statement of NO impact presents an intractable challenge, since both protective and detrimental effects have been extensively reported [6-9]. Under the pathophysiologic process NO, a gas-eous free radical, is generated in the respiratory tract by highly specialized cells of the respiratory
epithe-lium, vascular endothelium and by genuine immune
cells in response to inflammatory cytokines [6, 10,
11]. The detection of 3-nitrotyrosine in the lung of
asthmatic patients provides definitive evidence for numerous biochemical targets of NO that are likely
to have functional consequences in the asthmatic airways. The correlation between high exhaled NO
level and eosinophilic-mediated airway inflamma
-tion in asthmatic patients has been substantially regis tered. Hence, measurement of fraction of NO in exhaled air (FeNO) is recommended as a baseline
pa-rameter of inflammation and corticosteroid respon
-siveness in conjunction with the traditional methods for diagno sing subjects with asthma [11, 12]. Thus, the recognition of NO level determination by inter-national medical community as a valid noninvasive
point-of-care tool for allergic airway inflammation
evaluation is an irrefutable and hard fact.
However, no single model is sufficient to reproduce
accurately a syndrome as complex as asthma to be
[13]. Therefore, to address current knowledge gaps
and to drive a fundamental shift in asthma research
and drug development a tool-kit of clinically relevant
approaches, that build a holistic picture of the disea-se, is to be elaborated. Here, we consider a model of acute asthma with multiple challenges following 32
weeks after sensitization, which mimics those seen
in humans have been exposed to allergen a long peri-od later acquired hypersensitivity. The current study aimed to identify intracellular NO generation under guinea pig model of acute asthma with prolonged pe-riod after allergen sensitization in order to examine the reciprocal changes in characteristic immunologic parameters of disease and NO level formed
imme-diately by inflammatory immune cells infiltrating
airways.
materials and methods
experimental design. Specific pathogen-free
(SPF) outbred male guinea pigs, weighing
300-350 g, were randomly assigned to 3 groups: (I) in
-tact group (normal, n = 6); (II) sensitized animals
(OVA/0.9%NaCl, n = 4); (III) allergic bronchial
asthma group of sensitized animals with the al-lergen challenges (OVA/OVA, n = 6). The animals were housed at a temperature range of 22-24 °C
un-der a 12 h light/dark cycle and were fed a regular
diet. All procedures with animals were performed in accordan ce to requirements of General Ethical
Prin-ciples of Experiments on Animals (Ukraine, 2001).
Sensitization was induced by virtue of the
ad-ministration to albumin from chicken egg (OVA,
Sigma Aldrich, USA) in conjunction with the adju-vant. Procedure was carried out by intraperitoneal
injection (i.p.) of OVA (100 μg per animal) and
Al(OH)3 (Alfarus, Ukraine) (100 mg per animal) dis -persed in 1 ml normal saline. Sensitization was
rein-forced by the second immunization of OVA (100 μg
per animal) and Al(OH)3 (10 mg per animal) in 1 ml saline 4 days later. The animals were used
experi-mentally 32 weeks after sensitization.
Allergen challenges were carried out by
inhala-tion of 0.1% OVA in normal saline for 5 times totally on days 1, 2, 3, 5 and 7. Provocation procedure was
performed for up to 15 min in a transpa rent plastic cage (V = 5 l), in which the guinea pigs could move freely, coupled to compressor nebulizer. In order to counteract tolerance, the exposure duration was de-termined by the appearance of respiratory distress
signs (sneezing, coryza, coughing, deep retrac-tion of the thoracic wall and cyanose). With these conditions, none of the animals expressed
anaphy-lactic shock resulting in lethal outcome. There are
no animals which failed to develop the bronchial asthma clinical symptoms. The sensitized guinea
pigs (OVA/0.9%NaCl) were challenged with aero
-solized normal saline following the same schedule
to exclude unspecific stimulation of the airways by the aerosol droplets. Suggested protocol reflects
the allergen-driven pathway of asthma reproducing several characteristic features, such as airways
in-filtration by inflammatory cells, early (EAR) and
late asthmatic reactions (LAR), AHR [14, 15] and wheezing in separated animals in the end of provo-cation schedule.
Bronchoalveolar lavage fluid collection and
blood processing. Bronchoalveolar lavage (BAL)
fluid samples were collected during LAR, at 18-20 h
after the final challenge. Guinea pigs were anesthe
-tized with thiopental sodium (190 mg/kg guinea pig
weight i.p.) and administered lidocaine injection in
the neck (8 mg/kg guinea pig weight subcutaneous
injection (s.c.). The trachea was exposed and can-nulated. The lungs were gently lavaged for 3 times
with normal saline (1 ml/100 g guinea pig weight). Approximately 77% of the BAL fluid was retrieved. The returning fluid was centrifuged at 500 g for
15 min at 4 °C, BAL cells were resuspended in ster-ile normal saline. Total cell counts were determined using a Neubauer haemocytometer.
Blood was collected from ear Veins to Ep-pendorf tubes containing heparin. Blood was
cen-trifuged for 15 min at 1000 g within 30 min after
collection. The samples were aliquoted and stored at
-20 °C until assaying.
Bal cell viability. Briefly, 106 washed cells per sample were used for ethidium bromide (EtBr, Sig-ma Aldrich, USA) staining. Since EtBr can penetrate inside the cells with integrity disturbance, it selec-tively labels DNA of dead cells in a mixed
popula-tion. The fluorescent dye loading procedure lasted
for 15 min at room temperature in darkness and af
-terwards samples were kept at 4 °C. The EtBr final
concentration in incubation medium was 2.5 µM.
Cell viability in suspension was assessed by flow
cytometry technique.
Immunological markers. OVA specific IgG and IL-4 levels were measured in plasma using a
com-mercial enzyme-linked immunosorbent assay kits
the manufacturer. Absorbance spectra were deter-mined spectrophotometrically by microplate reader
µQuant (Biotek, USA) in the range of (380-600) nm
with the step 5 nm. The absorbance maximum was
set on 450 nm with the reference value at 570 nm.
OVA specific IgG parameter was presented in con
-ventional units (CU). Guinea pig OVA specific IgG content was considered positive when its absorbance value was higher than the index calculated from
ne gative control absorbance: ODsample ≥ (2.1 x
ODnegative) – positive; ODsample ≤ (2.1 x O
Dnega-tive) –negative. IL-4 content was expressed as pi-cogram per milliliter (pg/ml) of plasma. The lower
detection limit is defined as 0.78 pg/ml of IL-4 level.
Intracellular reactive nitrogen species detec-tion. NO production in the living cells was
moni-tored by measurement of triazole fluorescent deriva
-tive DAF-2T formed in the presence of NO and O2
from a non-fluorescent cell permeable 4,5-diamino
-fluorescein diacetate (DAF-2DA, Sigma Aldrich,
USA) [16]. BAL cell suspension was incubated with
10 μM DAF-2DA for 30-40 min at 37 °C in darkness.
BAL cells (106) have been utilized for staining .
In-tracellular NO level was defined using flow
cytomet-ry technique.
Flow cytometry analysis. The inclusion of f luorescent dyes in BAL cells was immediately
exa mined by using of Coulter Epics XL (Beck
-man Coulter, USA), equipped with argon laser,
λex = 488 nm. Intensity of DAF fluorescence from
cells pre-loaded with DAF-2DA was analyzed
at FL1 filter characteri zed by λem = 525 ± 20 nm.
Fluorescence intensity of EtBr staining cells was monitored at FL3 channel transmitting light band
λem = 620 ± 15 nm. The measurement of cytometric
parameters in each separate sample was processed in two parallels. A region (R1) was drawn to exclude cell debris based on forward (FSC) and side (SSC) scatter characteristics. All subsequent analysis was
carried out on R1 gated cells. At least 10000 events
were analyzed. Fluorescence signal alterations were
defined according to fluorescence peak relatively to the marker, which set apart the autofluorescence peak indicating the unstained cells. The results were
graphically presented using “FCS Express V3” (De Novo, USA).
Statistical analysis. All data analysis was done
using statistical package (Statistica version 6.0).
Normality was assessed using graphical plotting of distribution variables within groups. Levene’s median test was used to evaluate the homogeneity
of varian ces. Data were not normally distributed. Therefore nonparametric testing was performed. A value of P < 0.05 was used as the cut-off point for
significance. For two independent groups (Fig. 1a)
Mann-Whitney P(U) test was defined. For multiple independent groups (Fig. 1B, 2–4) reliable changes
were first assessed using Kruskal-Wallis ANOVA
P(F) test and then group comparisons were
car-ried out by post-hoc analysis using Newman-Keul’s
P test, only when the Kruskal-Wallis ANOVA value
was significant. All descriptive data are expressed as median and interquartile range given as [first - third quartiles]. Results in figures are shown in quartile
box plots which indicated quartiles as the ends of
the box; median as the black dot inside box; mini
-mum and maxi-mum as the whiskers extending from
either end of the box. Since data are distributed non-normally, associations between variables were
ex-amined by Spearman rank correlation test.
results and discussion
In order to gain insight into immune response in suggested guinea pig model of allergic asthma
we determined plasma OVA specific IgG in two
time-points after allergen hypersensitivity acquisi-tion. The full development of the immune response
takes up to 4 weeks from allergen injection. Dur
-ing this time, guinea pig OVA specific IgG, as well as IgE, are produced [17]. Here, guinea pig OVA specific IgG was defined at late stages of asthma development, namely 27 weeks later sensitization
and after the last allergen provocation. Obtained
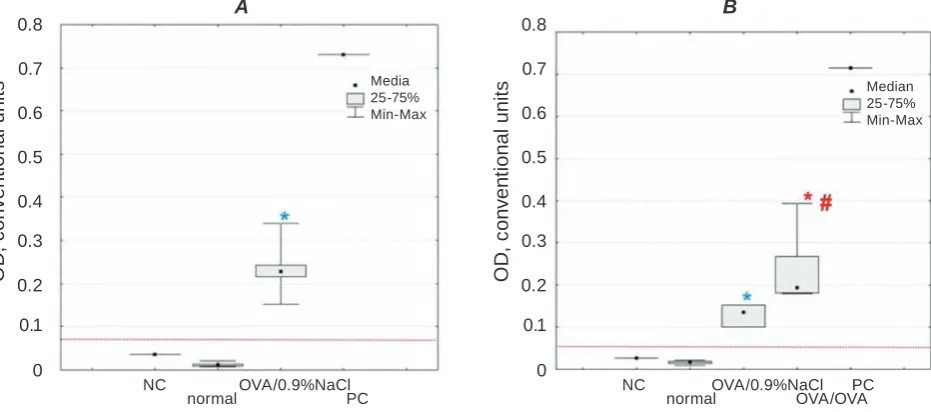
results displayed that even 27 weeks later final immunization plasma OVA specific IgG level in
OVA/0.9%NaCl group strongly differed from nor
-mal group (P(U)=0.0016) shown in Fig. 1a.
Simulta-neously present evidence was confirmed by findings that OVA specific IgG magnitude of OVA/0.9%NaCl animals (0.239[0.216-0.243] CU) largely overcame
the threshold meaning of positive content of allergen
specific IgG, which was equal to 0.076 CU, whereas normal group value (0.013[0.009-0.014] CU) did not exceed threshold. Marked increase in OVA specific
IgG rate was still observed at the end of the
experi-ment (33 weeks after sensitization) in plasma sam
-ples of OVA/0.9%NaCl animals compared to normal
group (P(F) < 0.005; P = 0.0097; Fig. 1B). Moreover, repeated allergen aerosol challenge was
accompa-nied with reliable changes of plasma OVA specific
IgG relatively intact and sensitized animals (OVA/
-ly: P = 0.0003 and P = 0.0092). Here, the threshold
value was 0.057 CU.
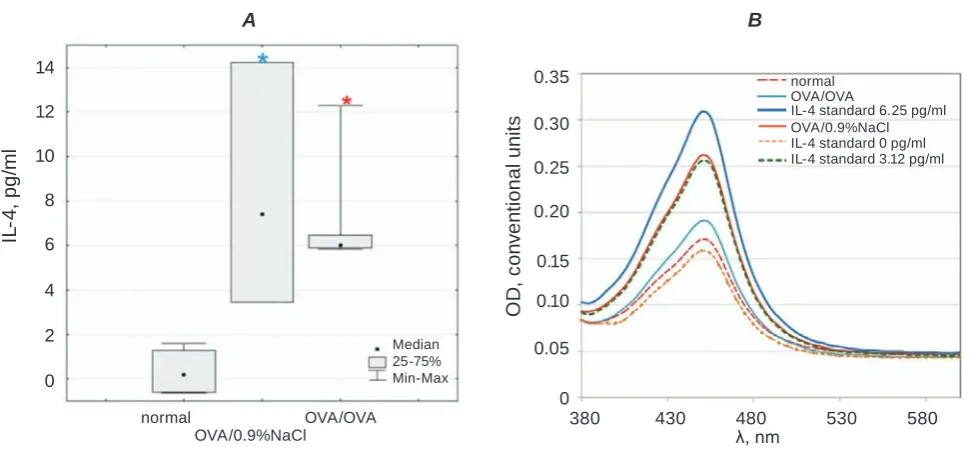
Sensitization to allergen was associated with
the growth of plasma IL-4 content (7.41[3.45–14.24] pg/ml OVA/0.9%NaCl) in comparison with control (0.19[(-0.62)–1.30] pg/ml normal) as demonstrated
in Fig. 2 (P(F) < 0.05; P = 0.019). Slightly reduced,
but still significant IL-4 levels in plasma was pre
-sent after OVA provocations (P(F) < 0.005; nor -mal versus OVA/OVA: P = 0.016). Thus, multiple allergen inhalations resulted in narrowing of IL-4 interquartile range towards a trend to attenuation
respectively sensitized animals (6.01[5.86–6.45] pg/ ml in OVA/OVA versus 7.41[3.45–14.24] pg/ml in OVA/0.9%NaCl). IL-4 is a prime cytokine involved
in allergic sensitization [18]. However, it has been
noted that the cytokine profile in asthma varies with
the number of allergen challenges [19].
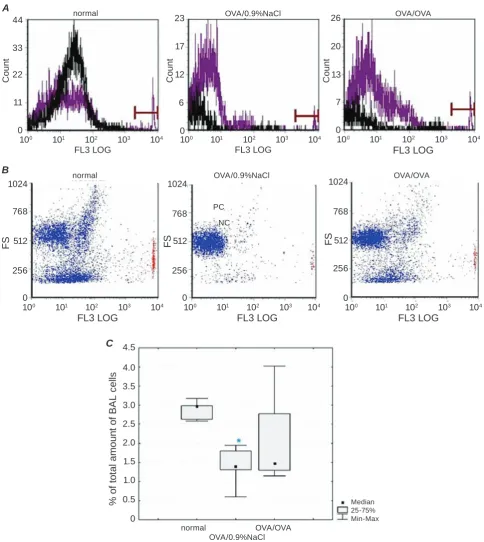
Freshly collected BAL fluid of guinea pigs was assessed for cell survival by flow cytometric quantitation (Fig. 3). Cell death was significantly lower in OVA/0.9%NaCl as compared to normal group (1.39[0.60–1.95] % versus 2.97[2.58–3.18]%;
P(F) < 0.05, P = 0.04), but were not statistical
-ly different from values of the OVA/OVA group
(1.48[1.15–4.03]%). Also no detectable differences
were determined in percentage of dead cells in OVA/ OVA compared to normal animals. In general, value
of cellular viability in BAL fluid is considered to be
high.
In addition to intrinsic shift in immune re-sponse, allergen exposures may also affect NO ho-meostasis. Therefore, we determined NO content
in multi-cellular infiltrate recruited to the airways.
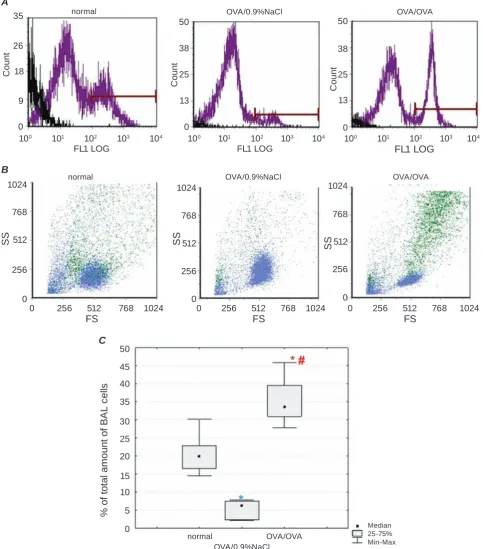
Multiple allergen provocations of sensitized guinea pigs were associated with excessive level of intracel-lular NO generation compared to control and OVA sensitized animals (P(F) < 0.0001; OVA/OVA versus
normal and OVA/0.9%NaCl respectively: P = 0.0002
and P = 0.0001; Fig. 4). Hence the amount of immune
cells producing NO in BAL suspension reached a
significant growth up to 33.50[27.80–45.80]% in
OVA/OVA after allergen challenge exposures. The obtained data agreed with the evidence that allergic
inflammation is accompanied by exaggerated NO
synthesis in the respiratory tract [6, 8, 10]. The in
-creased levels of NO can be explained by NOS over-expression. NOS enzymes are composed of inducib-le NOS (iNOS/NOS2) and of constitutive isoforms: endothelial NOS (eNOS/NOS3) and neuronal NOS
Fig. 1. OVA specific IgG plasma level in guinea pig model of OVA-induced asthma. A – OVA specific IgG
content in plasma samples 27 weeks after sensitization, P(U) < 0.05 (Mann-Whitney test). B – plasma OVA
specific IgG levels in allergic asthma 33 weeks after allergen immunization procedures, P(F) < 0.05
(kruskal-Wallis ANOVA test). PC means positive control, NC – negative control. The threshold between positive and negative signals was marked by a magenta line at both panels. Here and in Fig. 2A, 3C, 4C data are presented as median with 1 and 3 quartiles, maximum and minimum value. Here and in Fig. 2A, 3C, 4C: reliable differences of OVA/0.9%NaCl (*) and OVa/OVa (*) versus normal; reliable differences of OVa/OVa (#) versus
OVA/0.9%NaCl
O
D
, c
o
n
v
e
n
ti
o
nal
u
n
it
s
0.8
0.7
0.6
0.5
0.4
0.3
0.2
0.1
0
NC OVA/0.9%NaCl
normal PC
A
O
D
, c
o
n
v
e
n
ti
o
nal
u
n
it
s
0.8
0.7
0.6
0.5
0.4
0.3
0.2
0.1
0
NC OVA/0.9%NaCl normal OVA/OVAPC
B
Median 25-75% Min-Max Media
(nNOS/NOS1), which basically release moderate NO levels involved in the normal metabolic
func-tions [20]. In patients with asthma, the exogenous
stimuli originate from allergens and environmental pollutants , initiating transcriptional activation of iNOS in the respiratory tract. Abnormally increased iNOS mRNA in protein and high NO output in
pa-tients with asthma are likely due to a continuous transcriptional regulation of the iNOS gene by IFNγ-JAK-STAT-1 protein activation [21].
In the airways of asthmatic patients [22] or in the rodent lung after allergen challenge [23], iNOS expression and/or enzymatic activity in lung tissue
are increased. Hence, our findings concerned NO
synthesis in inflammatory cells infiltrating respirato
-ry tract after allergen challenges complement state-ment, that nitrosative stress in lungs and tracheal smooth muscles is deeply and permanently involved in exacerbation of Th2-mediated asthma. Besides, iNOS-derived NO is produced by genuine immune-system cells including monocytes and macrophages [24], eosinophils [25], neutrophils [26], dendritic
cells [27].
The level of NO containing BAL cells was
ob-served to be strongly reduced to 6.30[2.20–7.82]% in OVA/0.9%NaCl in contrast with normal guinea pigs
(P(F) < 0.0001; P = 0.0002). There is no published
data that have examined direct NO formation within cells of BAL suspension and its distribution in
popu-Fig. 2. Guinea pig IL-4 plasma level under normal condition and OVA-induced asthma. A – content of IL-4 in
guinea pig blood plasma, P(F) < 0.05 (Kruskal-Wallis ANOVA test). B – absorbance spectra of IL-4 plasma
level in the wavelength range λ = 380-600 nm
lations. An important question presents itself: how did the level of intracellular NO become extremely
low after sensitization acquisition? The deficiency of NO synthesis in OVA/0.9%NaCl could be related
to the cellular composition in BAL suspension and regulatory effects mediated by Th2 immune subset after allergen hypersensitivity acquisition. We
iden-tified alterations in cellularity of BAL fluid in de
-pend of the experimental group as indicated in FACS density graphs (Fig. 5). This indicates redistribution of immune subpopulations in general pool of cells
infiltrating respiratory tract at each next phase of
asthma development (normal – immune response
in balance, OVA/0.9%NaCl – sensitization to anti
-gen, OVA/OVA – allergic inflammation induced by
airway hyperresponsiveness). Moreover, all guinea
pigs in OVA/0.9%NaCl group expressed distinctive
cellular composition clearly differed from those in normal and OVA/OVA. Considering Th2-mediated
regulatory networks, iNOS-suppressing activities of IL-4 and IL-10 are well established. IL-4 induced
GATA-3 allows the stable commitment to the Th2
phenotype through promotion of Th2 cytokine pro
-duction, such as IL-4, IL-5, IL-10 and IL-13 [28]. IL-10 produced by Th2 cells further suppresses Th1 development by inhibiting secretion of IFN-γ and
IL-12. It may also directly inhibit the induction of
iNOS [29], since IFN-γ is the most potent and pre
-vailing inducer of iNOS in vivo [30].
IL-4
, p
g
/m
l
14
12
10
8
6
4
2
0
OVA/0.9%NaCl normal
A
O
D
, c
o
n
v
e
n
ti
o
nal
u
n
it
s
0.35
0.30
0.25
0.20
0.15
0.10
0.05
0
380 430 480 530 580
B
Median 25-75% Min-Max
OVA/OVA
λ, nm
OVA/OVA
OVA/0.9%NaCl normal
IL-4 standard 6.25 pg/ml
Fig. 3. Differentiation of viable and dead cells in bronchoalveolar lavage fluid of guinea pigs under normal condition and OVA-induced asthma. A – flow cytometry histograms of BAL cell viability. Histograms present a gate, which separates the cells labeled by EtBr (count – number of events, FL3LOG – relative fluorescence intensity of red spectrum in log scale). Purple and black curves match to the sample incubated with fluorescent dye and its unstained control (here and Fig. 4A). B – distribution of dead cells depending on size in BAL sus
-pension. EtBr labeled cells are colored in red. C – quantative analysis of cell death in guinea pig BAL fluid,
P(F) < 0.05 (Kruskal–Wallis ANOVA)
NC
OVA/0.9%NaCl
PC
OVA/OVA
F
S
1024
768
512
256
100 101 102 103 104
FL3 LOG normal
0
F
S
1024
768
512
256
100 101 102 103 104
FL3 LOG
0
100 101 102 103 104
FL3 LOG
F
S
1024
768
512
256
0
B
C
o
u
nt
44
33
22
11
100 101 102 103 104 FL3 LOG
0
normal
A OVA/0.9%NaCl OVA/OVA
100 101 102 103 104 FL3 LOG
100 101 102 103 104
FL3 LOG
C
o
u
nt
23
17
12
6
0
C
o
u
nt
26
20
13
7
0
C
% o
f t
o
ta
l a
m
o
u
n
t o
f B
A
L c
e
lls
4.0
3.5
3.0
2.5
2.0
1.5
1.0
0.5
0 4.5
OVA/0.9%NaCl OVA/OVA normal
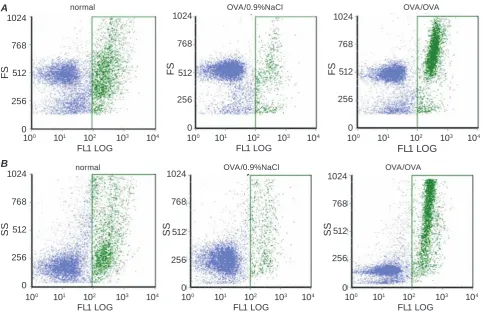
Fig. 4. Intracellular NO content in BAL fluid of guinea pigs under normal condition and OVA-induced asthma. A – flow cytometry histograms of NO formation in the immune cells derived from guinea pig BAL fluid. Histo
-grams present a gate, which separates the cells labeled by fluorescent dye (here and Fig. 5: FL1LOG – relative fluorescence intensity of green spectrum in log scale). B – cell types in BAL fluid based on the morphological flow cytometric parameters side scatter (SS) versus forward scatter (FS) are illustrated in color dot plots. DAF-2DA stained cells are colored in green here and in Fig. 5. C – levels of NO generating cells in infiltrate
recruited to the lower respiratory tract: quantative analysis, P(F) < 0.05 (Kruskal-Wallis ANOVA)
C
o
u
nt
35
26
18
9
100 101 102 103 104 FL1 LOG
0
normal A
OVA/0.9%NaCl
100 101 102 103 104 FL1 LOG
C
o
u
nt
50
38
25
13
0
OVA/OVA
100 101 102 103 104
FL1 LOG
C
o
u
nt
50
38
25
13
0
OVA/0.9%NaCl OVA/OVA
SS
1024
768
512
256
0 256 512 768 1024
FS normal
0
SS
1024
768
512
256
0
SS
1024
768
512
256
0
B
0 256 512 768 1024
FS
0 256 512 768 1024
FS
C
% o
f t
o
ta
l a
m
o
u
n
t o
f B
A
L c
e
lls
45
35
30
25
20
15
10
5
0 50
OVA/0.9%NaCl OVA/OVA normal
It is also important to consider BAL cellular NO homeostasis not in isolation but in the context of characteristic allergic asthma parameters. We have noticed that the substantial drop in percentage of NO containing BAL cells corresponded with
reli-ably increased IL-4 plasma level in OVA/0.9%NaCl
guinea pigs. However, in allergic inflammation in
-duced by repeated antigen provocations significant
enlargement of intracellular NO value was
accompa-nied with significant IL-4 plasma level. High levels
of NO generated by iNOS prevent overexpansion of
Th1 cells [7]. NO markedly inhibits IL-2 production
though impairment of IL-2 promoter induction, and increases the production of IL-4 by effector T cells [31]. Presented observations gives evidence that NO selectively inhibits the expansion of Th1 cells by a
negative feedback mechanism and thus indirectly
promotes formation of Th2 immune subset. No
sta-tistically significant correlation was observed be
-tween intracellular NO level in BAL cells and IL-4 plasma content. Although IL-4 was seen as the
cru-cial cytokine in asthma, its production is transient
Fig. 5. NO formation depending on size (panel a) and granularity (panel B) in cell subpopulations derived
from guinea pig BAL fluid A
SS
1024
768
512
256
100 101 102 103 104 FL1 LOG
normal
0
B
100 101 102 103 104 FL1 LOG
normal
F
S
1024
768
512
256
0
OVA/0.9%NaCl
100 101 102 103 104 FL1 LOG
F
S
1024
768
512
256
0
OVA/OVA
100 101 102 103 104
FL1 LOG
F
S
1024
768
512
256
0
OVA/0.9%NaCl
SS
1024
768
512
256
0
100 101 102 103 104 FL1 LOG
OVA/OVA
SS
1024
768
512
256
0
100 101 102 103 104 FL1 LOG
[32]. It means that cumulatively, IL-4 is considered critical during the onset of the disease phenotype and may be overlapped in later stages of
pathoge-nesis. These are in line with our findings concer ning absence of correlation, since the IL-4R α chain is
a common component of both the IL-4R and the IL-13R. However, the reverse is not true: T-cells re-spond to IL-4 but not to IL-13 [33].
Antigen-specific IgE production, with
sub-sequent fixation of IgE to FcεRI receptors on mast
cells derived from guinea pig BAL fluid correlated in direct ratio with plasma OVA specific IgG content
(P = 0.0365; r = 0.7381).
To summarize, the identification of NO forma
-tion and hypersensitivity parameters under guinea pig model of acute asthma with multiple challenges revealed interrelation between characteristic im-munologic parameters of the disease and NO levels
formed immediately by inflammatory immune cells infiltrating airways. In the present experimental model of bronchial asthma significant association between plasma OVA specific IgG value and level of
NO generating cells derived from guinea pig BAL
fluid was detected. Here we demonstrated that NO formation in cellular infiltrate recruited to the lower
respiratory tract is transformed from reduced to exag gerated level during Th2-dominated immune reaction in the presence of sensitization. In view of
these findings, we infer that in asthma excessive NO
generation is maintained not only due to increased iNOS protein expression and activity in lung tissue cells, but also due to NO synthesis in multicellular
airway infiltrate recruited to trigger organ during allergic inflammation. Therefore high BAL levels of NO may reflect circulating nitrosative stress in
respiratory tract when exacerbation in asthma is
pre-sent. Taken together with the known Th1-mediated feedback regulation of iNOS, our results corroborate
the viewpoint that NO derived from lower respira-tory tract is a direct signal of the Th2-mediated
pro-inflammatory cytokine mechanisms of central im
-portance in the pathophysiology of allergic airway
inflammation.
ВЗАЄМОЗВ’ЯЗОК УТВОРЕННЯ ОКСИДУ АЗОТУ ТА ПОКАЗНИКІВ ГІПЕРЧУТЛИВОСТІ ЗА ГОСТРОЇ МОДЕЛІ БРОНХІАЛЬНОЇ АСТМИ МУРЧАКІВ ІЗ МНОЖИННИМИ ПРОВОКАЦІЯМИ
О. О. Парілова, С. Г. Шандренко
інститут біохімії ім. о. В. палладіна нан України, київ;
e-mail: [email protected]
імунорегуляторна роль оксиду азоту (NO) в розвитку набутих імунних відповідей,
асоційованих із алергічними захворювання
-ми, є дуже важливою. У представленій роботі досліджували взаємні зміни імунологічних
параметрів, які характеризують захворюван
-ня, та зміну рівня NO в клітинах бронхоаль
-веолярного лаважу (BAL) за гострої моделі
бронхіальної астми мурчаків із множинни
-ми провокація-ми алергену. розвиток
Th2-опосередкованої астми мурчаків супроводжу
-вався зростанням рівня алергічних маркерів: овальбумін (OVA)-специфічного IgG та IL-4. показано, що інфільтрат клітин дихальних шляхів доповнює синтез NO в респіраторному тракті під час алергічного запалення. рівень генерації внутрішньоклітинного NO істотно корелював зі значеннями алергенспецифічного
IgG у плазмі крові за OVA-індукованої аст
-ми. наведені дані свідчать, що підвищений рівень внутрішньоклітинного NO в BAL може
відображати в цілому нітрозативний стрес ди
-хальних шляхів у разі загострення алергічної астми.
к л ю ч о в і с л о в а: овальбумініндуко-вана астма, сенсибілізація, оксид азоту, алергічне запалення, бронхоальвеолярний лаваж.
ВЗАИМОСВЯЗЬ ОБРАЗОВАНИЯ ОКСИДА АЗОТА И ПОКАЗАТЕЛЕЙ ГИПЕРЧУВСТВИТЕЛЬНОСТИ НА ОСТРОЙ МОДЕЛИ БРОНХИАЛЬНОЙ АСТМЫ МОРСКИХ СВИНОК
С МНОЖЕСТВЕННЫМИ ПРОВОКАЦИЯМИ
Е. А. Парилова, С. Г. Шандренко
институт биохимии им. а. В. палладина нан Украины, киев;
e-mail: [email protected]
иммунорегуляторная роль оксида азота
(NO) в развитии приобретенных иммунных от
-ветов, ассоциированных с аллергическими за
-болеваниями, очень важна. В представленной
работе исследовали взаимные изменения имму
-нологических показателей, характеризующих заболевание, и изменение уровня NO в клетках бронхоальвеолярного лаважа (BAL) на острой модели бронхиальной астмы морских свинок с множественными провокациями аллергена. развитие Th2-опосредованной астмы морских свинок сопровождалось увеличением уровня аллергических маркеров: овальбумин
(OVA)-специфического IgG и IL-4. показано, что кле
-точный инфильтрат дыхательных путей допол
аллергического воспаления. Уровень генерации внутриклеточного NO значимо коррелировал с показателями аллергенспецифического IgG
в плазме крови при OVA-индуцированной аст
-ме. приведенные данные свидетельствуют, что повышенный уровень внутриклеточного NO в BAL может отражать в целом нитрозативный
стресс дыхательных путей при обострении ал
-лергической астмы.
к л ю ч е в ы е с л о в а: овальбумининду
-цированная астма, сенсибилизация, оксид азота, аллергическое воспаление, бронхоальвеоляр
-ный лаваж.
references
1. Rennard S. I., Farmer S. G. Exacerbations and Progression of Disease in Asthma and Chronic Obstructive Pulmonary Disease. Proc. am. Thorac Soc. 2004;1(2):88-92.
2. Cockroft D. W., Davis B. E. Mechanisms of
airway hyperresponsiveness. J. Allergy Clin. Immunology. 2006;118(3): 551-559.
3. Andreadis A. A., Hazen S. L., Comhair S. A., Erzurum S. C. Oxidative and nitrosative events in asthma. Free radic. Biol. Med. 2003;35(3):213-235.
4. Lane C., Knight D., Burgess S., Franklin P., Horak F., Legg J., Moeller A., Stick S. Epithelial
inducible nitric oxide synthase activity is the major determinant of nitric oxide concentration in exhaled breath. Thorax. 2004;59(9):757-760. 5. Stuehr D. J. Mammalian nitric oxide synthases.
Biochim. Biophys. acta. 1999;1411(2-3):217–230. 6. Bogdan C. Nitric oxide and the immune response.
Nat. Immunol. 2001;2(10):907-916.
7. Kolb H., Kolb-Bachofen V. Nitric oxide in
autoimmune disease: Cytotoxic or regulatory mediator? Immunol. Today. 1998;19(12):556-561.
8. Suschek C. V., Schnorr O., Kolb-Bachofen V. The role of iNOS in chronic inflammatory processes
in vivo: Is it damage-promoting, protective, or active at all? Curr. Mol. Med. 2004;4(7):763-775.
9. Guzik T. J., Korbut R., Adamek-Guzik T. Nitric oxide and superoxide in inflammation and
immune regulation. J. Physiol. Pharmacol.
2003;54(4):469-487.
10. Ricciardolo F. L., Sterk P. J., Gaston B., Folkerts G. Nitric Oxide in Health and Disease
of the Respiratory System. Physiol. rev.
2004;84(3):731-765.
11. Warner R. L., Paine R., Christensen P. J.,
Marletta M. A., Richards M. K., Wilcosen S. E., Ward P. A. Lung sources and cytokine
requirements for in vivo expression of inducible nitric oxide synthase. Am. J. Respir. Cell. Mol. Biol. 1995;12(6):649-661.
12. Barnes P. J., Dweik R. A., Gelb A. F. Exhaled nitric
oxide in pulmonary diseases: a comprehensive review. Chest. 2010;138(3):682-692.
13. Dweik R. A., Boggs P. B., Erzurum S. C.,
Irvin C. G., Leigh M. W., Lundberg J. O., Olin A. C., Plummer A. L., Taylor D. R.
An official ETS clinical practice guideline:
interpretation of exhaled nitric oxide levels (FeNO) for clinical applications. am. Jour. resp.
Crit. Care. Med. 2011;184:602-615.
14. Akkoc T. animal models of asthma. Marmara
Pharm. J. 2010;14:104-111.
15. Smith N., Broadely K. J. Optimization
of the sensitization conditions for an ovalbumin challenge model of asthma. Int. Immunopharmacol. 2007;7(2):183–190.
16. Strijdom H., Muller C., Lochner A. Direct intracellular nitric oxide detection in isolated
adult cardiomyocytes: flow cytometric analysis using the fluorescent probe, diaminofluorescein.
J. Mol. Cell. Cardiol. 2004;37(4):897-902. 17. Meurs H., Santing R. E., Remie R. A guinea
pig model of accute and chronic asthma using permanently instrumented and unrestrained animals. Nat. Protoc. 2006;1(2): 840-847.
18. Dusch A., Müller T., Sebald W. Antagonistic
mutant proteins of interleukin-4. Behring Inst.
Mitt. 1995;(96):87-94.
19. Di Valentin E., Crahay C., Garbacki N., Hennuy B., Gueders M. New asthma biomarkers:
lessons from murine models of acute and chronic asthma. Am. J. Physiol. Lung Cell. Mol. Physiol.
2009;296(2):185-197.
20. Ghosh S., Erzurum S. Nitric oxide metabolism
in asthma pathophysiology. Biochim. Biophys. acta. 2011;1810(11):1008-1016.
21. Guo F. H., Comhair S. A., Zheng S., Dweik R. A.,
Eissa N. T., Thomassen M. J., Calhoun W., Erzurum S. C. Molecular mechanisms of increased nitric oxide (NO) in asthma: evidence for transcriptional and post-translational regulation of NO synthesis. J. Immunol.
2000;164911):5970-5980.
Bousquet J., Godard P., Holgate S., Polak J. M.
Induction of nitric oxide synthase in asthma. lancet. 1993;342(8886-8887):1510-1513.
23. Xiong Y., Karupiah G., Hogan S. P., Foster P. S.,
Ramsay A. J. Inhibition of allergic airway
inflammation in mice lacking nitric oxide
synthase 2. J. Immunol. 1999;162(1):445-452. 24. Xie Q. W., Cho H. J., Calaycay J., Mumford R. A.,
Swiderek K. M., Lee T. D., Ding A., Troso T.,
Nathan C. Cloning and characterization of inducible nitric oxide synthase from mouse macrophages. Science. 1992;256(5054):225-228. 25. del Pozo V., de Arruda-Chaves E., de Andrés B.,
Cárdaba B., López-Farré A., Gallardo S., Cortegano I., Vidarte L., Jurado A., Sastre J., Palomino P., Lahoz C. Eosinophils transcribe and translate messenger RNA for inducible nitric oxide synthase. J. Immunol. 1997;158(2):859-864.
26. Webb J. L., Polak J. M., Evans T.J . Effect of
adhesion on inducible nitric oxide synthase
production in purified human neutrophils. Clin.
exp. Immunol. 2001;123(1):42–48.
27. Lu L., Bonham C. A., Chambers F. G., Watkins S. C., Hoffman R.A., Simmons R. L.,
Thornson A. W. Induction of nitric oxide synthase in mouse dendritic cells by IFN-gamma, endotoxin, and interaction with allogeneic T cells: nitric oxide production is associated with dendritic cell apoptosis. J. Immun. 1996;157(8):3577-3586.
28. Ouyang W., Ranganath S.H., Weindel K.,
Bhattacharya D., Murphy T. L., Sha W. C.,
Murphy K. M. Inhibition of Th1 development
mediated by GATA-3 through an IL-4-independent mechanism. Immunity.
1998;9(5):745-755.
29. Curran A. D. The role of nitric oxide in the development of asthma. Int. arch. allergy Immunol. 1996;111(1):1-4.
30. Uetani K., Thomassen M. J., Erzurum S. C.
Nitric oxide synthase 2 through an autocrine loop via respiratory epithelial cell-derived mediator. Am. J. Physiol. Lung Cell. Mol. Physiol. 2001;280(6):1179-1188.
31. Chang R. H., Feng M. H., Liu W.H., Lai M. Z.
Nitric oxide increased interleukin-4 expression
in T lymphocytes. Immunology. 1997;90(3):364-369.
32. Zurawski G., de Vries J. E. Interleukin 13, an interleukin 4-like cytokine that acts on
monocytes and B cells, but not on T cells. Immunol. Today. 1994;15(1):19-26.
33. Kopf M., Le Gros G., Bachmann M., Lamers M. C., Bluethmann H., Kohler G. Disruption of the murine IL-4 gene blocks Th2
cytokine responses. Nature.
1993;362(6417):245-248.
34. Nacher M., Singhasivanon P., Kaewkungwal J., Silachamroon U., Treeprasertsuk S.,
Tosukho-wong T., Vannaphan S., Looareesuwan S. Relationship between reactive nitrogen intermediates and total immunoglobulin E, soluble CD21 and soluble CD23: comparison between cerebral malaria and nonsevere malaria. Parasite Immunol. 2002;24(8):395-399.
35. al-Laith M., Weyer A., Havet N., Dumarey C., Vargaftig B. B., Bachelet M. Immunoglobulin-G-dependent stimulation of guinea pig lung mast cells and macrophages. allergy. 1993;48(8):608-614.