A Fast Localization and Feature Extraction Method
Based on Wavelet Transform in Iris Recognition
Samira Kooshkestanii, Hamed Sadjediii, Mohammad Pooyaniii
i S. Kooshkestani is with the engineering department, Shahed University, Tehran, Iran (e-mail:[email protected]), ii H. Sadjedi is with the engineering department, Shahed University, Tehran, Iran (e-mail:[email protected])
iii M. Pooyan is with the Engineering Department, Shahed University, Tehran, Iran (e-mail:[email protected])
ABSTRACT
With an increasing emphasis on security, automated personal identification based on biometrics has been receivingextensive attention. Iris recognition, as an emerging biometric recognition approach, is becoming a very activetopic in both research and practical applications. In general, a typical iris recognition system includes iris imaging, iris liveness detection, and recognition. This research focused on the last issue and describes a new scheme for iris recognition. This paper proposes a new method to find the inner boundary of the Iris for localizing its area in the eye images. The proposed method besides having higher speed and lower calculation cost and simplicity, has got an acceptable precision for internal boundary localizing the proposed algorithm for feature extraction, characterizing the important information via biorthogonal wavelet and experimental results show that the proposed method has anencouraging performance.
KEYWORDS
Biometrics, iris recognition, localizing, feature extraction
1. INTRODUCTION
Biometrics are systems for identification and verification of people. Any individual and distinctive, robust and measurable physiological or behavioral characteristic which can be used for automatic identification or verification is called biometrics [1], [2].
Among biometrics, iris scan systems are foolproof and have got very high confidence because of iris stability specifications and also the iris pattern individuality, which cannot be copied artificially [3]. Iris is the colored part of the eye and lies in dorsal part of the cornea. Iris structure starts forming in the 3rd month of fetal period. [4] This body organ is the single internal organ which normally can be seen from outside of the body. Each iris has got a complicated individual pattern that makes a complete
difference between left iris and right iris in one person. It is claimed that iris scan systems are foolproof, because, it is impossible to copy iris artificially due to particulars and numbers of its measurable specifications.
Generally, an iris recognition system is divided into four parts. In the first part, a sequel of eye images is captured, then in the second part, the localization is performed and in the third part, extraction of specification is done and iris code is gained and finally in the fourth
part the comparison is performed [5].
In this cae, different algorithms are presented. The proposed method by Daugman for iris localization is based on finding two internal and external boundaries. In this method Daugman has used an integral-differential operator. Then for feature extraction he projected the image on to a bank of 2D Gabor wavelets and took the sign of the real and imaginary results and encoded in a 20416-bit binary vector. Finally matching is performed using the Hamming Distance [6], [1], [7],[8]. Wildes uses Hough Transform to localize the iris. For the feature extraction he used Laplacian pyramids and 4-level resolutions. His algorithm relies on image registration and matching which requires many computations [5], [9].
Boles' prototype [10] operates in building a one-dimensional representation of the gray level profiles of the iris. He used zero-crossing of 1D wavelet transform of the resulting representation.
Lim et al. used 2D Haar wavelet and quantized the 4th level high frequency information to form a 167-binary code length as feature vector and applied a LVQ neural network for classification. A modified Haralick’s co-occurrence method with multilayer perceptron is also introduced for extraction and classification of the irises [11], [12].
Tieniu Ttan et al. used multi channel gabbor filter for feature extraction. [11], [12].
Park et al. used a directional filter bank to decompose an iris image into eight directional subband outputs and extracted the normalized directional energy as features. Iris matching was performed by computing Euclidean distance between the input and the template feature vectors [13].
Boles' prototype operates in building a one-dimensional representation of the gray level profiles of the iris. He used zero-crossing of 1D wavelet transform of the resulting representation [10], [11].
Avila and reillo developed the iris representation method by Boles et.al., They made an attempt to use different similarity measures for matching, such as Euclidean distance and hamming distance [3], [14].
Hanho Sung and his team localized iris in between of internal boundary (iris and pupil boundary) and collarette2 in order to reduce inessential levels of process in specification extraction and incrementing recognition rate [15].
Another method which was proposed by Dal Ho Cho and his team reduces process time in cellular phone applications and is based on finding two internal and external iris boundary using brightness changes and image individuality [13].
In this paper a new method based on wavelet transform is proposed for iris recognition. For localization a new method is presented to find internal iris boundary which has got appropriate accuracy and acceptable procedure results. Meanwhile, the algorithm and acquired functions are simpler, speed of localizing is increased much more and the calculation cost is also decremented.
The proposed algorithm for feature extraction, Characterizing the important information via biorthogonal wavelet and experimental results show that the proposed method has an encouraging performance.
2. METHOD AND MATERIALS
In this research, data bank is chosen from CASIA1 data set [16] which includes 7216 images of 104 different eyes with 7 images from each eye. Images were taken in two sessions in first session three images and in second session four images have been captured. Time period for
2
External visible layer of iris contains two regions which are different in colors, external eyelash region and internal pupil region that are separated by collarette (zigzag shaped).
getting images is one month and the resolution is 320 × 2160.
All simulations of this article are performed by a Pentium (R) D CPU 3.00 GHz and 1.00 GB of RAM and MATLAB 7.4 as software.
2.1. Proposed method for finding internal iris boundary Generally, proposed method can be divided into three steps. The first step is to compress the image; the second step is finding boundary points and the third step is to estimate center and radius of pupil.
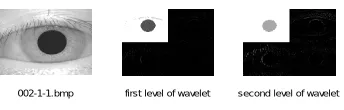
Pupil is a dark area with low frequency, thus at first Haar wavelet is used to compress the image [17] and then by using coefficients of second order approximation, pupil is localized and therefore, center coordinates and radius are transferred into original image.
002-1-1.bmp first level of wavelet second level of wavelet
Figure 1: From left to right, original image, image compressed by first level of wavelet, image compressed by the second level of wavelet.
To find the boundary points, an initial estimation of pupil center is performed. In this case, compressed image projections (Figure1) are calculated in horizontal and vertical directions (equation below) and because pupil is darker than other areas, coincided coordinates with lowest image intensity is a proper estimation for pupil center:
∑
∑
= =
x p
y p
y x I Y
y x I X
)) , ( min( arg
)) , ( min( arg
(1)
Perpendicular bisector of each hypotenuse has two properties, it is perpendicular to the hypotenuse so, its slope is inverse and opposite in sign to the slope of that hypotenuse and second, it crosses from middle point of the hypotenuse. Therefore, by knowing the slope and a point on the perpendicular bisector line, the line equation can be found by analytic geometry relations:
1 2 1 2 tan ) ( tan y y x x y x x
y m m
− − − = + − = θ θ (2)
In these equations, x1, x2, y1 and y2 are the coordinates
of the selected points and xm and ym are the coordinates of
hypotenuse middle point.
To find the precise location of the center, these three points were rotated on the circle and considered more perpendicular bisectors. Therefore, many points were found as the centers from each bisectors and the mean values of the x and y coordinates of these centers is considered as main center coordinates.
Selected approach in rotation is strated by extraction of the parameter N as minimum distance between two left and right pupil boundaries (xp, yp). Selection of minimum
distance as N, guarantees that these rotations are occurred only inside the circle and points on the boundary are selected as follows:
N i i N yp y i N y y down p up 2 , , 2 , 1 … = + − = + + = (3)
Xup and Xdown are selected as the correcponding
points of the Yup and Ydown in X coordinates in half circles of pupil. To choose those three points, for each point of the upper half circle, two points from lower half circle were considered as follows:
N i N N i rem n N N i rem n 2 , , 2 , 1 ) 2 , 2 3 ( ) 2 , 2 ( 2 1 … = + = + = (4)
n1 and n2 determine the rotation value inside the
circle. ) 2 ( ), 2 ( ) 1 ( ), 1 ( ) ( ), ( 3 3 2 2 1 1 n y y n x x n y y n x x i y y i x x down down down down up up = = = = = = (5)
Now, for each set of three points (x1, y1), (x2, y2) and
(x3,y3), centers are calculated as explained before.
Therefore, a vector of centers is extracted that the mean value of this vector is considered as the main center.
Main center is used as the pupil center, so, by calculating the distance between the center (after mapping on the original image) and a point on the original image edge, the radius will be calculated.
2 1 2
1) ( )
(x x y y
r= p − + p− (6)
Because of rotation of the points on the circle, various radius values are extracted depends on various centers and the mean value of these radiuses is considered as the pupil radius. It can be seen that no complex equation transformation used in our proposed method and localizing algorithm has been simplified.
Moreover than observation with eyes which is a qualitative criterion, for evaluation of the precision and accuracy of the results, after extracting relevant circle to pupil, percentage of existing iris in the pupil circle and percentage of existing pupil in the iris space is considered as a criterion for quantitative evaluation of pupil localization. 100 × = pupil pixel of total pupil in pixel white number pupil in iris error 100 × = pupil pixel of total iris in pixel black number iris in pupil error (7)
2.2. Proposed method for feature extraction
For feature extraction, at first biorthogonal wavelet is used for decomposition. This family of wavelet extract local and global feature for iris recognition [18]. Furthermore, local extremums in the wavelet transform results correspond to sharp intensity variations in original signal [4]. Based on this property of the selected wavelet transform, after the segmentation, normalization and quality enhancement of the image, biorthogonal 2-D wavelet applied on represented normalized signal. It can be shown that approximation coefficient of first level has rich information of local sharp variation.
Figure 2: Decomposed image in the first level and approximation coefficient.
Because of the special importance of sharp variations in iris image as feature and the corresponding position of
first level of wavelet
them, average of approximation coefficient was substracted from the total approximation coefficient to grow up the contrast. By this idea, variations became sharper. Finally, this coefficient is recorded in a vector as the proposed feature. Matrices of feature will be calculated as the following form:
F= 2D approximation coeff. level 1
-Mean (2D approximation coeff. level 1) (8) Based on our proposed method, by this type of using the wavelet transform, local variations in the iris image are represented better than in the original image and the approximation coefficients can be considered as a model of the original image and be used for matching.
2.3. Proposed method for matching
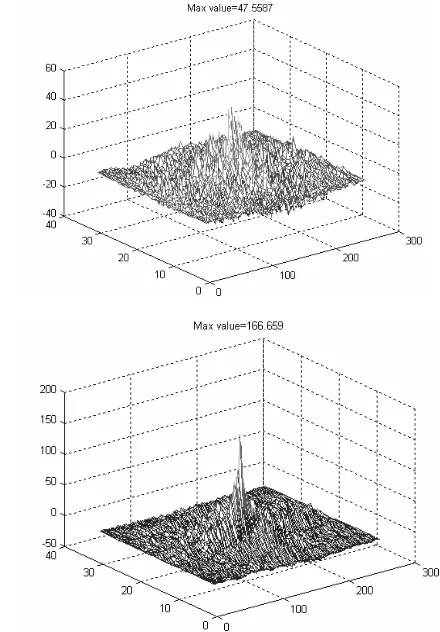
For the matching part of the iris recognition, cross correlation functions between the extracted feature vector of the iris images are copmuted. As shown in the following figures, the intra class cross correlation function has the sharper peak than inter class cross correlation function and the peak value of the function increases depending on the similarity of two image model (Figure 3).
Figure 3: The correlation between two features from intra class (down) and inter class (upper). The max value for intra class is 166.659 and for inter class is 47.55167.
In this paper three indexes are defined for matching.
Peak value of the cross correlation function that estimates the similarity between two deference irises used as the first index. By increasing the likelihood of two irises, the cross correlation function become sharper and by rotation of cross correlation function, it can be easily seen that the variation along column is more than the row. This is expectable, because in iris images, variations along the angle are more than in radius.
Figure 4: Rotation correlation transform for inter class, with radial (down) with angular (upper).
The second index that is used for likelihood estimation is peak value of the correlation ratio to mean value of the row which contain that peak.
(Peak to mean of the Row’s Peak Ratio)
Peak s Row of Mean
Peak PMRR
'
=
(9)
Peak correlation ratio to the mean is the 3rd index which is used to estimate the similarity
(Peak to Mean Ratio)
Mean Total
Peak PMR=
2.4. Performance evaluation of the proposed method for feature extraction
In this paper, Fisher criterion is used for discriminate analysis [19]. The basic form of Fisher criterion is re-lasted to the two-class case and it can be expressed with the following formula:
2 2 2 1
2 2 1 2 2 2 1 2 1
)
(
)
,
,
,
(
σ
σ
η
η
σ
σ
η
η
+
−
=
f
(11)where
(
,
,
,
)
2 2 2 1 2
1
η
σ
σ
η
are mean and variance forfeature’s intra class and inter class, respectively.
For calculation of the FRR (the probability of an authorized subject being incorrectly rejected), we have considered 6 images from each class for training and 1 images for testing.
Intra-class matching is done for every 7 images so a
7
7
×
matrices is generated. Mean of each row iscomputed. The threshold for acceptance or rejection can be expressed with following formula:
) 6 / 5 * )) ( * 6 / 1 ) (
min((meanmatrice diagmatrice
thereshold= −
(12) Where matrices is index matrix for intra-class comparison. Finally, the least mean’s row is used as the threshold for acceptance or rejection and the mean of seventh row is compared with this threshold. If it is more than threshold, then it will be accepted, otherwise it will be rejected
.
⎩ ⎨
⎧ 〈
=
else
thereshold mean
if error
0
) 6 : 1 , 7 ( 1
(13)
In other words, an adaptive threshold is used that changes its value for each class.
For calculating the FAR (the probability of accepting an imposter as an authorized subject) our test algorithm is as follows:
20 percent of the total data is considered for testing and 100 samples from another classes are randomy selected as test vector for each class. Because we have 75 class so there will be 7500 sample for testing. After the calculation of the PMR value with each element in a class, mean of PMR is calculated. Each element in the test vector does not belong to the class if mean of PMR’s sample test is more than specific threshold’s class and an error has been occrued. Furthermore, the value of threshold in the Equal Error Rate (EER) is used as a constant threshold and then FAR and FRR error will be computed by constant threshold. Finally the result of the two methods will be compared with each other.
3. RESULTS
In this research, data bank is chosen from CASIA1 data set [16] which includes 7216 images of 104 different eyes with 7 images from each eye and images were taken in two sessions which in the first session three images and in second session four images have been captured. Time period for getting images is one month and the resolution is 320 × 2160.
The images shown below illustrate the pupil extraction by mentioned algorithm in 002_1_1 and 014_2_4 pictures.
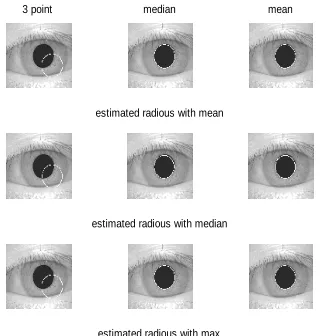
Three methods for extracting center with three methods for selecting radius are compared with each other. Totally, there will be 9 images which in these images extracted pupil are shown by white circles.
3 point median
estimated radious with mean
mean
estimated radious with median
estimated radious with max
Figure 5: Achieving pupil center by three methods (mean, median, and three points) and radius with three methods (mean, median, and maximum) for image 002_1_1.
TABLE 1: ERROR PERCENTAGE OF PUPIL INSIDE THE IRIS AND IRIS INSIDE THE PUPIL FOR PRESENTED METHOD FOR SEVERAL RADIUS
VALUES.
Method Iris in
pupil
Pupil in iris
Proposed 0.3729 6.4127
Proposed+1 0.16045 4.1957
Proposed+2 1.655 2.52
Proposed+3 3.14016 1.4344 Proposed+4 5.2169 0.716169
Further, the results of the above errors and the errors observed by eye are presented in Table 2 and in Table 3 the comparison between these errors with other methods is explained. In these tables, Wildes (Edge detector + Hough transform) and Ma (Radius estimated + Edge detector + Hough transform) methods have been evaluated based on Libor Masek works and his MATLAB codes[20]. Rejection threshold for first two criteria is considered as 0.16 of its maximum error.
TABLE 2: PUPIL LOCALIZATION ERROR USING THREE METHODS FOR PROPOSED ALGORITHM (PROPOSED+2).
Error Threshold for error
Number of reject
Accuracy (%)
Iris in pupil >.16*Max 1 99.166
Pupil in iris >.16*Max 4 99.45
Observed by eyes
- 5 99.3
TABLE 3: ERROR PERCENTAGE OF IRIS IN PUPIL AND PUPIL INIRIS
IN COMPARISON WITH OTHER METHODS.
Method Pupil in iris Iris in pupil
Edge detector + Hough
transform(*)
3.0012 2.12716
Radius estimated + (*)
3.7145 1.16671
Proposed Method 2.52 1.655
Quantitative comparison of results based on observing by eye has been already done. This comparison result and speed comparison with other methods are shown in Table 6.
TABLE 4: SPEED [MS] AND PRECISION COMPARISONS WITH OTHER METHODS.
Method Time(ms) Accuracy (%)
Edge detector + Hough
transform(*)
1216 100
Radius estimated + (*)
160 99.166
Proposed Method 10 99.2
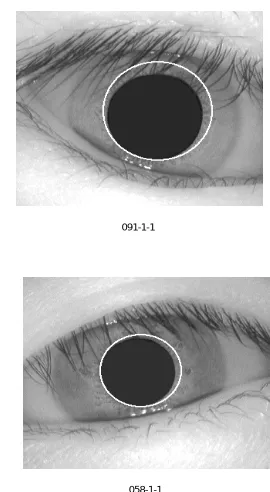
Two examples of presented algorithm errors are shown in Figure 6.
In the following part, the result of feature extraction and matching are presented. In this section, we use CASIA1 [16] and the results of Labor Masek for localizing [20]. Here, we focused on the studying the performance of the proposed feature extraction method. To achive this goal, the images which had some error in the localizing stage, were omitted from this experiment. It means that we can trust that iris region is exactly localized. Therefore, we have 5116 images from 74 different samples at the end and the distribution of the intra-class matching distance is estimated with 1523 comparisons and the inter-class distribution is estimated with 132349 comparisons.
In this section, the performance of the proposed feature extraction is studied by the method which is explained in 2.4. Bior2.6 wavelet is used as the wavelet function in this section.
091-1-1
058-1-1
Figure 6: Two examples for error of proposed method.
0 50 100 150 200 250 300 350 0
5
10x 10
4 separability =1.40985
0 2 4 6 8 10 12 14 16
0 2
4x 10
4 separability =1.37015
0 5 10 15 20 25 30 35 40
0 2
4x 10
4 separability =3.03527
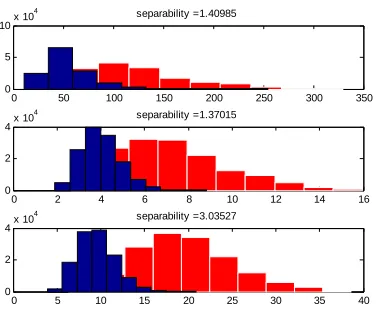
Figure (7): Histogram for intra class and inter class for proposed algorithm with bior2.6 wavelet with 3 difference index (PMR, PMRR, Max peak).
In verification mode, the Receiver Operating Characteristic (ROC) curve and equal error rate (EER) are used to evaluate the performance of the proposed method. The ROC curve is a false acceptance rate (FAR) versus False Reject Rate (FRR) curve.
TABLE(5)FAR AND FRR ERROR FOR PROPOSED ALGORITHM
(BIOR2.6 FOR WAVELET AND PMR FOR INDEX).
Threshol d
FRR (%) FAR (%)
5 0 99.5723
16 0.0644 163.4332
11 1.4157 36.5745
14 16.1725 16.061616
17 19.6911 1.05116
20 32.161165 0.01699
5 10 15 20 25 30 35
0 10 20 30 40 50 60 70 80 90 100
thereshold
FAR FRR
EER
Figure (8): Curves FAR and FRR for proposed algorithm.
Base on Fig.8, the EER point is used for total threshold in the Table 6.
Finally, we studied the performance of the total algorithm (localizing + feature extraction) by adaptive and total threshold.
TABLE(6)FAR AND FRR FOR TOTAL ALGORITHM .
Verification method FRR (%) FAR (%) Adaptive threshold 2.1236 0.6351 Total threshold=14 16.1725 16.061616
For reducing computational cost, the original feature vector is converted to a binary feature vector. In this case, the positive features or zero set to 1 and otherwise set to 0. So, we will have 13166 bits as an iris code that is comparable with Dugman’s iris code.
TABLE(7)PERFORMANCE COMPARING BETWEEN PRINCIPLE IRIS CODE AND BINARY IRIS CODE .
Verification method FRR (%) FAR (%)
Iris code Binary 1.9305 0.7973
Iris code 2.1236 0.6351
4. DISCUSSION
Tables 1 illustrates the calculating results of pupil in iris and iris in pupil errors for proposed method during radius changes. These results show that if a two unit is added to the achieved radius in the algorithm (mean value of radiuses vector), an acceptable error percentage will be achieved. Regarding to Tables 3 and 4, in this method, the errors are more improved in comparison with the two other methods. This result is expectable according to the compression in our image and consequents mean value of radiuses are always smaller than original radius and increasing radius up to desirable value is a simple and efficient solution for this problem.
In Table 2, precision of proposed method is calculated by three criteria: error percentage of iris in pupil, error percentage of pupil in iris and by observation. Rejection threshold for two first criteria is considered as 0.16 of its maximum error. It can be seen that each three criteria has got an acceptable precision for the presented method. Table 4 reports an obvious improvement in the speed up of this method in comparison with the two other methods. Although this result has been tested by measurement of the CPU time during the execution of the algorithms, computational cost of the pupil localization stage of proposed algorithm has been extracted.
For a M by N pixel image, the compressed image has M/4 by N/4 pixel and extracted fitted square around the pupil is K by K image which K=max(M/8, N/8). Projection of the image has 3K summation and localization of the center of pupil and finding its radius has (2K + 3K) multiplication and (2K + 3K) summation. It means that for a L pixel image, computational cost of the pupil localization is O(1/4L1/2).
related to pupil. This problem can be solved by incrementing the number of points on the boundary that results in consuming more time.
Figure 4 illustrates discriminating intra-class and inter-class with bior3.5 wavelet and three different indexes. It can be seen that PMR index has got most discrimination. Figure 6 shows FAR and FRR curves. We changed threshold from 5 to 25 and studied PMR’s intra class and inter class. The values lower than threshold are considered as FRR error and value upper than threshold, for inter class, as FAR threshold.
Table 6 shows lower error for adaptive threshold. This is because we consider difference threshold to acceptance or rejection of each class so accuracy will be increased.
5. CONCLUSION
In this paper, a new algorithm is proposed for iris recognition. In the localizing section a fast and simple method with low computional cost is proposed to find the
internal boundary of the iris and pupil. Due to the simplicity of the method, implementation of the algorithm can be handled by simpler microprocessors. In addition, despite the lower computational cost and simplicity, the proposed method has an acceptable accuracy for internal boundary localization as shown in Table 3.
For feature extraction, our method in this paper is based on approximation coefficient of biorthogonal wavelet function and PMR index is used for matching as a new index. Furthermore FAR and FRR are computed with 2 difference methods, adaptive and total threshold. In verification mode, the proposed method has an encouraging performance furthermore. In this method, we use first level coefficient of wavelet so the computational cost is decreased.
Adaptive threshold for calculating FAR and FRR because of its more accuracy is proposed.
6. REFERENCES
[1] Bonyad Tose’e Farda, Review of biometrics technology literature e-book, 2006.
[2] M. Geruso,"An Analysis of the Use of Iris Recognition System in U.S. Travel Document Application", WISE July 29,2002. [3] D. de Martin- Roche, C. Sanchez-Avila , R. Sanchez-Reillo," Iris
Recognition for Biometric Identification using Dyadic Wavelet Transform Zero-crossing", IEEE 35th International Carnahan Carnahan Conference on Security Technology , 2001.
[4] L Ma, T Tan," Efficient Iris Recognition by Characterizing Key Local Variations",IEEE Transactions on Image Processing, VOL. 13, NO. 6, January 2004.
[5] R P.Wildes, "Iris Recognition: An Emerging Biometric Technology", Proceedings of the IEEE, Vol. 165, No.9,September 1997.
[6] J Daugman ,"How Iris Recognition Works?", IEEE Transactions
on circuits ,and systems for videoTechnology, vol. 14, No. 1
January 2004.
[7] J Daugman, C Dawning, "Recognizing Iris Texture By Phase Demodulation" IEEE Colloquium on Image Processing for Biometric Measurement 2, 1–16 (1994).
[8] J Daugman," High Confidence Recognition of Persons by Iris Patterns", IEEE 35th International Carnahan Conference on Security Technology,2001.
[9] R.p. Wildes, J. C. Asmuth, G. L.Green, S. C. Hsu, R. J. Kolczynski, J. R. Matey, S.E. Mcbride, "Asystem for Automated Iris Recognition", IEEE Workshop on Applications of Computer Vision, 1994.
[10] W. W. Boles and B. Boashash," A Human Identification Technique Using Images of the Iris and Wavelet Transform", IEEE
Transaction on Signal Processing, VOL. 46, NO. 4, April 19916.
[11] L Ma, T Tan, Y Wang, D Zhang, "Personal Identification Based on Iris Texture, Analysis", IEEE Transactions on Pattern Analysis and Machine Intelligence, Vol. 25, No. 12, December 2003.
[12] Z Sun, Y Wang, T Tan, J Cui," Improving Iris Recognition Accuracy Via Cascaded Classifiers", IEEE Transaction on ystem, Man, and, VOL. 35, NO. 3, August 2005.
[13] D. H. Cho, K. R. Park, D. W. Rhee," Real-time Iris Localization for Iris Regnition in Cellular Phone", Sixth International Conference on Software engineering, Artificial Intelligence, Networking and Parallel/Distributed Computing, IEEE 2005.
[14] C. Sanchez-Avila, R. Sanchez-Reillo, D. de Martin- Roche," Iris-Based Biometric Recognition using Dyadic Wavelet Transform",
IEEE AESS Systems Magazine, October 2002.
[15] H Sung, J Lim, J Park, Y Lee," Iris Recognition Using Collarette Boundary Localization", IEEE 17th International Conference on Pattern Recognition, 2004.
[16] http://www.sinobiometrics.com
[17] Jiali Cui, Yunhong Wang, Tieniu Tan, Li Ma, Zhenan Sun, “A Fast and Robust iris localization Method Based on texture Segmentation”, Biometric Technology for Human Identification.
Proceedings of the SPIE, Volume 5404, pp. 401-4016 (2004).
[18] Gong jun hui, Hu Ping, Lu Xiaochun,”Feature extraction and recognition of iris based on biorthogonal multiwavelets Feature extraction and recognition of iris based on biorthogonal multiwavelets “,Computer application 2006.
[19] Keinosuke fukunaga ,”Introduction To Statistical Pattern Recognition”,Academic Press Inc.1973 & (SE 1990).