Available online at http://ijdea.srbiau.ac.ir
Int. J. Data Envelopment Analysis (ISSN 2345-458X)
Vol.7, No.3, Year 2019 Article ID IJDEA-00422, 6 pages Research Article
Target Setting in the Process of Merging and
Restructuring of Decision-Making Units using
Multiple Objective Linear Programming
J. Gerami*
Department of mathematics, Shiraz Branch, Islamic Azad University, Shiraz, Iran
Received 12 January 2019, Accepted 29 April 2019
Abstract
This paper presents a novel approach to achieving the goals of data envelopment analysis in the process of reconstruction and integration of decision-making units by using multiple objective linear programming. In this regard, first, we review inverse data envelopment analysis models for data reconstruction and integration. We present a model with multi-objective linear programming structure in inverse data envelopment analysis. The superiority of the model to prioritize inputs and outputs in the input and output data integration process. Finally, we used of bank data for showing the validity of proposed approach and we proposed results.
Keywords: Inverse data envelopment analysis, merging, restructuring, Banking industry, multiple objective linear programming.
1. Introduction
One way to improve corporate performance is to adjust the level of inputs and outputs according to the level of inputs and outputs available [1], [2]. Therefore, it is important to build new decision making
[email protected] Corresponding author: Email:
. *
units that can be created. In this regard, we can use inverse data envelopment analysis to increase the environmental and operational efficiency of companies. In this regard, according to the manager, we can determine the expected efficiency and
34 provide new decision-making units with a stabilization or creation and division scenario. In this context, by predefining expected efficiency, we can achieve the desired level of new inputs and outputs by stabilizing the efficiency score. [3], [4], [5], [6], [7], [8], [9], [10], [11].
One way to create and build new units with the expected efficiency score is to use inverse data envelopment analysis. See the following articles for further studies on inverse data envelopment analysis [12], [13], [14], [15].
In the following Gattoufi et al. [11], Provides a new metallurgy to detect the amount of reduction required in inputs or increments in outputs to stabilize the target efficiency level value, and by integrating input and output levels, two making units have a combined decision-making unit with the expected efficiency score.
Amin et al. [16], [17] presented a general model for corporate restructuring by using inverse data envelopment analysis. One of the issues in merging and restructuring decision-making units to obtain new units with predetermined efficiency scores is prioritizing inputs and outputs. Previous models presented did not consider prioritization. The disadvantage of the approach presented in this paper is compared to the previous approach, prioritizing inputs and outputs based on the manager's point of view using multiple
objective linear
programming models.
This article is organized as follows. The second section, presents the initial models of reconstruction and integration of decision-making units using inverse data envelopment analysis. In the third section, we present a general model with a multiple objective structure to obtain decision units with a specific efficiency score. In the fourth part of the article, we illustrate proposed approach to a numerical example and finally present the results.
2. Reconstruction and integration using inverse data envelopment analysis Consider n decision-making unit that each uses m input to product s output. Suppose that 𝑥𝑖𝑗 ,𝑦𝑟𝑗 represent i-th input and r-th
output of the decision-making unit j respectively. In this section, we perform the reconstruction and integration of the decision-making unit using two decision makers. Make a reconstruction with two decision makers 𝐷𝑀𝑈𝑘, 𝐷𝑀𝑈𝑙. Suppose,
we call the new unit 𝐷𝑀𝑈𝑀.
For the input oriented model, suppose merge the inputs of the two decision units and create a new one. Gattoufi et al. [11] introduced the Generalized Inverse DEA (InvDEA) model in this regard. For the input oriented model, suppose we merge the inputs of the two decision units and create a new input. Consider the efficiency of the new unit for a certain amount. In the process of reconstruction and merging companies, we may create the same units with new inputs and outputs or create new units based on previous units. Consider the efficiency of the new unit for a certain amount. Suppose 𝛼𝑖𝑘, 𝛼𝑖𝑙 are the i input
levels of units 𝐷𝑀𝑈𝑘, 𝐷𝑀𝑈𝑙.
Gattoufi et al. [11] presented the input oriented model as follows.
min ∑𝑚𝑖=1(𝛼𝑖𝑘+ 𝛼𝑖𝑙)
s.t. ∑𝑗∈𝐹𝑥𝑖𝑗𝜆𝑗+ 𝜆𝑀(𝛼𝑖𝑘+ 𝛼𝑖𝑙) −
(𝛼𝑖𝑘+ 𝛼𝑖𝑙) 𝜃̅ ≤ 0 𝑖 = 1, … , 𝑚,
∑𝑗∈𝐹𝑦𝑟𝑗𝜆𝑗+ 𝜆𝑀(𝑦𝑟𝑘+ 𝑦𝑟𝑙) ≥
(𝑦𝑟𝑘+ 𝑦𝑟𝑙) 𝑟 = 1, … , 𝑠,
∑𝑗∈𝐹𝜆𝑗 = 1, (1)
0 ≤ 𝛼𝑖𝑗 ≤ 𝑥𝑖𝑗 𝑗 = 𝑘, 𝑙,
𝑖 = 1, … , 𝑚, 𝜆𝑗≥ 0 ∀ j ϵ F.
In the above model 𝜆𝑗 show intensity
vector, 𝜃̅ is the target efficiency score of 𝐷𝑀𝑈𝑀F show indices are related to other
Javad Gerami / IJDEA Vol.7, No.3, (2019), 33-38
35 makes the model nonlinear and an easy way to convert model (1) to a linear model is to remove the term 𝜆𝑀(𝛼𝑖𝑘+ 𝛼𝑖𝑙) from
set of model constraints [11]. Then model (1) will convert to model (2).
Note that model (1) is a nonlinear model. min ∑𝑚𝑖=1(𝛼𝑖𝑘+ 𝛼𝑖𝑙)
s.t. ∑𝑗∈𝐹𝑥𝑖𝑗𝜆𝑗− (𝛼𝑖𝑘+ 𝛼𝑖𝑙)𝜃̅ ≤ 0,
𝑖 = 1, … , 𝑚,
∑𝑗∈𝐹𝑦𝑟𝑗𝜆𝑗≥ (𝑦𝑟𝑘+ 𝑦𝑟𝑙),
𝑟 = 1, … , 𝑠,
∑𝑗∈𝐹𝜆𝑗= 1, (2)
0 ≤ 𝛼𝑖𝑗 ≤ 𝑥𝑖𝑗,
𝑗 = 𝑘, 𝑙, 𝑖 = 1, … , 𝑚, 𝜆𝑗 ≥ 0 ∀ j ϵ F.
Gattoufi et al. [11] presented the output oriented model as follows.
max ∑𝑠𝑟=1(𝛽𝑟𝑘 + 𝛽𝑟𝑙)
s.t. ∑𝑗∈𝐹𝑥𝑖𝑗𝜆𝑗+ 𝜆𝑀(𝑥𝑖𝑘+ 𝑥𝑖𝑙)≤
(𝑥𝑖𝑘+ 𝑥𝑖𝑙), 𝑖 = 1, … , 𝑚,
∑𝑗∈𝐹𝑦𝑟𝑗𝜆𝑗+ 𝜆𝑀(𝛽𝑟𝑘+ 𝛽𝑟𝑙) −
ℎ̅(𝛽𝑟𝑘+ 𝛽𝑟𝑙) ≥ 0 𝑟 = 1, … , 𝑠
∑𝑗∈𝐹𝜆𝑗= 1, (3)
0 ≤ 𝑦𝑟𝑗≤ 𝛽𝑟𝑗,
𝑗 = 𝑘, 𝑙, 𝑖 = 1, … , 𝑚
𝜆𝑗≥ 0 ∀ j ϵ F.
It should be noted that the variable 𝛽𝑟𝑘
corresponds to the output of the newly created unit namely 𝐷𝑀𝑈𝑀. The above
model presents the additional level of the newly created unit must have compared to the units used to create the new unit to achieve a predetermined level of efficiency. We denote this efficiency by ℎ̅. Similar to the argument used in the input oriented model, we can convert model (3) to the following linear model.
max ∑𝑠𝑟=1(𝛽𝑟𝑘+ 𝛽𝑟𝑙)
s.t. ∑𝑗∈𝐹𝑥𝑖𝑗𝜆𝑗≤ (𝑥𝑖𝑘+ 𝑥𝑖𝑙)
𝑖 = 1, … , 𝑚,
∑𝑗∈𝐹𝑦𝑟𝑗𝜆𝑗− ℎ̅(𝛽𝑟𝑘+ 𝛽𝑟𝑙) ≥ 0 ,
𝑟 = 1, … , 𝑠,
∑𝑗∈𝐹𝜆𝑗= 1, (4)
0 ≤ 𝑦𝑟𝑗 ≤ 𝛽𝑟𝑗, 𝑗 = 𝑘, 𝑙,
𝑟 = 1, … , 𝑚
𝜆𝑗 ≥ 0, ∀ j ϵ F .
If the new unit is outside of the productivity possible set, then models (3) and (4) will be infeasible. In the next section, we present models for achieving goals in the process of integrating and creating new units based on multi-objective models.
3. Targeting using multiple objective linear programming
In this section, we develop a new model based on multiple objective linear programming models. At first present the input oriented model as follows.
max ∑𝑚𝑖=1−(𝛼𝑖𝑘+ 𝛼𝑖𝑙)
max ∑𝑚𝑖=1 (𝑑𝑖𝑘+ 𝑑𝑖𝑙)
max 𝑑𝑚𝑖𝑛
s.t. ∑𝑗∈𝐹𝑥𝑖𝑗𝜆𝑗− (𝛼𝑖𝑘+ 𝛼𝑖𝑙)𝜃̅ ≤ 0,
𝑖 = 1, … , 𝑚,
∑𝑗∈𝐹𝑦𝑟𝑗𝜆𝑗≥ (𝑦𝑟𝑘+ 𝑦𝑟𝑙),
𝑟 = 1, … , 𝑠,
∑𝑗∈𝐹𝜆𝑖= 1, (5)
𝑥𝑖𝑗− 𝛼𝑖𝑗− 𝑑𝑖𝑗= 0 𝑗 = 𝑘, 𝑙,
𝑖 = 1, … , 𝑚,
𝜆𝑗 ≥ 0 ∀ j ϵ F .
In the above model 𝜆𝑗 show intensity
vector, 𝜃̅ is the target efficiency score of 𝐷𝑀𝑈𝑀. For new unit namely 𝐷𝑀𝑈𝑀, 𝑑𝑖𝑗
is the value of the deviation as to constraint 𝑥𝑖𝑗− 𝛼𝑖𝑗. 𝑑𝑚𝑖𝑛 shows the least deviation.
The purpose of the above model is to minimize the level of new unit input namely 𝛼𝑖𝑘+ 𝛼𝑖𝑙 .If the amounts of 𝑑𝑖𝑙+
𝑑𝑖𝑘 maximized then 𝛼𝑖𝑘+ 𝛼𝑖𝑙 minimized.
If the amounts of 𝑑𝑖𝑙+ 𝑑𝑖𝑘 maximized
then ∑𝑚 𝑖=1( 𝑑𝑖𝑙+ 𝑑𝑖𝑘) maximized. The
above model is a model with MOLP structure in the input form.
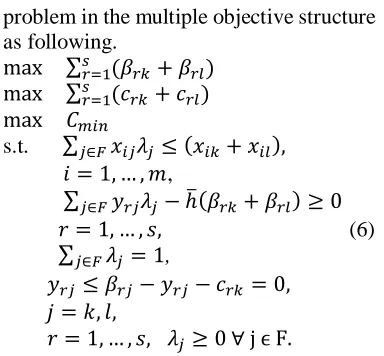
36 problem in the multiple objective structure as following.
max ∑𝑠𝑟=1(𝛽𝑟𝑘+ 𝛽𝑟𝑙)
max ∑𝑠𝑟=1(𝑐𝑟𝑘 + 𝑐𝑟𝑙)
max 𝐶𝑚𝑖𝑛
s.t. ∑𝑗∈𝐹𝑥𝑖𝑗𝜆𝑗 ≤ (𝑥𝑖𝑘+ 𝑥𝑖𝑙),
𝑖 = 1, … , 𝑚,
∑𝑗∈𝐹𝑦𝑟𝑗𝜆𝑗− ℎ̅(𝛽𝑟𝑘+ 𝛽𝑟𝑙) ≥ 0
𝑟 = 1, … , 𝑠, (6)
∑𝑗∈𝐹𝜆𝑗= 1,
𝑦𝑟𝑗≤ 𝛽𝑟𝑗− 𝑦𝑟𝑗− 𝑐𝑟𝑘 = 0,
𝑗 = 𝑘, 𝑙,
𝑟 = 1, … , 𝑠, 𝜆𝑗 ≥ 0 ∀ j ϵ F.
By maximizing 𝑐𝑟𝑗, we can maximize 𝛽𝑟𝑗.
Since 𝑐𝑚𝑖𝑛 is the minimum of the above
values. By maximizing 𝑐𝑚𝑖𝑛 all values are
maximized.
4. Application
In this section, we use the introduced data by Gattoufi et al. [11], in order to show the validity of the proposed approach. Data include banks operating in the countries that are member of GCC. These countries are Kuwait, Oman, Saudi Arabia. The data for these 42 banks include two inputs and two outputs.
Inputs include: 1) Interest expenses 2) Non-interest expenses Outputs include:
1) Interest income 2) Non-interest income
The data are listed in Table (1).
Table 1. The set of bank data.
Bank Interest
expenses
Non-interest expenses
Interest incomes
Non-interest incomes
Technical efficiency scores under VRS
B01 3956.796 1894.426 9001.004 8701.497 1
B02 481.239 319.976 974.854 597.726 0.677
B03 305.2 138.6 479.8 252.2 0.64
B04 4710.68 3996.259 12,920.34 6060.768 0.893
B05 1.018 1.282 3.054 0.377 1
B06 954.437 1208.703 1991.004 7278.097 1
B07 3.965 5.082 13.359 3.003 0.829
B08 14.63 16.863 44.659 14.938 0.738
B09 11.771 6.579 22.952 15.134 0.727
B10 364.92 244.75 923.51 1942.935 1
B11 4897.442 2787.181 11,294.61 9363.232 0.939
B12 14.665 8.973 28.124 10.971 0.67
B13 6.077 14.249 26.994 10.207 0.97
B14 397.627 371.535 894.845 1902.878 0.813
B15 661.12 830.166 2325.128 1748.531 0.953
B16 12.125 7.346 33.573 19.53 0.96
B17 1222.026 1049.479 2959.509 2651.546 0.785
B18 931.172 838.346 2460.798 2765.485 0.866
B19 4070.351 2845.498 8377.368 7726.906 0.77
B20 3721.233 858.463 6953.701 2779.716 1
B21 16.137 7.08 40.771 22.126 1
B22 150.706 132.504 538.754 129.956 1
B23 3857.94 2894.374 7439.526 10,239.09 0.91
B24 7994.808 2286.908 14,156.19 11,261.82 1
B25 9.689 6.975 22.432 6.032 0.756
B26 3292.736 1953.592 7041.164 3323.973 0.826
B27 402.772 321.189 906.237 775.778 0.678
B28 32.835 21.536 97.679 26.551 0.98
B29 6.737 7.854 18.402 4.504 0.69
B30 531.395 922.04 1672.093 1185.165 0.815
Javad Gerami / IJDEA Vol.7, No.3, (2019), 33-38
37
B32 1.925 4.581 9.163 5.274 1
B33 4.889 6.737 17.402 5.082 0.84
B34 3233.619 2527.414 7959.733 4684.616 0.84
B35 5169.71 5405.975 15,189.61 9830.137 0.871
B36 6802.566 5608.863 19,958.04 15,716.89 1
B37 3111.952 2126.013 6895.572 4869.316 0.811
B38 3600.983 1319.711 6547.924 5116.082 0.876
B39 7781.754 8486.425 27,514.03 14,335.68 1
B40 4488.666 4531.419 12,157.91 12,380.68 1
B41 3188.736 1106.154 5727.009 6194.46 1
Suppose we consider Banks 𝐵02 and 𝐵03
as restructuring units and want to obtain a new unit with a level of efficiency one. Let us assume the merged bank is interested in being fully efficient. Moreover, assume the merged bank would like to give its efficiency to interest expenses of 𝐵02,
conformed by
interest expenses of 𝐵03, then non-interest
expenses of 𝐵02 and finally non-interest
expenses of 𝐵03. We first solve the input
oriented model and then the output oriented model. The results are in Tables (2) and (3).
As can be seen from the Tables (2) and (3), total inputs and outputs decreased and increased, respectively. An overall improvement in input and output levels was achieved. Given the input and output levels of the new unit, we therefore created a unit with a single efficiency level. The
results can be interpreted similarly for the output orientation model.
5. Conclusion
One of the important issues in data envelopment analysis is the integration and reconstruction of decision making units. In this regard, this paper coverage two models of data envelopment analysis with multiple objective linear programming structure that uses for reconstruction of the unit. We show that the above model is preferable to the previous models because these models obtain appropriate target scores than the previous models and obtain new unit with lower input and more outputs level. We can expand the presented models to other models of DEA such as non-radial models and DEA models in the presence inaccurate data.
Table 2. Target setting with the output oriented model.
Table 3. Target setting with the input oriented model.
References
[1] Charnes, A., Cooper,W. W., Rhodes, E. (1978). Measuring the efficiency of decision making units. European Journal of Operational Research, 2, 429–44.
[2] Chen, C. Zhu, J., Yu, J.Y., Noori, H. (2012). A new methodology for evaluating sustainable product design performance with two-stage network data envelopment analysis. European Journal of Operational Research, 221 (2), 348– 359.
𝛽23∗
𝛽22∗
𝛽13∗
𝛽12∗
Method
432.5 446.82
3329.45 562.36
MCDEA model (5)
394.21 548.33
2009.48 409.24
InvDEA model (2)
𝛼23∗
𝛼22∗
𝛼13∗
𝛼12∗
Method
129.2 275.7 296.6
63.42 MCDEA model (6)
108.26 0
319.98 371.27
38 [3] Barzegarinegad, A., Jahanshahloo, G, Rostamy-Malkhalifeh, M. (2014). A full ranking for decision making units using ideal and anti-ideal points in DEA, The Scientific World Journal, 2014, Article ID 282939, 8 pages.
[4] Hosseinzadeh Lotfi, F., Tehranian, A., Navabakhs, M., Rostamy-Malkhalifeh, M. (2007). Ranking bank branches with interval data—the application of DEA. International Mathematical Forum, 2(9), 429-440.
[5] Peykani, P., Mohammadi, E., Jabbarzadeh, A., Jandaghian, A., (2016). Utilizing robust data envelopment analysis model for measuring efficiency of stock, a case study: Tehran stock exchange. Journal of New Research in Mathematics, 1(4), 15-24.
[6] Peykani, P., Mohammadi, E., Pishvaee, M. S., Rostamy-Malkhalifeh, M., Jabbarzadeh, A. (2018), A novel fuzzy data envelopment analysis based on robust possibilistic programming: possibility, necessity and credibility-based approaches, RAIRO-Operations Research, 52(4), 1445-1463.
[7] Peykani, P., Mohammadi, E., Emrouznejad, A., Pishvaee, M. S., Rostamy-Malkhalifeh, M. (2019-a). Fuzzy data envelopment analysis: an adjustable approach. Expert Systems with Applications, 136, 439-452.
[8] Peykani, P., Mohammadi, E., Rostamy-Malkhalifeh, M., Hosseinzadeh Lotfi, F. (2019-b). Fuzzy data envelopment analysis approach for ranking of stocks with an application to Tehran stock exchange, Advances in Mathematical Finance and Applications, 4(1), 31-43.
[9] Peykani, P., Mohammadi, E., Seyed Esmaeili, F. S. (2019-c). Stock evaluation under mixed uncertainties using robust DEA model. Journal of Quality Engineering and Production Optimization, 4(1), 73-84.
[10] Rostamy-Malkhalifeh, M., Mollaeian, E. (2012). Evaluating performance supply chain by a new non-radial network DEA model with fuzzy data. Journal of Data Envelopment Analysis and Decision Science, 2012, 8 pages.
[11] Gattoufi, S., Amin,G.R. Emrouznejad, A. (2014). A new inverse DEA method for merging banks. IMA Journal of Management Mathematics, 25(1), 73-87.
[12] Zhang, J., Liu, Z. (1996). Calculating some inverse linear programming problems. Journal of Computational and Applied Mathematics, 72(2), 261-273.
[13] Wei, Q., Zhang, J., Zhang, X. (2000). An inverse DEA model for inputs/outputs estimate. European Journal of Operational Research, 121(1), 151-163.
[14] Jahanshahloo, G., Hosseinzadeh Lotfi, F., Rostamy-Malkhalifeh, M., Ghobadi, S. (2014). Using enhanced Russell model to solve inverse data envelopment analysis problems. The Scientific World Journal, 2014, Article ID, 571896, 10 pages.
[15] Ghiyasi, M. (2015). On inverse DEA model: The case of variable returns to scale. Computers & Industrial Engineering, 87, 407-409.
[16] Amin, G.R., Emrouznejad, A. (2007). Inverse Linear Programming in DEA. International Journal of Operations Research, 4(2), 105-109.