Ishai et al., 2005; Benuzzi et al., 2007; Fairhall and Ishai, 2007; Ishai, 2008, 2010). In a recent fMRI investigation of brain response to recognition of angry, fearful, disgusted, happy, and neutral faces, we showed that these integrated and distributed systems for face perception are differentially recruited in social phobic patients as compared to healthy controls (Gentili et al., 2008). Specifically, dif-ferences in task-related activations between social phobic patients and healthy controls were not limited merely to brain areas related to the processing of emotional expressions and personality traits (e.g., amygdala), but rather extended also to cortical areas that are involved in attention and processing of other facial features, including the left fusiform, left dorsolateral prefrontal, and bilateral intraparietal cortical areas (Gentili et al., 2008).
Furthermore, brain regions of the so-called default mode network (DMN), that is, those cortical areas that show higher activity while subjects are in a passive resting condition as com-pared to when they are engaged in an active task (Gusnard et al., 2001; Raichle et al., 2001; Greicius et al., 2003), and specifically the precuneus/posterior cingulate region, showed a differen-tial activity between social phobic patients and healthy con-trols. This differential recruitment of the distributed system for INTRODUCTION
According to the Diagnostic and Statistical Manual of Mental Disorders IV-TR (APA, 2000), Social Phobia is defined as “the per-sistent fear of one or more situations in which the person is exposed to possible scrutiny by others”. Among others, human faces may rep-resent “potentially threatening” social stimuli (Stein et al., 2002). Distinctive behavioral and brain functional responses to face per-ception and recognition have been reported in various anxiety dis-orders (Rauch et al., 2000; Stein et al., 2002; Straube et al., 2004). In particular, abnormal neural responses to face perception have been described in social phobic patients as compared to healthy controls, mainly in the amygdala (Birbaumer et al., 1998; Stein et al., 2002; Killgore and Yurgelun-Todd, 2005; Phan et al., 2006), in the “extended amygdala” including uncus and parahippocampus (Stein et al., 2002), in the anterior cingulate cortex (Amir et al., 2005), and in the superior temporal sulcus (STS) (Straube et al., 2004).
However, face perception represents a complex cognitive ability that involves multiple operations, including for instance recogni-tion of identity, processing of facial expression and eye gaze, and it is subserved by a distributed network of brain areas within the core
and the extendedsystems for face recognition (Haxby et al., 2000;
Is Social Phobia a “mis-communication” disorder? Brain
functional connectivity during face perception differs between
patients with Social Phobia and healthy control subjects
Sabrina Danti1,2, Emiliano Ricciardi1,3, Claudio Gentili2,3, Maria Ida Gobbini4, Pietro Pietrini1* and
Mario Guazzelli2
1 Laboratory of Clinical Biochemistry and Molecular Biology, Department of Laboratory Medicine and Molecular Diagnostics, University Hospital of Pisa, Pisa, Italy 2 Department of Psychiatry, Neurobiology, Pharmacology and Biotechnologies, University of Pisa, Pisa, Italy
3 MRI Lab, Fondazione Regione Toscana/CNR “G. Monasterio”, Pisa, Italy 4 Department of Psychology, University of Bologna, Bologna, Italy
Recently, a differential recruitment of brain areas throughout the distributed neural system for face perception has been found in social phobic patients as compared to healthy control subjects. These functional abnormalities in social phobic patients extend beyond emotion-related brain areas, such as the amygdala, to include cortical networks that modulate attention and process other facial features, and they are also associated with an alteration of the task-related activation/deactivation trade-off. Functional connectivity is becoming a powerful tool to examine how components of large-scale distributed neural systems are coupled together while performing a specific function. This study was designed to determine whether functional connectivity networks among brain regions within the distributed system for face perception also would differ between social phobic patients and healthy controls. Data were obtained from eight social phobic patients and seven healthy controls by using functional magnetic resonance imaging. Our findings indicated that social phobic patients and healthy controls have different patterns of functional connectivity across brain regions within both the core and the extended systems for face perception and the default mode network. To our knowledge, this is the first study that shows that functional connectivity during brain response to socially relevant stimuli differs between social phobic patients and healthy controls. These results expand our previous findings and indicate that brain functional changes in social phobic patients are not restricted to a single specific brain structure, but rather involve a mis-communication among different sensory and emotional processing brain areas.
Keywords: social phobia, functional connectivity, face perception, fMRI
Edited by:
Barry Horwitz, National Institutes of Health, USA
Reviewed by:
Chris I. Baker, National Institutes of Health, USA
Paolo Frigio Nichelli, Università Degli Studi Di Modena E Reggio Emilia, Italy
*Correspondence:
Pietro Pietrini, Department of Laboratory Medicine and Molecular Diagnostics, University of Pisa Medical School, Via Roma, 67 I-56126 Pisa, Italy.
face perception in social phobic patients may be coupled to an alteration of the task-related activation/deactivation trade-off (Gentili et al., 2009).
Functional connectivity, as measured by fMRI (fcMRI), reflects the temporal correlation between neurophysiological events that may occur in regions spatially distant and even not anatomically connected (Friston, 1994; Biswal et al., 1995). Thus, functional con-nectivity represents a powerful tool to understand the functional architecture of the brain and to examine how components of large-scale distributed neural systems are coupled together in performing a specific function (Rogers et al., 2007; Stephan et al., 2008; Esposito et al., 2009). In other words, by using functional connectivity one can measure how distinct brain areas communicate among each other while subjects perform a given cognitive task (Horwitz et al., 2000, 2005; Horwitz, 2003). In patients with a variety of psychi-atric disorders, functional correlation analysis has shown a communication among brain areas for face perception. For instance, Wang et al. (2009) showed a significantly reduced functional connec-tivity between the amygdala and perigenual anterior cingulate cortex in patients with Bipolar Disorder as compared to healthy controls during processing of face stimuli. Similarly, a reduced functional connectivity between the left amygdala and right posterior cingulate, precuneus, right fusiform, and parahippocampal cortex has been found in pediatric bipolar disorder patients as compared to healthy children during a face perception task (Rich et al., 2008).
Based on the findings discussed above, which indicate a wider distribution of brain functional abnormalities in patients with Social Phobia, the present study was designed to test the hypoth-esis that also functional regional correlations within the distributed network for face recognition would be different between healthy controls and patients with Social Phobia. Specifically, we reanalyzed our fMRI data – previously acquired and evaluated with a more conventional general linear model (GLM) analysis in Gentili et al. (2008, 2009) – by using a functional connectivity approach con-sidering as seeds those cortical areas that had shown a differential activity in social phobic patients as compared to healthy controls in response to a face perception task with emotional and neutral stimuli (Gentili et al., 2008).
MATERIALS AND METHODS
SUBJECTS
For this study, we utilized brain functional data originally reported in our previous manuscript (Gentili et al., 2008). In brief, eight right-handed subjects (4 males/4 females) (mean age 39 p 7 years) with a diagnosis of Social Phobia according to the DSM IV-TR criteria (APA, 2000) and seven right-handed healthy controls (4 males/3 females) (mean age 30 p 7 years) were recruited. All subjects received a clinical examination to exclude any medical, neurological or psychiatric disorder (other than Social Phobia in the patient group) that could affect brain function or metabolism. They also underwent a brain structural MRI scan exam to rule out any brain morphological abnormality or pathology. No subject in either group had taken any drug for at least 4 weeks prior to the clinical evaluation and the fMRI study. In particular all social phobic patients, as they had never received any pharmacological and/or psychotherapeutic treatment before, were completely drug-naïve. Prior to the enrollment into the study, all subjects signed a
written informed consent, under a protocol approved by the Ethics Committee of the University of Pisa, Italy. All subjects retained the right to withdraw from the study at any time.
The psychiatric interview included also the following rating scales: the Liebowitz Scale for Social Phobia (Liebowitz, 1987), the Interaction Anxiousness Scale (Leary and Kowalski, 1993) and the Audience Anxiousness Scale (Leary, 1983) to assess the degree of social anxiety. In addition, before and after the fMRI session each subject completed the State-Trait-Anxiety-Scale (Spielberger et al., 1970) to assess state anxiety during the experiment.
STIMULI AND TASK
Stimuli comprised faces and non-sense pictures. Faces with emo-tional expressions belonging to ten different subjects were taken from the Ekman and Friesen’s (1976) standardized set. We selected faces with angry, fearful, disgusted, and happy expressions as well as faces with neutral expressions. As control stimuli we used non-sense pictures, which were phase-scrambled images of the faces and were matched to the faces in terms of spatial frequencies, luminance, and contrast. Both faces and non-sense scrambled pictures were in gray scale.
A fast event-related design in which each stimulus was presented for 2,000 ms with an inter-stimulus interval (ISI) of 1,500 ms was used. During the fMRI sessions, participants were asked to perform a one-back repetition detection task based on face identity. For the control scrambled pictures a one-back repetition detection task also was performed to control for sensorimotor activations. During the task for faces, the subjects had to indicate whether each presented face image was the same individual as in the immediately preceding image by pressing a hand-held button with their right or left hand for matches and non-matches, respectively. For scrambled pictures the subjects had to indicate whether the successive pictures were identical or not using the same response buttons. In this way the subjects maintained attention to the stimuli, but the emotional task remained implicit. Subjects were instructed to respond dur-ing the ISI, when a fixation point appeared on the screen. Faces and scrambled pictures were presented in a pseudo-randomized order: a face with an emotional expression was presented after two to four faces with a neutral one. In each run, two blocks of 38 face stimuli were presented. The two face blocks were separated by an interval of 15 s of rest, a block of eight scrambled pictures and another 15 s interval of rest. Accuracy and reaction times were recorded by computer.
DATA ACQUISITION, PREPROCESSING, AND FUNCTIONAL CONNECTIVITY ANALYSIS
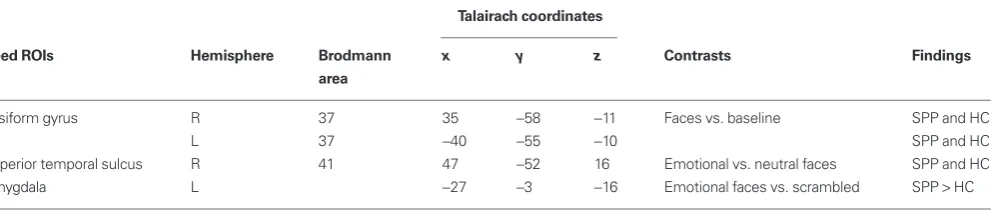
fusiform gyrus, or specifically responding to facial expressions, such as the STS and the amygdala (Winston et al., 2003, 2004; Campbell et al., 2007; Engell and Haxby, 2007). In details, bilateral fusiform gyri (FG) were selected as those clusters that showed a significant (P 0.01) response to faces in both healthy controls and social phobic patients. The right superior temporal sulcus (R-STS) seed ROI was derived from the comparison between emotional and neutral faces (P 0.01) in both social phobic patients and healthy controls. The left amygdala (L-Amy) was selected on the basis of the contrast between faces vs. scrambled pictures as a seed ROI showing a significant (P 0.01) higher response in social phobic patients as compared to healthy controls (Table 1).
A multiple regression analysis was performed to examine the whole brain functional connectivity of each seed ROI time series. In order to run group analysis, correlation coefficients were con-verted to Z scores, using Fisher’s Z transformation. For each ROI, individual Z-score correlation coefficient maps were computed by multiplying the cross-run average Z correlation coefficient values by the square root of the number of runs.
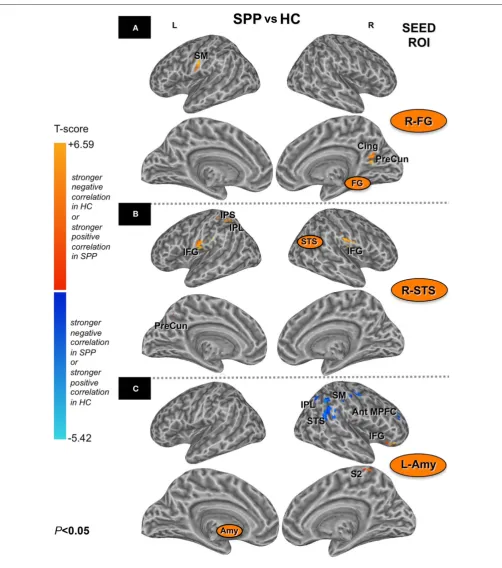
In each group, a one-sample t-test was used to define brain regions significantly correlated with the seed ROIs (Figure 1). The correction for multiple comparisons was made using Monte-Carlo simulations (AFNI AlphaSim, http://afni.nimh.nih.gov/afni/doc/ manual/AlphaSim) with a voxel-wise threshold of 0.05 which resulted in a minimum cluster volume of 5,852 µL and cluster connection radius 1.01 mm for a corrected P value 0.05. Results of the one-sample t-test contrasts were superimposed onto the anatomical regions of Talairach–Tournoux Atlas (Lancaster et al., 1997, 2000) to report brain networks significantly correlated to distinct seed ROIs, as labeled in Figures 1A–C.
An unpaired t-test between social phobic patients and healthy controls was performed to identify the regions differentially cor-related within the functional networks of the two groups for each seed ROI at an uncorrected P 0.05 and a minimum cluster volume of 1,000 µL for the right FG (R-FG) and R-STS, and of 500 µL for the seed L-Amy (Figure 2). Due to the complexity of evaluating the combinations of positive and negative correlations as resulted from the unpaired t-test, we restricted our search volumes to brain regions significantly correlated to a specific seed ROI in the two groups. Search volumes were defined with a binary mask (logical OR) that merged the one-sample t-tests of each seed ROI for each group (uncorrected P 0.05), thus defining overall correlated voxels in either social phobic patients or healthy controls.
axial slices, TR = 12.1 ms, TE = 5.22 ms, flip angle = 20o, FOV = 24 matrix resolution = 256 s 256 pixels) were obtained for each subject to provide detailed brain anatomy; the SPGR images were used as an anatomical underlay for the statistical maps derived from the analysis on the EPI sequences.
Data analysis was performed using the AFNI package (http:// afni.nimh.nih.gov/afni) (Cox, 1996). Functional connectivity was defined for each subject on the correlation between the mean BOLD signal of the seed region of interest (ROI) and the BOLD time-series of all the other voxels in the brain (Friston et al., 1997; Greicius et al., 2003). Indeed, after spatial realignment and slice time correc-tion, time series for each voxel were normalized to the mean, and then spatially smoothed (Gaussian kernel 6 mm half-width). Linear and quadratic trend of the signal were removed and the images were normalized to the Talairach–Tournoux space (Talairach and Tournoux, 1988). A temporal low-pass filter at 0.1 Hz on the whole signal was applied, to diminish the effect of high-frequency noises and to restrict our analysis to an informative frequency range for functional connectivity analysis (Cordes et al., 2001). Averaged time series extracted from each seed ROI were considered as regressors of interest. Task-related regressors, together with the six regressors for the estimated head movement (6o of motions: left–right, ante-rior–posterior, superior–inferior, roll, pitch, yaw) and the global signal, were considered as regressors of no interest in the multiple regressions analysis to compute the correlations maps (Deary et al., 2004; Whalley et al., 2005). To remove task-related effects, the task conditions (six regressors, one for each face expression, including the neutral one) were modeled with the canonical gamma-variate hemodynamic response function (Cohen, 1997). We have modeled the task as regressors of no interest exactly as in the GLM analysis of Gentili et al. (2008). The global signal was calculated as the aver-age of BOLD signal across all voxels of the whole brain for each subject. The global signal was considered in the correlation analysis as regressor of no interest to remove artifacts related to physiologi-cal noise (e.g., heart or respiratory rate), or variations in scanner sensitivity (Desjardins et al., 2001; Macey et al., 2004).
Definition of seed ROIs for the functional connectivity analysis relied on brain regions that showed a significant recruitment during a face recognition task in social phobic patients and healthy con-trols, as defined in our previous study (Gentili et al., 2008). Relying on the functional results of group analysis of variance (Gentili et al., 2008), we selected seed ROIs among brain regions involved in the early perception of faces (Haxby et al., 2000), such as the
Table 1 | Seed ROIs for the functional connectivity analysis, as derived from social phobic patients (SPP) and healthy controls (HC) group contrasts (uncorrected P 0.01).
Talairach coordinates
Seed ROIs Hemisphere Brodmann x y z Contrasts Findings
area
Fusiform gyrus R 37 35 58 11 Faces vs. baseline SPP and HC L 37 40 55 10 SPP and HC Superior temporal sulcus R 41 47 52 16 Emotional vs. neutral faces SPP and HC Amygdala L 27 3 16 Emotional faces vs. scrambled SPP HC
last differential clusters in the functional networks of the two groups, as defined by the unpaired t-test, are reported in terms of significant group similarities or differences across brain regions in Table 2.
RESULTS
PSYCHOMETRIC SCALES AND BEHAVIORAL RESULTS
Patients with Social Phobia had significant higher scores (P 0.01) in all the scales for social anxiety, as compared to the healthy control group. In contrast, no significant differences were found in state anxiety between pre- and post-scan sessions within either group or between the two groups. During the one-back face recognition task used in the fMRI study, accuracy (mean p standard error: SPP = 92.4p0.5%; HC = 93.5p0.5%, P = 0.15) was at ceiling level in both groups with no significant difference between the two groups. The schemes depicted in Figures 3 and 4 aimed to simplify and
to better characterize the complexity of both the distributed brain regions differentially correlated with each seed ROI separately in the two groups (Figure 3), and all the combinations of differential positive and negative correlations as resulted from the comparison between patients and healthy controls (Figure 4). An unbiased approach based on an automatic labeling of anatomically defined regions in the human brain was used as the best to provide a simplified report of results. We selected the 3D database of the Talairach–Tournoux Atlas (Lancaster et al., 1997, 2000), and superimposed onto this common atlas either those voxels correlated with a specific ROI in social phobic patients and healthy controls (Figure 3), or those voxels differentially recruited between the two groups (Figure 4). The simplified schemes of Figures 3 and 4 derive from correlation maps of Figures 1 and 2, respectively. At
FIGURE 1 | Brain areas positively (red) or negatively (blue) correlated (one-sample t-test; corrected P 0.05) with the seed ROIs [right fusiform gyrus/R-FG (A), right superior temporal sulcus/R-STS (B) and left Amygdala/L-Amy (C) in healthy controls (HC) (on the left) and social phobic patients (SPP) (on the right), respectively].Please note that brain inflated view could distort some clusters of significant correlation. DLPFC, dorsolateral prefrontal cortex; MPFC, medial prefrontal cortex; FEF, frontal eye
FIGURE 2 | Brain areas with stronger negative correlations in HC or with stronger positive correlation in SPP (red) and brain areas with stronger negative correlations in SPP or with stronger positive correlations in HC (blue) (unpaired t-test; uncorrected P 0.05) with the seed ROIs [right fusiform gyrus/R-FG (A), right superior temporal sulcus/R-STS (B) and left Amygdala/L-Amy (C)]. Please note that brain
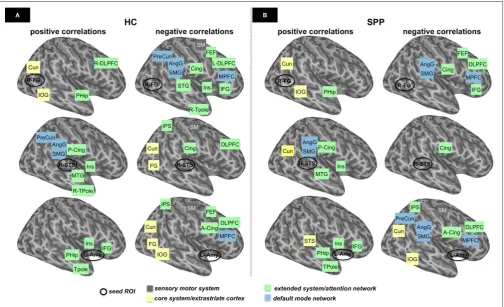
(green boxes). Sensorimotor (gray boxes) and DMN regions (light blue boxes) are also included in the functional networks shown in Figure 3.
The core system regions (bilateral fusiform gyri and R-STS) showed a distinct pattern of positive and negative functional correlations with brain areas of both the extended system and the DMN in social phobic patients as compared to healthy con-trols. Similarly, functional connectivity using the left amygdala as seed ROI showed a differential distributed network of positive and negative correlations with several areas of both the core and the extended systems in social phobic patients as compared to healthy controls.
Fusiform gyri
Correlation maps for the left and the right fusiform gyrus were consistent across subjects within the two groups, and no differences were identified in paired t-test between the left and the right con-nectivity networks (cluster-level corrected; P 0.05). Thus, only the description of the right fusiform gyrus network was reported. In both healthy controls and social phobic patients, the right fusiform Also, no significant difference in reaction time was found between
the two groups (SPP = 1120 p 110 ms; HC = 1031 p 112 ms,
P = 0.08) (see Gentili et al., 2008 for further details).
FUNCTIONAL CONNECTIVITY RESULTS
All seed ROIs were strongly connected to their contralateral homologous regions. Furthermore, each ROI showed addi-tional and specific positive and negative correlations with other brain regions.
In Figures 3A,B, we depicted a schematic representation of the functional networks previously showed in Figure 1. These diagrams represent the functional networks connected with the seed ROIs in the healthy control and the social phobic patient groups, respectively. These networks comprised areas of the core
and the extendedsystems, as defined in the face recognition model by Haxby et al. (2000). Thus, we grouped brain regions in a core system/extrastriate cortex, which includes occipito-temporal extrastriate cortical areas for the visual analysis of faces (yel-low boxes), and the extended/attention system, which includes fronto-tempo-parietal regions for further processing of the faces
FIGURE 3 | Schematic representation of the functional networks in healthy controls (HC) (A) and social phobic patients (SPP) (B), based on the results reported in Figure 1.Positive and negative correlations for these functional networks (one-sample t-test; corrected P 0.05) are shown in the first and second columns, respectively. Seed ROIs are indicated with a black circle [top: right fusiform gyrus (R-FG); middle: right superior temporal sulcus (R-STS); bottom: left amygdala (L-Amy), respectively]. Functionally correlated areas of the core system/ extrastriate cortex (yellow boxes), the extended/attention system (green boxes), default mode network (light blue boxes) and sensorimotor areas (gray boxes) are
system, including the dorsal prefrontal and superior temporal areas. Negative correlations were reported also in the sensorimotor corti-cal areas in healthy controls (Figures 3A,B, top row).
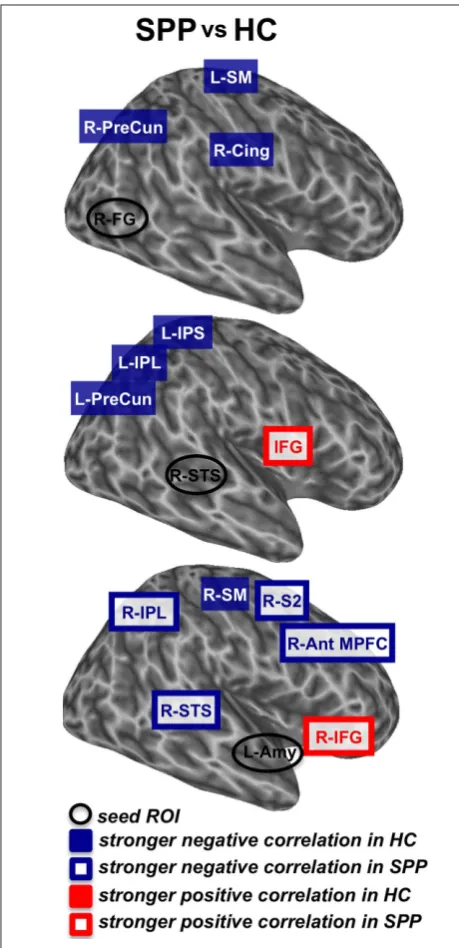
When the two groups were compared (uncorrected P 0.05; minimum cluster volume 1,000 µL), differences in the functional connectivity maps were found in the right precuneus (cluster-level corrected P 0.05), the right posterior cingulate and the left sensorimotor (BA3) cortical areas, with a stronger negative cor-relation in healthy controls as compared to social phobic patients (Figure 4, top).
Right superior temporal sulcus
In healthy controls, the R-STS correlated positively with the areas of the extended system (including temporal and insu-lar areas, and posterior cingulate) and the DMN (precuneus, angular gyrus and supramarginal cortex), and negatively with the sensorimotor and the dorsal prefrontal regions, the ven-tral extrastriate areas, the intraparietal sulci and the cingulate cortex. Social phobic patients showed a network of positive connections with the R-STS, whereas a significant negative cor-relation was found only in the cingulate cortex (Figures 3A,B, middle row).
Table 2 | t-score (unpaired t-test; uncorrected P 0.05) and Talairach– Tournoux Atlas coordinates for the local maxima of brain regions that show significant differences in the functional connectivity during face perception between social phobic patients and healthy controls.
Talairach coordinates
Brodmann Hemisphere Volume x y z t-score
area (µL)
RIGHT FUSIFORM GYRUS
Cing 23 R 2,176 7 60 6 2.3 PreCun 7 R 16,418 14 58 18 2.6 SM 3 L 2,205 59 6 14 2.2 SM 4 L 1,398 60 4 16 2.4
RIGHT SUPERIOR TEMPORAL SULCUS
IPL 40 L 1,448 34 51 38 2.4 IPS 7 L 2,360 26 49 43 2.9 IFG 44/6 L 1,820 63 5 14 2.2 IFG 44/6 R 1,203 55 8 14 2.2 PreCun 7 L 2,680 25 64 39 2.2
LEFT AMYGDALA
Ant MPFC 10 R 672 41 42 22 2.2 IFG 47 R 728 35 25 16 2.3 IPL 40 R 668 46 40 22 2.2 SM 5 R 710 5 42 53 2.2 (paracentral
lobule)
S2 3 R 607 43 25 30 2.3 STS 22 R 1,671 54 48 10 2.4
Cing, cingulate cortex; PreCun, precuneus; SM, sensory motor cortex; IPL, inferior parietal lobule; IPS, intraparietal sulcus; IFG, inferior frontal gyrus; Ant MPFC, anterior middle prefrontal cortex; S2, secondary somatosensory cortex; STS, superior temporal sulcus.
FIGURE 4 | Schematic representation of the differences in functional networks that resulted from the comparison of SPP vs. HC (unpaired
t-test; uncorrected P 0.05). Seed ROIs are indicated with a black circle [top: right fusiform gyrus (R-FG); middle: right superior temporal sulcus (R-STS); bottom: left amygdala (L-Amy), respectively]. Stronger negative correlations in HC (blue boxes), stronger negative correlations in SPP (white boxes with blue contour), stronger positive correlation in HC (red boxes) and stronger positive correlations in SPP (white boxes with red contour) refer to areas of these functional networks that are considered bilaterally, unless otherwise indicated. Ant MPFC, anterior middle prefrontal cortex; SM, sensorimotor cortex; S2, secondary somatosensory cortex; IFG, inferior frontal gyrus; IPS, intraparietal sulcus; IPL, inferior parietal lobule; PreCun, precuneus; STS, superior temporal sulcus; Cing, cingulate cortex; Amy, amygdala; FG, fusiform gyrus.
gyrus was positively correlated with the areas of the core system
Functional connectivity of regions of the core system for face perception, such as the bilateral fusiform gyri and the R-STS, showed in social phobic patients as compared to the healthy con-trols a distinct pattern of positive and negative functional correla-tions with brain areas of both the extended system and the DMN. For instance, both the right fusiform gyrus and R-STS showed a stronger negative correlation with the right precuneus in healthy controls as compared to social phobic patients. This is in line with our previous observation of a significantly smaller deactivation in the precuneus during face perception in social phobic patients as compared to healthy controls (Gentili et al., 2009). Consistently, precuneus abnormalities have been shown also in other anxiety disorders (Zhao et al., 2007). As the precuneus is a region of the DMN, this abnormal functional correlation is an additional piece of evidence in support of an impairment of the normal task-related activation/deactivation trade-off in Social Phobia. Since the pre-cuneus plays a role in self-focus perception, its altered connectivity may be related to the attentive bias described in anxiety disorders, which leads anxious subjects to attend to the physiological signs of anxiety and to experience negative self-evaluation, as originally hypothesized by Clark and Wells (1995).
Additionally, the R-STS showed a stronger negative correlation with the left inferior parietal (BA40) and anterior intraparietal (BA7) cortex in healthy controls as compared to social phobic patients. Differences between groups in the patterns of correla-tions within brain networks associated with attention and other aspects of face processing (e.g., increased visual scanpath length and reduced foveal fixations of the eyes in social phobic patients; Horley et al., 2004) are consistent with our previous findings that in social phobic patients face recognition is associated with decreased activity in parietal areas, independently from the emotional expres-sion of the facial stimuli (Gentili et al., 2008). Functional stud-ies with different social threatening stimuli (e.g., public speech) reported similar results of a reduced recruitment of attentional networks in social phobic patients as compared to healthy controls (Lorberbaum et al., 2004).
Recent studies have shown a stronger amygdala response in social phobic patients during a face recognition task not only with emo-tional facial expressions, but also with neutral faces (Birbaumer et al., 1998; Stein et al., 2002; Straube et al., 2004; Cooney et al., 2006; Phan et al., 2006; Gentili et al., 2008). Here, functional con-nectivity using the left amygdala as a seed ROI showed a differen-tial distributed network of positive and negative correlations that involved several areas within both the core system (superior temporal cortex) and the extended system (frontal and parietal cortical areas) for face recognition. Interestingly, the left amygdala was positively correlated with the inferior frontal/insular cortical regions only in patients with Social Phobia but not in healthy controls, in line with previous findings of a significantly increased response in the amy-gdala and insula during face recognition in social phobic patients as compared to healthy controls (Straube et al., 2004; Amir et al., 2005; Gentili et al., 2008). In particular, since the insular cortex is involved in the processing of socially threatening stimuli including anger, fear and disgust (Straube et al., 2004; Amir et al., 2005), the abnormal activity found in this brain region in social phobic patients as well as in patients with other anxiety disorders (Stein et al., 2007) may be associated to the dysfunctional monitoring of the bodily The group comparison (uncorrected P 0.05, minimum cluster
volume 1,000 µL) showed a stronger negative correlation in healthy controls as compared to social phobic patients in the left inferior parietal and the anterior intraparietal cortex and the left precuneus. In addition, social phobic patients showed a stronger positive cor-relation than healthy controls in the bilateral ventral premotor/ inferior frontal areas (BA44/6) (Figure 4, middle).
Left amygdala
In healthy controls, the left amygdala was positively correlated with areas of the extended system, including the parahippocampus, the anterior temporal, the insular and the inferior frontal areas. Conversely, the left amygdala in healthy controls was negatively correlated with a wide network including the anterior cingulate and the posterior parietal areas and the medial frontal cortex (extended/ attention system and DMN) and the ventral occipito-temporal regions (core system/extrastriate cortex). Social phobic patients showed a pattern of functional connectivity similar to healthy controls, though distinct positive and negative correlations were assessed (Figures 3A,B, bottom row).
The group comparison (uncorrected P 0.05, minimum cluster volume 500 µL) revealed a differential functional connectivity in several right-sided brain regions related to face recognition. Stronger negative correlations in social phobic patients were found in the superior temporal cortex (BA22), the inferior parietal, the ante-rior middle prefrontal and the postcentral (BA3) cortex, whereas a stronger positive correlation was found in social phobic patients in the inferior frontal regions (BA47). In contrast, stronger nega-tive correlation in healthy controls was described in the paracentral sensorimotor cortex (BA5) (Figure 4, bottom).
DISCUSSION
The present study was designed to examine both positive and negative functional correlations among brain regions within the distributed system for face perception in social phobic patients as compared to healthy controls. Specifically, a whole brain voxel-wise functional con-nectivity analysis was performed taking as seeds those cortical areas that had shown a differential activity in social phobic patients and in healthy controls in response to a face perception task with emotional and neutral stimuli (Gentili et al., 2008). These areas included the bilateral fusiform gyrus, the R-STS and the left amygdala.
Overall, social phobic patients and healthy controls showed different patterns of functional connectivity across brain regions within both the core and the extended systems for face perception (Haxby et al., 2000; Ishai et al., 2005; Benuzzi et al., 2007; Fairhall and Ishai, 2007; Ishai, 2008, 2010) as well as within the DMN (Raichle et al., 2001; Gusnard et al., 2001; Greicius et al., 2003). As accuracy and reaction times were similar in the two groups, the differences in brain functional connectivity cannot be due to differences in behavioral performance.
(Deary et al., 2004; Whalley et al., 2005). As far as the potential residual task effects are concerned, while we cannot rule out com-pletely that some residual effects may still be present, we would like to emphasize that we have modeled the task-related regressors as regressors of no interest exactly in the same manner that was adopted in the GLM analysis for the previous study by Gentili et al. (2008). Among the possible solutions to mitigate task-related effects, this procedure is certainly among the most valid (Deary et al., 2004; Whalley et al., 2005). The question of whether the cor-relation maps obtained with a functional connectivity approach can be comparable to the task-related patterns has been previously addressed (Biswal et al., 1995; Hampson et al., 2004; Damoiseaux et al., 2006; Mennes et al., 2010). For example, Hampson et al. (2004) directly compared the correlations between the motion sensitive area MT/V5 and other brain regions while subjects where in a resting state (that is, in the absence of any visual stimulation) and in an active stimulation state (that is, visual perception of concentric moving circles). The patterns of correlations obtained in the two different conditions greatly overlapped: while the active state correlations revealed brain regions more specifically related to visual motion processing (middle temporal and occipital cortex), the resting state correlations revealed a broader network including known functional pathways for general visual processing (lingual gyri and cuneus). Thus, while certainly a correlation analysis using resting state data would have been of interest in social phobic patients, based on the findings from the above studies we would expect a substantially similar picture.
In spite of the above discussed limitations and other issues whose discussion would fall far outside the topic of this study, it is undisputable that functional connectivity has made possi-ble to investigate the neural underpinnings of brain function in terms of cerebral networks rather than of a single, isolated brain structure (Horwitz et al., 2005; Kim and Horwitz, 2008; Stephan et al., 2008). Indeed, we would like to emphasize a concept that applies not only to this specific study but also to the investigations of functional connectivity in general. Disruption of functional connectivity, that is, of the way two or more regions are func-tionally related among themselves, may precede any measurable alteration of activity in any given region. That is, functional con-nectivity analysis is a powerful tool to identify brain abnormali-ties in pre-clinical and sub-clinical stages of a disorder. Indeed, this has been shown since the early days of PET studies (see for instance works by Horwitz et al., 1991; Azari et al., 1993; Pietrini et al., 1993, 2009; Grady et al., 2001; Zhang et al., 2010). Thus, individuals with sub-clinical manifestations of Social Phobia may show abnormal functional connectivity patterns in the absence of any absolute group difference in regional activity, similarly to what has been shown in other neuropsychiatric disorders. Furthermore, measures of functional connectivity may then be used to ascertain the effect of psychological or psychopharma-cological therapy.
Similarly, by looking at the spatiotemporal synchrony of BOLD signal among brain regions, functional connectivity studies are providing novel evidence that in anxiety disorders, including Social Phobia, a mis-communication among multiple brain areas involved in sensory and emotional processing may underlie the main psycho-pathological manifestations. This possibility is also sustained by the states of arousal associated with and contributing to the emotional
experience of anxiety (Damasio et al., 2000; Critchley et al., 2004). Thus, the specific communication between amygdala and inferior frontal cortex/insula found only in patients with Social Phobia may contribute to explain why anxiety patients process differently the emotional-relevant stimuli as compared to healthy controls.
LIMITATIONS OF THE STUDY AND OF THE FUNCTIONAL CORRELATION APPROACH
The present study of brain regional functional correlations has some limitations, both intrinsic to the specific experimental pro-tocol and, more in general, relative to the fcMRI approach itself.
The main specific limitation of the study is the relatively limited number of subjects. All the social phobic patients, however, had a diagnosis of pure Social Phobia without any other concomitant mental disorder. Equally important, all patients were drug-naïve at the time of the fMRI examinations, as they had never been treated before. These uncommon aspects make this sample of patients opti-mal to investigate brain functional connectivity in the absence of any interference due to previous exposure to drugs, psychotherapy or to the effects of concomitant psychopathology.
Correlations were run using predefined seed ROIs. While this may somewhat limit the ability to uncover potentially abnormal functional connectivity networks that originate from seeds dis-tinct from those used here, the selection derived from a strong a priori hypothesis that was based on solid evidence in the literature (Birbaumer et al., 1998; Stein et al., 2002; Straube et al., 2004; Phan et al., 2006; Gentili et al., 2008) and it was ideal to pursue the main goal of this hypothesis-driven study. Specifically, here we wished to determine whether or not the functional connectivity networks originating from brain regions involved in face perception and in emotional processing, and found to respond abnormally in social phobic patients as compared to healthy control subjects, also would be abnormal in the patient group.
Finally, from a more general perspective, while most of the processing steps of fcMRI data are widely agreed upon (e.g., Fox et al., 2005), some procedures, such as factoring out task-related regressors, or using the global BOLD signal as a regressor of no interest are still debated, and may limit the interpretation of specific findings, including the neural meaning of negative correlations (Deary et al., 2004; Whalley et al., 2005; Fox et al., 2009; Murphy et al., 2009; Weissenbacher et al., 2009).
For instance, the impact of preprocessing on sensitivity and spe-cificity of functional connectivity was recently investigated both in simulated data and in resting state datasets (Fox et al., 2009; Murphy et al., 2009; Weissenbacher et al., 2009). Though this debate is still ongoing, altogether these studies indicated that negative correla-tions may be in part introduced by global signal regression, and thus should be interpreted with caution. Moreover, while global signal regression may reduce the sensitivity for detecting true correla-tions, that is, increase the number of false negatives, it maximizes the specificity of positive resting state correlations, as well as the correction for white matter and ventricular time courses (Fox et al., 2009; Weissenbacher et al., 2009).
REFERENCES
American Psychiatric Association (APA). (2000). Diagnostic and Statistical Manual of Mental Disorders, 4th Edn., Text Revision. Washington, DC: Masson.
Amir, N., Klumpp, H., Elias, J., Bedwell, J. S., Yanasak, N., and Miller, L. S. (2005). Increased activation of the anterior cingulate cortex during processing of disgust faces in individuals with social phobia. Biol. Psychiatry 57, 975–981. Azari, N. P., Pietrini, P., Horwitz, B.,
Pettigrew, K. D., Leonard, H. L., Rapoport, J. L., Schapiro, M. B., and Swedo, S. E. (1993). Individual differ-ences in cerebral metabolic patterns during pharmacotherapy in obses-sive-compulsive disorder: a multiple regression/discriminant analysis of positron emission tomographic data. Biol. Psychiatry 34, 798–809. Benuzzi, F., Pugnaghi, M., Meletti, S., Lui,
F., Serafini, M., Baraldi, P., and Nichelli. P. (2007). Processing the socially rel-evant parts of faces. Brain Res. Bull. 74, 344–356.
Birbaumer, N., Grodd, W., Diedrich, O., Klose, U., Erb, M., Lotze, M., Schneider, F., Weiss, U., and Flor, H. (1998). fMRI reveals amygdala activation to human faces in social phobics. Neuroreport 9, 1223–1226.
Biswal, B., Yetkin, F. Z., Haughton, V. M., and Hyde, J. S. (1995). Functional connectivity in the motor cortex of resting human brain using echo-planar MRI. Magn. Reson. Med. 34, 537–541.
Campbell, D. W., Sareen, J., Paulus, M. P., Goldin, P. R., Stein, M. B., and Reiss, J. P. (2007). Time-varying amygdala response to emotional faces in gener-alized social phobia. Biol. Psychiatry 62, 455–463.
Clark, D. M., and Wells, A. (1995). “A cognitive model of social phobia,” in Social Phobia: Diagnosis, Assessment and Treatment, eds R. G. Heimberg, M. R. Liebowitz, D. A. Hope, and F. R. Schneier (New York: Guildford Press), 69–93.
Cohen, M. S. (1997). Parametric analy-sis of fMRI data using linear systems methods. Neuroimage 6, 93–103. Cooney, R. E., Atlas, L. Y., Joormann, J.,
Eugène, F., and Gotlib, I. H. (2006). Amygdala activation in the processing of neutral faces in social anxiety disor-der: is neutral really neutral? Psychiatry Res. 148, 55–59.
Cordes, D., Haughton, V. M., Arfanakis, K., Carew, J. D., Turski, P. A., Moritz, C. H., Quigley, M. A., and Meyerand, M. E. (2001). Frequencies contrib-uting to functional connectivity in the cerebral cortex in “resting-state” data. Am. J. Neuroradiol. 22, 1326–1333.
Cox, B. (1996). AFNI: software for analysis and visualization of functional mag-netic resonance neuroimages. Comput. Biomed. Res. 29, 162–173.
Critchley, H. D., Wiens, S., Rotshtein, P., Ohman, A., and Dolan, R. J. (2004). Neural systems supporting intero-ceptive awareness. Nat. Neurosci. 7, 189–195.
Damasio, A. R., Grabowski, T. J., Bechara, A., Damasio, H., Ponto, L. L., Parvizi, J., and Hichwa, R. D. (2000). Subcortical and cortical brain activity during the feeling of selfgenerated emotions. Nat. Neurosci. 3, 1049–1056.
Damoiseaux, J. S., Rombouts, S. A., Barkhof, F., Scheltens, P., Stam, C. J., Smith, S. M., and Beckmann, C. F. (2006). Consistent resting-state networks across healthy subjects. Proc. Natl. Acad. Sci. U.S.A. 103, 13848–13853.
Deary, I. J., Simonotto, E., Meyer, M., Marshall, A., Marshall. I., Goddard, N. H., and Wardlaw, J. M. (2004). The functional anatomy of inspection time: an event-related fMRI study. Neuroimage 22, 1466–1479. Desjardins, A. E., Kiehl, K. A., and Liddle,
P. F. (2001). Removal of confound-ing effects of global signal in func-tional MRI analyses. Neuroimage 13, 751–758.
Ekman, P., and Friesen, W. V. (1976). Measuring facial movement. Environ. Psychol. Nonverbal Behav. 1, 56–75. Engell, A. D., and Haxby, J. V. (2007).
Facial expression and gaze-direction in human superior temporal sulcus. Neuropsychologia 45, 3234–3241. Esposito, F., Aragri, A., Latorre, V.,
Popolizio, T., Scarabino, T., Cirillo, S., Marciano, E., Tedeschi, G., and Di Salle, F. (2009). Does the default-mode functional connectivity of the brain correlate with working-memory performances? Arch. Ital. Biol. 147, 11–20.
Fairhall, S. L., and Ishai, A. (2007). Effective connectivity within the distributed cortical network for face perception. Cereb. Cortex 17, 2400–2406. Fox, M. D., Snyder, A. Z., Vincent, J. L.,
Corbetta, M., Van Essen, D. C., and Raichle, M. E. (2005). The human brain is intrinsically organized into dynamic, anticorrelated functional networks. Proc. Natl. Acad. Sci. U.S.A. 102, 9673–9678.
Fox, M. D., Zhang, D., Snyder, A. Z., and Raichle, M. E. (2009). The global signal and observed anticorrelated resting state brain networks. J. Neurophysiol. 101, 3270–3283.
Friston, K. J. (1994). Functional and effec-tive connectivity in neuroimaging: a synthesis. Hum. Brain Mapp. 2, 56–78.
Friston, K. J., Buechel, C., Fink, G. R., Morris, J., Rolls, E., and Dolan, R. J. (1997). Psychophysiological and mod-ulatory interactions in neuroimaging. Neuroimage 6, 218–229.
Gentili, C., Gobbini, M. I., Ricciardi, E., Vanello, N., Pietrini, P., Haxby, J. V., and Guazzelli, M. (2008). Differential modulation of neural activity through-out the distributed neural system for face perception in patients with Social Phobia and healthy subjects. Brain Res. Bull. 77, 286–292.
Gentili, C., Ricciardi, E., Gobbini, M. I., Santarelli, M. F., Haxby, J. V., Pietrini, P., and Guazzelli, M. (2009). Beyond amygdala: default mode network activity differs between patients with social phobia and healthy controls. Brain Res. Bull. 79, 409–413. Grady, C. L., Furey, M. L., Pietrini, P.,
Horwitz, B., and Rapoport, S. I. (2001). Altered brain functional connectivity and impaired short-term memory in Alzheimer’s disease. Brain 124, 739–756.
Greicius, M. D., Krasnow, B., Reiss, A. L., and Menon, V. (2003). Functional connectivity in the resting brain: a network analysis of the default mode hypothesis. Proc. Natl. Acad. Sci. U.S.A. 100, 253–258.
Gusnard, D. A., Akbudak, E., Shulman, G. L., and Raichle, M. E. (2001). Medial prefrontal cortex and self-referential mental activity: relation to a default mode of brain func-tion. Proc. Natl. Acad. Sci. U.S.A. 98, 4259–4264.
Hampson, M., Olson, I. R., Leung, H. C., Skudlarski, P., and Gore, J. C. (2004). Changes in functional con-nectivity of human MT/V5 with visual motion input. Neuroreport 15, 1315–1319.
may represent at a neurobiological level the behavioral impairment reported by these patients when exposed to faces (Clark and Wells, 1995; Winton et al., 1995; Lundh and Ost, 1996; Spurr and Stopa, 2002; Horley et al., 2004; Gentili et al., 2009). From a behavioral point of view, social phobic patients show an increase of the fear of negative evaluation and wariness of the others (Schultz and Heimberg, 2008). Therefore, we speculate that the increasing of amygdala–limbic connectivity may represent the neurobiological correlate of this psychopathological aspect.
ACKNOWLEDGMENTS
This research was supported in part by the Fondazione IRIS, Castagneto Carducci (Livorno, Italy). The authors wish to thank Giulio Perugi for help in recruiting social phobic patients, and Massimo Lombardi for running the MRI Laboratory at the Fondazione “G. Monasterio” (Pisa, Italy). We also thank Domenico Montanaro and Franco Lombardo for neuroradiological examinations, Giacomo Handjaras and Lorenzo Sani for their advice on data analysis. evidence that DMN areas are abnormally recruited in the rest/task
trade-off in social phobic patients, and thus may be associated to a different baseline-rest neural activity (Gentili et al., 2009).
In conclusion, the results of this study indicate that the dynamic cross talking among different areas of the wide network involved in face perception is altered in drug-naïve social phobic patients as com-pared to healthy individuals. In this interpretative framework, in social phobic patients hyperactivity of regions engaged in emotional expres-sion (amygdala and insula) and facial recognition (superior temporal areas) may be related to the wariness of the others. At the same time, hypoactivation of regions engaged in face perception (fusiform gyrus) and attention (fronto-parietal network) may be related to a weaker cognitive control on the social situation (Lorberbaum et al., 2004).
Correlations and anticorrelations in resting-state functional connectivity MRI: a quantitative comparison of preprocessing strategies. Neuroimage 47, 1408–1416.
Whalley, H. C., Simonotto, E., Marshall, I., Owens, D. G., Goddard, N. H., Johnstone, E. C., and Lawrie, S. M. (2005). Functional disconnec-tivity in subjects at high genetic risk of schizophrenia. Brain 128, 2097–2108.
Winston, J. S., O’Doherty, J., and Dolan, R. J. (2003). Common and distinct neural responses during direct and incidental processing of multiple facial emotions. Neuroimage 20, 84–97.
Winston, J. S., Henson, R. N., Fine-Goulden, M. R., and Dolan, R. J. (2004). fMRI-adaptation reveals dissociable neural representations of identity and expression in face perception. J. Neurophysiol. 92, 1830–1839.
Winton, E. C., Clark, D. M., and Edelmann, R. J. (1995). Social anxiety, fear of negative evaluation and the detection of negative emotion in others. Behav. Res. Ther. 33, 193–196.
Zhang, H. Y., Wang, S. J., Liu, B., Ma, Z. L., Yang, M., Zhang, Z. J., and Teng, G. J. (2010). Resting brain connec-tivity: changes during the progress of Alzheimer disease. Radiology 256, 598–606.
Zhao, X. H., Wang, P. J., Li, C. B., Hu, Z. H., Xi, Q., Wu, W. Y., and Tang, X. W. (2007). Altered default mode network activity in patient with anxiety disor-ders: an fMRI study. Eur. J. Radiol. 63, 373–378.
Conflict of Interest Statement: The authors declare that the research was con-ducted in the absence of any commercial or financial relationships that could be con-strued as a potential conflict of interest.
Received: 12 July 2010; accepted: 19 October 2010; published online: 22 November 2010.
Citation: Danti S, Ricciardi E, Gentili C, Gobbini MI, Pietrini P and Guazzelli M (2010) Is Social Phobia a communication” disorder? Brain func-tional connectivity during face perception differs between patients with Social Phobia and healthy control subjects. Front. Syst. Neurosci. 4:152. doi: 10.3389/ fnsys.2010.00152
Copyright © 2010 Danti, Ricciardi, Gentili, Gobbini, Pietrini and Guazzelli. This is an open-access article subject to an exclusive license agreement between the authors and the Frontiers Research Foundation, which permits unrestricted use, distribution, and reproduction in any medium, provided the original authors and source are credited. posttraumatic stress disorder: a
func-tional MRI study. Biol. Psychiatry 47, 769–776.
Rich, B. A., Fromm, S. J., Berghorst, L. H., Dickstein, D. P., Brotman, M. A., Pine, D. S., and Leibenluft, E. (2008). Neural connectivity in children with bipolar disorder: impairment in the face emo-tion processing circuit. J. Child Psychol. Psychiatry 49, 88–96.
Rogers, B. P., Morgan, V. L., Newton, A. T., and Gore, J. C. (2007). Assessing Functional Connectivity in the Human Brain by fMRI. Magn. Reson. Imaging 25, 1347–1357.
Schultz, L. T., and Heimberg, R. G. (2008). Attentional focus in social anxiety disorder: potential for inter-active processes. Clin. Psychol. Rev. 28, 1206–1221.
Spielberger, C. D., Gorsuch, R. L., and Lushene, R. E. (1970). Manual for the State-Trait Anxiety Inventory. Palo Alto, CA: Consulting Psychologists Press.
Spurr, J. M., and Stopa, L. (2002). Self-focused attention in social phobia and social anxiety. Clin. Psychol. Rev. 22, 947–975.
Stein, M. B., Goldin, P. R., Sareen, J., Zorrilla, L. T., and Brown, G. G. (2002). Increased amygdala activation to angry and contemptuous faces in generalized social phobia. Arch. Gen. Psychiatry 59, 1027–1034.
Stein, M. B., Simmons, A. N., Feinstein, J. S., and Paulus, M. P. (2007). Increased amygdala and insula activation dur-ing emotion processdur-ing in anxiety-prone subjects. Am. J. Psychiatry 164, 318–327.
Stephan, K. E., Riera, J. J., Deco, G., and Horwitz, B. (2008). The brain con-nectivity workshops: moving the frontiers of computational systems neuroscience. Neuroimage 42, 1–9. Straube, T., Kolassa, I. T., Glauer, M.,
Mentzel, H. J., and Miltner, W. H. (2004). Effect of task conditions on brain responses to threatening faces in social phobics: an event-related func-tional magnetic resonance imaging study. Biol. Psychiatry 56, 921–930. Talairach, J., and Tournoux, P. (1988).
Coplanar Stereotaxic Atlas of the Human Brain. New York: Thieme Medical.
Wang, F., Kalmar, J. H., He, Y., Jackowski, M., Chepenik, L. G., Edmiston, E. E., Tie, K., Gong, G., Shah, M. P., Jones, M., Uderman, J., Constable, R. T., and Blumberg, H. P. (2009). Functional and structural connectivity between the perigenual anterior cingulate and amygdala in bipolar disorder. Biol. Psychiatry 66, 516–521.
Weissenbacher, A., Kasess, C., Gerstl, F., Lanzenberger, R., Moser, E., and Windischberger, C. (2009). Leary, M. R., and Kowalski, R. M.
(1993). The interaction anxious-ness scale: construct and criterion-related validity. J. Personal Assess. 61, 136–146.
Liebowitz, M. R. (1987). Social phobia. Mod. Probl. Pharmacopsychiatry 22, 141–173.
Lorberbaum, J. P., Kose, S., Johnson, M. R., Arana, G. W., Sullivan, L. K., Hamner, M. B., Ballenger, J. C., Lydiard, R. B., Brodrick, P. S., Bohning, D. E., and George, M. S. (2004). Neural corre-lates of speech anticipatory anxiety in generalized social phobia. Neuroreport 15, 2701–2705.
Lundh, L. G., and Ost, L. G. (1996). Recognition bias for critical faces in social phobics. Behav. Res. Ther. 34, 787–794.
Macey, P. M., Macey, K. E., Kumar, R., and Harper, R. M. (2004). A method for removal of global effects from fMRI time series. Neuroimage 22, 360–366.
Mennes, M., Kelly, C., Zuo, X. N., Di Martino, A., Biswal, B. B., Castellanos, F. X., and Milham, M. P. (2010). Inter-individual differences in resting-state functional connectivity predict task-induced BOLD activity. Neuroimage 50, 1690–1701.
Murphy, K., Birn, R. M., Handwerker, D. A., Jones, T. B., and Bandettini, P. A. (2009). The impact of global signal regres-sion on resting state correlations: are anti-correlated networks introduced? Neuroimage 44, 893–905.
Phan, K. L., Fitzgerald, D. A., Nathan, P. J., and Tancer, M. E. (2006). Association between amygdala hyperactivity to harsh faces and severity of social anxi-ety in generalized social phobia. Biol. Psychiatry 59, 424–429.
Pietrini, P., Azari, N. P., Grady, C. L., Salerno, J. A., Gonzales-Aviles, A., Heston, L. L., Pettigrew, K. D., Horwitz, B., Haxby, J. V., and Schapiro, M. B. (1993). Pattern of cerebral metabolic interactions in a subject with isolated amnesia at risk for Alzheimer’s disease: a longitudinal evaluation. Dementia 4, 94–101. Pietrini, P., Salmon, E., and Nichelli, P.
(2009). “Consciousness and demen-tia: how the brain loses its self,” in The Neurology of Consciousness: Cognitive Neuroscience and Neuropathology, eds S. Laureys and G. Tononi (Oxford: Academic Press), 204–216. Raichle, M. E., MacLeod, A. M., Snyder, A.
Z., Powers, W. J., Gusnard, D. A., and Shulman, G. L. (2001). A default mode of brain function. Proc. Natl. Acad. Sci. U.S.A. 98, 676–682.
Rauch, S. L., Whalen, P. J., Shin, L. M., McInerney, S. C., Macklin, M. L., Lasko, N. B., Orr, S. P., and Pitman, R. K. (2000). Exaggerated amygdala response to masked facial stimuli in Haxby, J. V., Hoffman, E. A., and Gobbini,
M. I. (2000). The distributed human neural system for face perception. Trends Cogn. Sci. 4, 223–233. Horley, K., Williams, L.M., Gonsalvez, C.,
and Gordon, E. (2004). Face to face: visual scanpath evidence for abnormal processing of facial expressions in social phobia. Psychiatry Res. 127, 43–53. Horwitz, B. (2003). The elusive concept
of brain connectivity. Neuroimage 19, 466–470.
Horwitz, B., Friston, K. J., and Taylor, J .G. (2000). Neural modeling and functional brain imaging: an overview. Neural Netw. 13, 829–846.
Horwitz, B., Swedo, S. E., Grady, C. L., Pietrini, P., Schapiro, M. B., Rapoport, J. L., and Rapoport, S. I. (1991). Cerebral metabolic pattern in obsessive-compulsive disorder: altered intercorrelations between regional rates of glucose utilization. Psychiatry Res. 40, 221–237.
Horwitz, B., Warner, B., Fitzer, J., Tagamets, M. A., Husain, F. T., and Long, T. W. (2005). Investigating the neural basis for functional and effective connectiv-ity. Application to fMRI. Philos. Trans. R. Soc. Lond., B. Biol. Sci. 360, 1093–1108. Ishai, A. (2008). Let’s face it: it’s a cortical
network. Neuroimage 40, 415–419. Ishai, A. (2010). Seeing faces and objects
with the “mind’s eye”. Arch. Ital. Biol. 148, 1–9.
Ishai, A., Schmidt, C. F., and Boesiger, P. (2005). Face perception is mediated by a distributed cortical network. Brain Res. Bull. 67, 87–93.
Killgore, W. D., and Yurgelun-Todd, D. A. (2005). Social anxiety predicts amygdala activation in adolescents viewing fearful faces. Neuroreport 16, 1671–1675.
Kim, J., and Horwitz, B. (2008). Investigating the neural basis for fMRI-based functional connectiv-ity in a blocked design: application to interregional correlations and psycho-physiological interactions. Magn. Reson. Imaging 26, 583–593. Lancaster, J. L., Rainey, L. H., Summerlin,
J. L., Freitas, C. S., Fox, P. T., Evans, A. C., Toga, A. W., and Mazziotta, J. C. (1997). Automated labeling of the human brain: a preliminary report on the development and evaluation of a forward-transform method. Hum. Brain Mapp. 5, 238–242.
Lancaster, J. L., Woldorff, M. G., Parsons, L. M., Liotti, M., Freitas, C. S., Rainey, L., Kochunov, P. V., Nickerson, D., Mikiten, S. A., and Fox, P. T. (2000). Automated Talairach atlas labels for functional brain mapping. Hum. Brain Mapp. 10, 120–131.