4522 DEVELOPMENT AND VALIDATION OF STABILITY INDICATING RP-HPLC METHOD FOR SIMULTANEOUS ESTIMATION OF ARTEROLANE MALEATE
AND PIPIERAQUINE PHOSPHATE IN BULK AND TABLET DOSAGE FORM
V. Vishwavani* 1, M. Paul Richards2
Unity College of Pharmacy, Raigir (V), Bhongir (M), Yadadri Bhongir (Dt).
*Corresponding author E-mail: [email protected]
ARTICLE INFO ABSTRACT
Key Words
Arterolane maleate , Piperaquine phosphate, Limits of quantification , limits of detection .
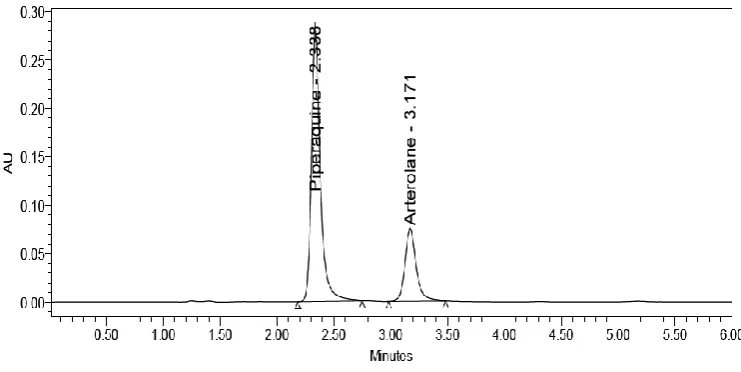
The drug of Arterolane maleate and Piperaquine phosphate were injected into the HPLC system and run in different solvent systems. From the overlaid spectra, 228 nm was selected as analytical wavelength for multi component analysis using HPLC method. The marketed solution was analyzed for the estimation of drug by proposed method. The system suitability parameters were evaluated from standard Chromatograms obtained, by calculating the % RSD of retention times, tailing factor, theoretical plates and peak areas from five replicate injections.Assay was performed in triplicate for various concentrations of Arterolane maleate and Piperaquine phosphate equivalent to 50, 100 and 150 % of the levels was injected into the HPLC system per the test procedure. The average % recovery of both Arterolane maleate and Piperaquine phosphate was calculated and the results were summarized. The accuracy studies were shown as % recovery for Arterolane maleate and Piperaquine phosphate at 50%, 100% and 150% the limits of % recovered Shown be in the range of 98-102% the results obtained for Arterolane maleate and Piperaquine phosphate were found to be within the limits. Hence the method was found to be accurate. In the System precision study, %RSD was found to be less than 2%. For Arterolane maleate and Piperaquine phosphate within limits .which indicates that the system has good reproducibility. Retention times were found to be 3.171min and 2.338min. for Arterolane maleate and Piperaquine phosphate respectively. Arterolane maleate shows linearity in the range of 0-180ppm Limit of detection (LOD) and Limit of quantification (LOQ) were estimated from the signal-to-noise ratio. The LOD values of Arterolane maleate and Piperaquine phosphate were found to be 0.087634, 0.722994 respectively. hence a new rp-HPLC method was developed and validated.
INTRODUCTION:
Arterolane maleate Chemicaly cis-Adamantane-2-spiro-3’-8’-[[[(2’- amino-2’-methylpropyl) amino] carbonyl] methyl]-1’, 2’, 4- trioxaspiro [4.5] decane hydrogen maleate and its molecular formula C26H40N2O8 belongs to category
anti malarial and soluble in water and methanol and it is acting rapidly on blood schizonticide against all blood stages of P. falciparum without effect on liver stages and acts by inhibition of PfATP6, a sarcoplasmic endoplasmic reticulum calcium ATPase encoded by P. Falciparum. Piperaquine Phosphate
An Elsevier Indexed Journal ISSN-2230-7346
4523 chemicaly 1, 3- Bis [4- (7- chloro
quinolinyl-4) - piperazinyl-1] propane tetra phosphate tetra hydrate and molecular formula C29H32Cl2N6 •4H3PO4 •4H2O belongs to category Anti malarial and soluble in Water, Trifluoroacetic acid, Acetonitrile Piperaquine is a bisquinoline anti-malarial drug and shows good activity against chloroquine-resistant Plasmodium strains. Evidence suggesting the inhibition of the heme-digestion pathway in the parasite food vacuole is most convincing.
MATERIALS AND METHODS
Chemical reagents include ortho phosphoric buffer, ACN and Water of HPLC grade. Samples and standard were procured from Ranbaxy Pharma Ltd and HPLC Waters 2695 using Empower.
Preparation of mobile phase:
Buffer preparation: (0.1% OPA)
In the preparation of 0.1% ortho phosphoric buffer, 1ml of ortho phosphoric acid was diluted to 1000ml with water.
Mobile phase: Buffer and Acetonitrile taken in the ratio 70:30A
Preparation of standard stock solution:
Accurately Weighed and transferred 12mg of Arterolane and 60mg of Piperaquine working Standards into a 10ml clean dry volumetric flask, add 3/4th volume of diluent, sonicated for 5 minutes and make up to the final volume with diluents. 1ml from the above two stock solutions was taken into a 10ml volumetric flask and made up to 10ml.
Selection of analytical wavelength:
By appropriate dilution of standard stock solution with mobile phase, various concentrations of Arterolane maleate and Piperaquine phosphate were prepared separately. The solution was scanned using
double beam UV-visible
spectrophotometer 1700 in the “Spectrum mode” between the range of 400 to 200 nm and their spectra was overlaid. From the overlaid spectra of Arterolane maleate and Piperaquine phosphate, 228 nm was selected as analytical wavelength for multi component analysis using HPLC method.
Analysis of the marketed formulation.
5 tablets were weighed and calculate the average weight of each tablet then the weight equivalent to 900mg and transferred into a 250mL volumetric flask, 200mL of diluents added and sonicated for 25 min, further the volume made up with diluents. The solution was filtered through 0.4 µm membrane filter paper. From the filtered solution 0.4ml was pipeted out into a 10 ml volumetric flask and made upto 10ml with diluents.
METHOD VALIDATION
System suitability:
Stock solution-II of (Arterolane maleate and Piperaquine phosphate) standard was injected five times into HPLC system as per test procedure. The system suitability parameters were evaluated from standard Chromatograms obtained, by calculating the % RSD of retention times, tailing factor, theoretical plates and peak areas from five replicate injections.
PRECISION:
In Intraday precision the sample mixture containing 12 µg/ml of Arterolane maleate and 60 µg/ml of Piperaquine phosphate was analyzed six times at different time intervals on the same day the variation of the results within the same day was analyzed and statistically validated.
ACCURACY:
4524 equivalent to 50, 100 and 150 % of the
levels was injected into the HPLC system per the test procedure.
LINEARITY:
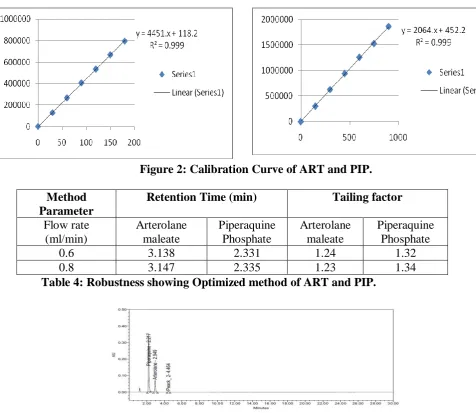
Preparation of calibration curve for Arterolane maleate and Piperaquine phosphate. Evaluation of both drugs was performed with UV detector at 228nm. Peak areas were recorded for all the peaks and peak areas were plotted against the concentrations to obtain the standard calibration curves.
SOLUTION STABILITY:
Preparated solution is kept under ideal storage conditions for 24hrs.Then the solution was injected into the chromatograph.
ROBUSTNESS
The robustness of the proposed method was determined by analysis of aliquots from homogenous lots by differing physical parameters like flow rate and column oven temperature which may differ but the responses were still within the specified limits of the assay keeping flow rates 0.8ml / min and 1.2 ml / min by changing the oven temperature i.e.300C to 250C and 350C Standard solution was prepared and injected into the HPLC phase by changing the mobile phase i.e. 70:30 to 60:40 and 80:20.
LIMIT OF DETECTION (LOD) and LIMIT OF QUANTIFICATION (LOQ)
From the S/N ratio of the standard, LOD concentration was calculated the for S/N ratio of 3 and 10.
DEGRADATION STUDIES:
Oxidation:
To 1 ml of stock solution of Arterolane and Piperaquine, 1 ml of 20% hydrogen peroxide (H2O2) was added
separately. The solutions were kept for 30 min at 600c.
Acid and Alkali Degradation Studies:
To 1 ml of stocks solution Arterolane and Piperaquine, 1ml of 2N Hydrochloric acid was added and refluxed for 30mins at 600c. The resultant solution was diluted to obtain 120µg/ml&600µg/ml solution and 10 µl were injected into the system.
Dry Heat Degradation Studies:
The standard drug solution was placed in oven at 105°C for 6 h to study dry heat degradation.
Photo Stability studies:
The photochemical stability of the drug was also studied by exposing the 300µg/ml&10µg/ml&25µg/ml solution to UV Light by keeping the beaker in UV Chamber for 7days or 200 Watt hours/m2 in photo stability chamber.
Neutral Degradation Studies:
Stress testing under neutral conditions was studied by refluxing the drug in water for 6hrs at a temperature of 60º.
RESULTS AND DISCUSSION
4525 Figure 1: Chromatogram Showing Optimized method of PIP and ART.
Table 1: Solution Stability showing Optimized method of PIP and ART.
S.NO Retention time Area of ART
Area of PIP USP Plate count USP Tailing
ART PIP
ART PIP
1
3.134 2.319
504436 1224007 5432 4586 1.15
2 507669 1234556 5558 4735 1.17
3 504931 1242950 5600 4824 1.17
4 503936 1233612 5511 4602 1.14
5 507007 1234208 5540 4662 1.16
Mean 505596 1233867
Std. Dev.
1645.6 6715.3
% RSD 0.3 0.5
Inj No. Sample area ART
Sample area PIP
% Assay
1 504261 1240338 99.63
2 508217 1232739 100.41
3 510004 1230238 100.77
4 502347 1240969 99.25
5 510835 1242669 100.93
6 502328 1227452 99.25
Avg 506332 1235734 100.04
STD 3834.452 6394.745
4526 Table 2: Precision showing Optimized method of ART and PIP.
S.no Spike level
Area ART Area PIP Tailing % Recovery
1
50% 252212 613864 1.19 99.66
50% 255054 620523 1.16 100.79
50% 253523 612719 1.21 100.18
2
100% 504261 1240338 1.18 99.63
100% 508217 1230238 1.20 100.41
100% 505531 1226489 1.23 99.88
3
150% 760027 1860446 1.25 100.11
150% 758190 1851686 1.25 99.87
150% 757977 1858983 1.25 99.84
Table 3: Accuracy showing Optimized method of ART and PIP.
Figure 2: Calibration Curve of ART and PIP.
Method Parameter
Retention Time (min) Tailing factor
Flow rate (ml/min)
Arterolane maleate
Piperaquine Phosphate
Arterolane maleate
Piperaquine Phosphate
0.6 3.138 2.331 1.24 1.32
0.8 3.147 2.335 1.23 1.34
Table 4: Robustness showing Optimized method of ART and PIP.
4527 Then the solution was injected into the
chromatograph. The robustness of the proposed method was determined by analysis of aliquots from homogenous lots by differing physical parameters like flow rate and column oven temperature which may differ but the responses were still within the specified limits of the assay. The LOD and LOQ were calculated based on S/N ratio. Forced, Dry Heat, Photo Stability and Neutral Degradation studies were also conducted for acid and alkali and results are summarised within the limit.
Acknowledgement:
I hereby acknowledge to Ranbaxy for giving sample drug for my Research Work. And also Gratitude towards Unity College of Pharmacy management for to support in Chemicals and reagents.
REFERENCES:
1. Vogel’s, Textbook of quantitative inorganic analysis, 4th ed. 1-12. 2. Beckett AH, Stenlake JB. Practical
pharmaceutical chemistry, CBS Publishers and Distributors; Delhi, 4th Ed, volume 2: 157-174, 1997. 3. Sharma BK. Instrumental methods
of chemical analysis, Goel Publishing House; Meerut, 19th Ed, 2000.
4. Snyder LR, Kirkland JJ, Joseph LG. Practical HPLC Method Development, Wiley Inter Science; New York, 2nd Ed, p.1-56, 234-289,685-712, 1997
5. Willard HH, Merrit LL, Dean JA, Settle FA. Instrumental methods of analysis. 6th Ed. New Delhi: CBS Publishers and Distributors; 1-15, 1986.
6. Douglas A. Skoog, F. James Holler, Timothy A. Nieman, Principles of instrumental analysis 725-760. 7. Gurdeep R.chatwal, Sham
K.Anand, Instrumental methods of chemical analysis, 2007.
8. David G.Watson. Pharmaceutical Analysis, A text book for Pharmacy students and Pharmaceutical Chemists. Harcourt Publishers Limited; 2nd Ed., 221-232, 267-311.
9. Remingtonn’s The Science and Practise of Pharmacy,20th Edition 2000.
10.www.who.int.
11. Connors KA. A Textbook of Pharmaceutical Analysis, Wiley intersciences Inc; Delhi, 3rd Ed, 373-421, 1994.
12. ICH Q2 (R1), Validation of Analytical Procedures Text and Methodology November 2005. 13. Gurdeep R.chatwal, Sham
K.Anand, Instrumental methods of chemical analysis, 2.566-2.638, 2007.
14. David G.Watson. Pharmaceutical Analysis, A text book for Pharmacy students and Pharmaceutical Chemists. Harcourt Publishers Limited; 2nd Ed., 221-232, 267-311.