DEVELOPMENT AND VALIDATION OF BIOANALYTICAL METHOD FOR
ESTIMATION OF DARIFENACIN HYDROBROMIDE IN DOSAGE FORM
USING β-NAPHTHOL
N.Raghavendra Babu*, K. Akshitha Reddy, Y.Padmavathi, P.Ravi Kumar, D.Venkat Vijaya Department of Pharmaceutical analysis, G.Pulla Reddy college of Pharmacy, Mehdipatnam, Hyderabad, India.
*Corresponding Author’s E mail: [email protected]
Received 18 Jun 2018; Revised 26 June 2018; Accepted 3 July 2018, Available online15 July 2018.
ABSTRACT
A sensitive visible spectrophotometric method was developed and validated for the estimation of darifenacin hydrobromide in the pharmaceutical dosage form using diazo coupling reaction with the chromogenic reagent β naphthol forms a yellow coloured diazo complex with darifenacin hydrobromide. Analysis was carried out at its λmax 384nm and the method was validated according to USFDA guidelines. The method obeys the Beer’s law in the concentration range of 40-140ng/ml. The correlation coefficient was found to be 0.999. As the method was sensitive, it was successfully applied to the analysis of darifenacin hydrobromide in spiked rat plasma.
Keywords: β-naphthol, darifenacin hydrobromide, spectrophotometric determination and USFDA guidelines.
INTRODUCTION
Darifenacin Hydrobromide1-3 chemically known as (S)-2-{1-[2-(2, 3-dihydrobenzofuran-5-yl)ethyl]-3-pyrrolidinyl}-2,2-diphenylacetamide hydrobromide. Its empirical formula is C28H30N2O2.HBr
representing molecular weight of 507.5.It is white to almost white monomorphic crystalline solid, soluble
in water (<1mg/mL at 25˚C), chloroform (117mg/mL at 25˚C) and methanol and ethanol (<1mg/mL at 25˚C) and its melting point is 228-230˚C.It is used to treat an overactive bladder by relaxing the muscles in the bladder.
Darifenacin is a selective muscarinic M3 receptor antagonist. This M3 receptor is the major subtype that
controls urinary bladder muscle contraction. By blocking muscarinic receptors inthe bladder,
intravesicular pressure is lowered, bladder capacity is increased, and the frequency of bladder
contractions is reduced.
Literature review19-24 reveals that there are very few methods such as RP-HPLC, LC/MS-MS, UV and
Fig.1: Chemical structure of Darifenacin Hydrobromide.
MATERIALS AND METHODS Chemicals and reagents
The Darifenacin Hydrobromide4-6 was supplied as gift sample from Aurobindo Pharmaceuticals pvt Ltd.
Hyderabad. The tablet dosage form (Darilong) 7.5mg manufactured by Sun Pharma laboratories ltd,
Jammu was purchased from local pharmacy. β-naphthol, Sodium nitrite, Hydrochloric acid (Analytical
reagent grade) were obtained from Sd fine chemicals limited (SDFCL), Mumbai. Ethanol was obtained
from Merck specialties private limited, Mumbai.
Instruments
UV-visible spectrophotometer (Shimadzu 1800), pH meter (Elico LI-127), Digital balance (Shimadzu
BL220H). Ultrasonic bath sonicator (PCI Analytics 6.5li200H), Refrigerated Centrifuge
(EltekRC4100F), Hot Air Oven (Tempo Equipment Private Limited).
Experimental animals
Male Albino Wistar rats (180-200 g) were obtained from National Institute of Nutrition, Hyderabad.
Method development
Preparation of β-Naphthol (1%w/v)
Dissolve 100 mg of β-naphthol in 10 mL of distilled water.
Preparation of 0.1% sodium nitrite
Dissolve 100 mg of sodium nitrite in 100 mL of distilled water.
Preparation of stock solution
Standard darifenacin hydrobromide, 10mg was weighed and transferred to 10mL volumetric flask and
dissolved in 0.1N HCl. The flask was shaken and was made upto the mark with 10mL 0.1N HCl to give
a solution containing 1000µg/mL solution. From this stock solution 1mL was pipette out into another .HBr
O
N
N H2
10mL volumetric flask and the volume was made upto 10mL to give 100µg/mL. from this, 1mL was
pipette out into another 10mL volumeteric flask and volume made upto 10mL to give 10μg/mL.
The method was developed based on diazotization coupling reaction between Darifenacin hydro bromide
and β-naphthol.
The step by step reaction scheme is as follows
Darifenacin HBr
HBr
HCl + NaNO2 (0-50C)
OH
Beta naphthol N
O N
H2
N
O N+
O N
N
O N
O
N OH
Plasma sample preparation
The blood samples were collected from retro-orbital puncture into disodium EDTA vials (20mg disodium
EDTA in 1mL water, 1mL of blood requires 50µL of disodium EDTA). Plasma was separated from
blood samples by centrifugation at 1400 rpm for 7 minutes. After centrifugation, plasma layer gets
separated and it is collected and stored at -200C for further use.
Extraction procedure
A pool of blank rat plasma was obtained.
100μL of plasma sample in was spiked with appropriate volume of the stock solution and 400μL
of methanol was added.
The mixture was vortexed for 1 minute.
Centrifuged at 3000 rpm for 12minutes at 40C.
The organic layer was separated & filtered through a 0.2μm cellulose acetate filter.
The organic layer was evaporated on a Savant vacuum evaporator at about 60°C. The residue was
reconstituted in 10mL of solvent and used for the measurement of the absorbance at the
absorption maxima of three drugs.
Determination of absorption maximum (λmax)
0.8mL was taken in a 10mL volumetric flask to which 1mL of sodium nitrite (0.1%w/v) was added. This
reaction was carried out by keeping the flask in an ice tray. Later, to this 1mL of β-naphthol (1%w/v)
was added and the volume was made up to 10mL with distilled water to give a solution of 80ng/mL
solution. The absorbance of resulting coloured solution was measured against respective blank solution
in visible region i.e., 300-800 nm which shows a maximum absorbance at 384nm and the spectrum is
Fig.3:Absorption spectrum of darifenacin Hydrobromide and βnaphthol.
Construction of calibration curve in spiked rat plasma
From the 1000 µg/mL solution of darifenacin hydrobromide, 100 µg/mL solution was prepared by
transferring 1 mL into a 100mL volumetric flask and volume was made upto the mark with 0.1N HCl.
From this, 10µg/mL solution was prepared by transferring 1mL into a 10mL volumetric flask. From this
1000ng/mL solution was prepared by transferring 1mL into a 10mL volumetric flask followed by the
addition of 1mL of 0.1% sodium nitrite and 1mL of 1% β-naphthol. From this, 0.4, 0.6, 0.8, 1.2, and
1.4mL were transferred to ependroff tubes to which 100 µL of plasma and 400 µL of methanol were
added which gives 40, 60, 80, 120, 140ng/mL and centrifuged at 3000 rpm for 12min. The supernatant
organic layer was collected and made up to the volume to 5 mL with suitable solvent i.e., distilled water
and the absorbance of these concentrations was measured spectrophotometrically at 384nm against blank
plasma extracted solution which was illustrated in fig. 4 and absorbance values against concentrations in
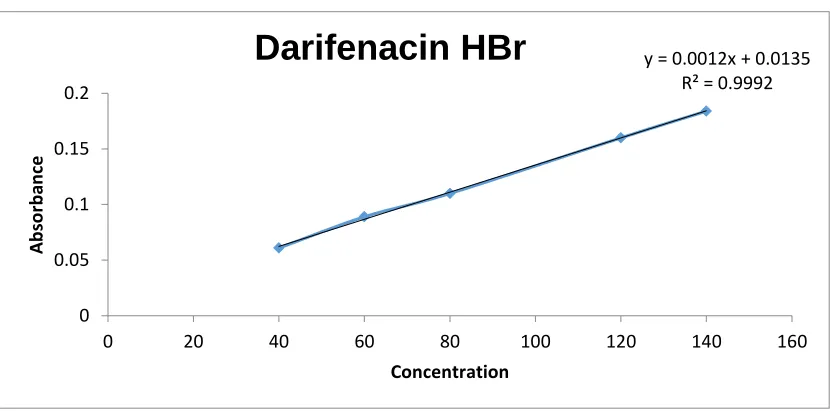
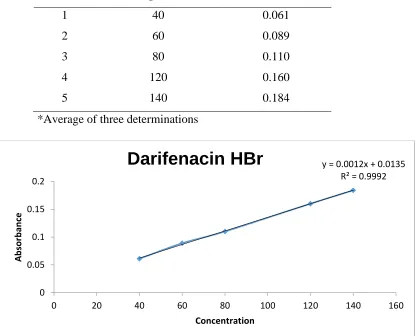
Table 1: Calibration curve data
S.No Concentration (ng/mL) Absorbance
*
1 40 0.061
2 60 0.089
3 80 0.110
4 120 0.160
5 140 0.184
* Average of three determinations
Fig.4: Calibration graph of darifenacin hydrobromide solution with plasma
Bioanalytical Method Validation7-11
All analytical procedures were validated according to USFDA guidelines ‘Bioanalytical Method Validation’.
Following parameters were performed for method validation:
Sensitivity (Lloq): It is the lower limit of quantification (LLOQ). The lowest concentration of the calibration curve where the analyte response was more than five times the blank response was selected
as LLOQ.
y = 0.0012x + 0.0135 R² = 0.9992
0 0.05 0.1 0.15 0.2
0 20 40 60 80 100 120 140 160
A
b
sor
b
an
ce
Concentration
Linearity
The linearity of the method was estimated by preparing calibration samples which were prepared by
spiking appropriate amount of sample and organic solvent (methanol) into control plasma to get 40, 60,
80, 120, 140ng/mL. The results are reported in table 6.1 and fig.6.2.
Limit of detection (LOD) and Limit of quantification (LOQ)
The sensitivity of the proposed method for measurement of darifenacin hydrobromide was estimated in
terms of LOD & LOQ. The Limit of detection (LOD) and limit of quantification (LOQ) was determined
according to the ICH guidelines for the validation of analytical procedure. The formulae used were:
LOD = 3.3σ/S
LOQ = 10σ/S
Where, σ = standard deviation of the response (intercept)
S = slope of the calibration curve
Recovery
Recovery was determined at three levels LQC (96ng/mL), MQC (120ng/mL), HQC (144ng/mL) .the
obtained results were reported in table 8.1.
Accuracy
Accuracy of the method was determined at three different concentration levels (96, 120, and 144ng/mL)
Mean and %RSD values were calculated and are shown in the table 8. The results indicate that the method was accurate.
Precision
Precision of the data was reported in terms of Repeatability, Intra-day precision, and Inter-day precision.
STABILITY STUDIES
Freeze and Thaw Stability
Drug stability was determined after three freeze-thaw cycles. Three aliquots of each higher and lower
concentration were frozen for 24 hours and then thawed unassisted at room temperature, when thawed
completely the samples were refrozen under same conditions as before. Freeze and thaw cycles were
repeated twice or more and analysed on third cycle. The obtained results were reported in table 10.1.
Short-Term Stability
Three aliquots of each low and high concentration were thawed at room temperature for 24 hours and
then analyzed. The obtained results were reported in table 10.2.
Stock Solution Stability
The stability of stock solutions of both drug and internal standard were evaluated at room temperature
for 6 hours. The obtained results were reported in table 10.3.
RESULTS AND DISCUSSION:
Validaion of Developed Method for Darifenacin Hydrobromide in Spiked Rat Plasma
The optimized method was validated according to USFDA guidelines ‘Bioanalytical Method Validation’.
Selectivity and Sensitivity (LLOQ)
There was no interference in absorbance obtained in blank plasma. The spectrum of blank plasma and
darifenacin hydrobromide solution with β-naphthol spiked in plasma were represented in figures 5.1
Fig.5.1 Absorption Spectrum of blank plasma
Fig.5.2 Overlay spectrum of darifenacin hydrobromide solution spiked in rat plasma (40-140ng/mL)
Sensitivity(LLOQ)
Linearity
The linearity of the method was found to be in the concentration range of 40-140ng/mL. The linearity
graph was plotted between concentration vs. absorbance.
The linear regression equation for darifenacin hydrobromide was y=0.001x-0.0135 with r2 0.999.
The calibration curve data is shown in table 6.1 and the calibration curve is shown in fig. 6.2
Table 6.1 Calibration curve dataDarifenacin Hydrobromide
S.No. Concentration (ng/mL)
Absorbance
1 40 0.061
2 60 0.089
3 80 0.110
4 120 0.160
5 140 0.184
*Average of three determinations
Fig.6.2 Calibration graph of darifenacin hydrobromide solution with plasma y = 0.0012x + 0.0135
R² = 0.9992
0 0.05 0.1 0.15 0.2
0 20 40 60 80 100 120 140 160
A
b
sor
b
an
ce
Concentration
Limit of Detection and Limit of Quantification
The sensitivity of proposed method for measurement of darifencin hydrobromide was estimated in
terms of LOD and LOQ. The calculated values of LOD and LOQ were found to be 5.6 and 17ng/mL
respectively.
Accuracy
Accuracy of the method was determined at three different concentrations levels. Mean and %RSD were
calculated and shown in Table 8.
Table.8 Accuracy data of darifenacin hydrobromide in plasma
*Average of three determinations
Recovery
Table 8.1 Recovery data of darifenacin hydrobromide tablets
Formulation Sample (ng/mL) Pure (ng/mL) Amt of plasma added Amt of methanol added Total amount of added (ng/mL) Total amt recovered Recovered pure Darilong 7.5mg
120 96 100 400 216 213 99
120 120 100 400 240 237.84 99.1
S.No Accuracy level
Concentration (ng/mL)
Absorbance Mean*+SD %RSD
1 80% 96 0.140
0.142 0.143
0.141+0.001 0.7
2 100% 120 0.159
0.156 0.158
0.157+0.001 0.6
3 120% 144 0.162
0.161 0.159
Precision
Precision of the data was reported in terms of Repeatability, Intra-day and Inter-day precision
Table.9 Repeatability data
S.No. Concentration (ng/mL)
Absorbance %RSD
1 120 0.161
1.88
2 120 0.160
3 120 0.158
4 120 0.160
5 120 0.158
6 120 0.150
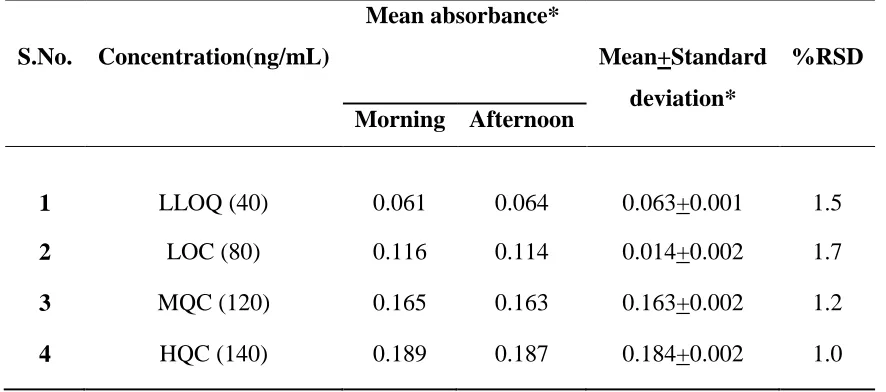
Table 9.1 Intra-day precision
S.No. Concentration(ng/mL)
Mean absorbance*
Mean+Standard deviation*
%RSD
Morning Afternoon
1 LLOQ (40) 0.061 0.064 0.063+0.001 1.5
2 LOC (80) 0.116 0.114 0.014+0.002 1.7
3 MQC (120) 0.165 0.163 0.163+0.002 1.2
4 HQC (140) 0.189 0.187 0.184+0.002 1.0
Table 9.2 Inter-day precision data
S.No. Concentration (ng/mL)
Mean absorbance* Mean +Standard deviation*
%RSD Day 1 Day 2
1 LLOQ (40) 0.061 0.063 0.062+0.001 1.6
2 LOQ (80) 0.114 0.011 0.115+0.002 1.7
3 MQC (120) 0.164 0.166 0.165+0.001 0.6
4 HQC (140) 0.184 0.184 0.184+0.002 1.0
*Average of three determinations
Stability Studies
Freeze and thaw Stability
Table 10.1 Stability datadarifenacin HBr
S.No. Concentration (ng/mL)
Time (hr) Mean absorbance
Mean Assayb+Standard
deviation
%RSD
1 LLOQ (40) 0 0.062 0.062+0.001 1.6
24 0.061
2 HQC (140) 0 0.183 0.184+0.001 0.5
24 0.185
Short term temperature stability
Fig.10.2 Spectrum of darifenacin HBr after short-term temperature stability (140ng/mL) Table 10.2 Stability datadarifenacin HBr
S.No. Concentration (ng/mL)
Time (hr) Mean absorbance
Mean Assayb+Standarad
deviation
%RSD
1 LLOQ (40) 0 0.061 0.060+0.001 0.6
72 0.059
2 HQC (140) 0 0.186 0.184+0.002 1.0
Stock solution stability
Fig.10.3 Spectrum of darifenacin HBr after Stock solution stability (140ng/mL)
Table 10.3 Stability data
S.No. Concentration (ng/mL)
Time (hr) Mean absorbance
Mean Assayb+Standard
%RSD
1 LLOQ (40) 0 0.058 0.159+0.002 1.2
6 0.061
2 HQC (140) 0 0.183 0.185+0.002 1.0
6 0.187
CONCLUSION
A new sensitive visible spectrophotometric method has been developed for the estimation of darifenacin
hydrobromide using coupling reagent, β-naphthol in spiked rat plasma. The method was developed using diazo
coupling reaction with the chromogenic reagent, β -naphthol for the estimation of darifenacin hydobromide.
Darifenacin after reaction with sodium nitrite under acidic condition formed a highly reactive intermediate
which upon reaction with β -naphthol forms a yellow colored diazo complex. The color intensity range was
limits. As the method was sensitive, it was successfully applied to the analysis of darifenacin hydrobromide in
spiked rat plasma.
REFERENCES
1. Rang HP, Dale MM, Ritter JM., FlowerRJ, HendersonG. Rang and Dale’s Pharmacolology. 7th
edition. Spain: Elsevier; 2012.
2. Material Safety Data Sheet of darifenacin hydrobromide.p.1-9. Available from:
Datasheets.scbt.com/sc-204708.pdf.
3. Product block of darifenacin hydrobromide. Available from:
www.scbt.jp/datasheet-204708-darifenacin-hydrobromide.html.
4. The Merck Index. 14th edition. USA: Merck Research Laboratories; 2006. 477p.
5. Remington The science and Practice of Pharmacy. Volume-II. 21st edition. New Delhi: Wolters Kluwer
India Pvt ltd; 2006.
6. Burgess C and Knowles A, Practical Absorption Spectrometry Techniques in visible and UltraViolet
Spectrometry. Volume-3. London: Chapman and Hall;1984.
7. Berry RI and Nash AR. Pharmaceutical Process validation, Analytical method validation, International
3rd edition. New York: Marcel Dekker Inc; 2008.
8. Bioanalytical Method Validation, Guidance for Industry, United states Food and Drug Administration,
May 2001
9. ICH, Q2 (R1) Validation of Analytical Procedures: Text and Methodology. International Conference
on Harmonization of Technical Requirements for Registration of Pharmaceuticals for Human Use, ICH
harmonized Tripartite Guideline, Nov 2005.
10.International Conference on Harmonization, “Q2A: Text on Validation of Analytical Procedures”,
Federal Register 60(40), 11260-11262 (1995).
11.International Conference on Harmonization, “Q2B: Validation of Analytical procedures: Methodology,
1997; 62 (96), 27463-27467.
12.ChatwalGR and AnandSK. Instrumental Methods of Chemical Analysis. 5th edition. Mumbai:
Himalaya Publishing House pvt ltd.;2011.
13.BeckettAH and StenlakeJB. Practical Pharmaceutical Chemistry. 4th edition. Part-Two. New Delhi:
CBS Publishers & Distributors; 2004.
14.Micheal E, Schartz IS Krull. Analytical method development and validation Japan: Elsevier Sciences;
15.USP 24th revision/NF. In: Trusties Bo, editor 2000, 2000.
16.USP28, NF23. The United State Pharmacopoeial Convention. Asian Edition. 2005; 2389.
17.Berry RI and Nash AR. Pharmaceutical Process validation, Analytical method validation, International
3rd edition. New York: Marcel Dekker Inc; 2008.
18.SharmaPP. How to Practice GLP, 3rd edition, Delhi: Vandana Publications Pvt. ltd; 2012.
19.Sathish NK and Pradeep V. UV Spectrophotometric determination of darifenacin hydrobromide in bulk
and pharmaceutical dosage forms. Der Pharmacia Sinica. 2011; 2(2): 169-76.
20.Sai PP, Jagathi V, Devala Rao G and Sudhakar G. Visible Spectrometric method for the determination
of darifenacin. Research J Pharm Bio Chem Sci. 2010; 1(2): 254-56.
21.Sridharan D, Umarani L, Thenmozhi A, Pavan kumar, Aswani Dutt C, Venkata Ramanaiah Mand
Phanikishore Y. Development and Validation of UV spectrophotometric method of darifenacin
hydrobromide in bulk and tablet dosage form. Asian J pharm Ana. 2011; 1(3): 43-45.
22.Siva Rama Krishna GV, Janardhan M and Santhosh Raja M. A simple sensitive UV-spectrophotometric
method for the estimation of darifenacin hydrobromide in bulk and pharmaceutical dosage form. Int J
Pharm Inv. 2012; 2(5):1-5.
23.Radhakrishnanand P, Subba Rao DV and Himabindu V. A Validated liquid chromatographic method
for the determination of enantiomeric purity of darifenacin [(S)-enantiomer] in bulk drug and extended
release tablets. Chromatographia. 2008; 68(11):1059-62.
24.SS Panda, Ravi Kumar BVV, PatelPK and MohantaG. New stability indicating RP-UPLC method for
determination of darifenacinhydrobromide in extended release tablet dosage form. J Pharm Educ Res.