Abstract-This work describes modeling and simulation of reverse logistics networks for collection of EOL products for XYZ Limited Company of North India. The company involved in production of acid batteries for commercial use. Stress is being given on design of forward and reverse logistics network for battery recycling operation. Simulation modeling, presented in this work allows the user to analyze the future performance of the network and to understand the complex relationship between the parties involved. The findings from the simulation suggest that the model calculates cycle time, transfer time, transfer cost, and resource utilization in a predictable manner. In this project, the simulation model was developed by using Arena 11.0 simulation package.
Keywords-Supply chain networks; reverse logistics; Recycling; Simulation modeling
I. INTRODUCTION
The rapid advancement in information technology results in a shortened product life cycle. This situation, which accompanies consumers developing disposable habits, has caused a large amount of waste, rapid depletion of resources, and serious damage to the environment. To deal with these critical problems, many governments have announced environmental legislation associated with green product designs and encouraged enterprises to implement green supply chains and reverse logistics so as to improve customer satisfaction, extend product life, and decrease resource investment. Reverse logistics is a recoverable system that increases product life by means of recycling, repair, refurbishment, and remanufacturing [1]-[2]. In 1998, Stock defined reverse logistics as the processes associated with the flows of product returns, source reduction, recycling, material substitution, material reuse, waste disposal, material refurbishment, repair, and remanufacturing. Hence, the recoverable system deals with the physical flows of products, components and materials from end users to re-users. Efficient management of reverse logistics will benefit to enterprises and contribute to environmental protection. In this paper, a reverse logistics network for used inverter batteries collection in the north India is presented, including the corresponding simulation model. The aim of the paper is to provide a flexible model to address some of the aforementioned problems associated
Manuscript received on March 3, 2011; revised on April 01, 2011. Arvind Jayant and Pardeep Gupta are with the Sant Longowal Institute of Engg. & Technology, Longowal, Sangrur, Punjab – 148106 (INDIA) (e-mails: [email protected], [email protected]) S.K.Grag is with Delhi Technological University,Delhi-110042(INDIA).(e-mail: [email protected])
with reverse logistics networks. In order to achieve this, firstly, a reverse logistics network was designed to establish transfer stations, drop-off points and a disassembly plant. Secondly, a simulation model was developed by using the Arena 11.0 simulation package. Thirdly, the simulation model was tested for the waste inverter batteries collection process in XYZ Limited of north India. The certainty of the results was statistically defined using a confidence interval of 95%. The model was then justified using t-distribution in order to find out the number of simulation runs required so that the results are within the 95%. Finally, a sensitivity analysis was carried out to analyze the effect of incoming goods, the fixed and variable costs of transport.
II. PROBLEMEXPLANATION
The present work includes the development of reverse logistics networks model in Arena Rockwell software simulation environment. This study covers study of the complete supply chain of XYZ Ltd. and more stress has been given to analyze the future performance of the reverse logistics network and to understand the complex relationship between the parties involved in reverse logistics operation. The XYZ Ltd. is one of the giant in the market of recycling sector. The findings from the simulation suggest that the model calculates cycle time, transfer time, transfer cost, and resource utilization in a predictable manner. The chosen industry for the present work is struggling to take a competitive advantage in the market with the overwhelming costs and problem areas of the reverse supply chain. The present work studies the existing reverse supply chain to find the key problem areas and opportunities for performance improvement.
A series of interviews and discussion sessions has been conducted in the plant with company management during this project and following problem areas are identified for improvement in reverse logistics operation of the plant.
Supply of used batteries is irregular and company is unable to forecast collection of EOL products. The company is not having any well-structured
model of reverse logistics practice.
Performance evaluation criteria’s are not defined in the existing model of the company.
Under utilization of existing workstations of the reverse supply chain.
To solve aforesaid problems and performance improvement an integrated model of reverse supply chain has been developed for the company in simulation environment, which is capable enough to predict the future performance of the company.
Design and Simulation of Reverse Logistics
Network: A Case Study
1
III. DESIGNOFREVERSELOGISTICSNETWORK
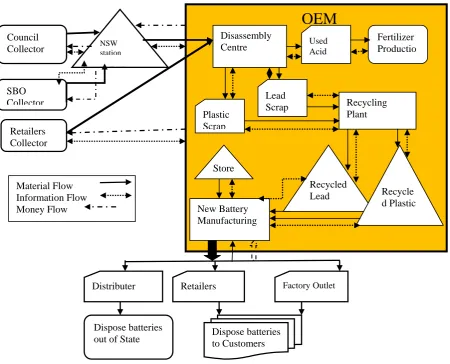
At the current stage, the company is not using a well define structured approach to get EOL product in the company. Therefore, we have designed and developed an integrated model of forward and reverse logistics supply chain networks. Prior to model Construction with the Arena simulation package, it is first fundamental to obtain an appropriate conceptual model, by which the reverse logistics infrastructure can be described. When designing a network structure of reverse logistics, there are many factors to be considered .The factors include inverter batteries, the number and the type of participants in the system, battery collection centre, battery recyclers, consumers, characteristics of the material flow and product characteristics. The retailers will deliver the inverter battery directly to the disassembly centre. At the centre, the parts that can be manufactured or recycled will be extracted and transferred either to the recycling facility or to remanufacturing plant. Design of reverse logistics network for XYZ limited is shown in figure 1(Given in APPENDIX).
IV. SIMULATION MODELING OF THE REVERSE LOGISTICS
NETWORK
The Arena Simulation package by Rockwell Inc, which allows such modular design has been used create the simulation model. Figure 2 (Given in appendix) shows the structure of simulation model. The starting point of simulation is in the” Creation and Assigning of Collector” sub model, where inverter batteries are created and then assign to the three collectors. The first process in the council sub-model is to determine the area of the council in which inverter batteries are discarded in accordance with the council’s population. Then collection of EOL batteries is assigned to the council, retailer and SBOs area in the area by using the probability distribution. Inverter batteries are then delivered either to the NSW “Transfer station” sub-model if the collector is a council or a SBO or to the “Disassembly Plant” sub-model if the collector is a retailer. The inverter batteries coming from NSW station are brought in by the disassembly Plant where they are disassembled and separate different components of batteries and finally transfer lead scrap and plastic scrap to the recycling plant.
V. SIMULATION MODEL TRANSLATION
The system represents the final operation of manufacturing of batteries after recycling. The arriving parts are inverter batteries that are collected by council, SBOs, retailer. The first units called, council collector with inter arrival times to our model being exponentially distributed with a mean 5 (all times are in minutes). Upon arrival, they are transferred to NSW- station with a route time 25 minutes. The second units called, SBO collector with inter arrival times to our model being exponentially distributed with a mean 5. Upon arrival, they are transferred to NSW- station with a route time 25 minutes. The third units called, retailer collector
distributed with a mean 5. Upon arrival, they are transferred to NSW- station with a route time 45 minutes. The inverter batteries collected at NSW-Station are transferred to Disassembly centre. At Disassembly centre, the batteries are dismantled and separate out into different parts by “N-way by chance” distribution where 70% lead scrap, 20% Plastic scrap and 10% spent acid is obtained. The spent acid is directly reclamation by acid reclamation process and the process time for the combined operation at acid reclamation follows a TRIA (5, 8, 10) distribution and used for chemical fertilizer production. 70% lead scrap is recycled by refining through pyrometallurgical process and the process time follows a TRIA (30, 35, 45) distribution and gets 99% pure lead. Similarly, the plastic scrap is recycled by plastic recycling process and the process time follows a TRIA (15, 20, 30) distribution and manufacture outer bodies of batteries.
The stores releases new plastic body, purified lead and new acid for manufacturing of new batteries by battery manufacturing process and the process time follows a TRIA (30, 35, 45) distribution. In the last, the decision how these batteries are distributed should be taken. It should be distributed through N-way by chance distribution i.e., 45% through distributor, 40% through retailer and remaining 15% through factory out let. Distributor dispose batteries to out of states while retailer and factory out let dispose batteries to customers. Simulation model collects statistics in each area on entity, transfer time and transfer cost (councilor, SBOs, retailer and disassembler), process and resource utilization. The random nature of simulation inputs renders the simulation run to produce a statistical estimate of the performance measure, not the measure themselves. So, that, estimates to be statistically precise (have a small variance) and free of bias, the following parameters were specified:
(i)
Length of each simulation run= 8640 minutes (one work week).(ii)
Number of independent simulation runs = 20VI. VERIFICATION AND VALIDATION
Verification concerns with the operational model (whether it is performing properly). It is done to ensure that:
The model is programmed correctly.
The model does not contain errors, oversights, or bugs.
In order to make sure that the model data accurately represent the actual process, hence enhance model validity, a confidence interval analysis was carried out. A 95% confidence interval was determined and the required number of simulation runs was decided by the following equation (Kelton et al. 1991)
………. (1)
Where n is the number of desired replication, d is the accuracy expressed, Z is the critical value from the standard normal table at given confidence interval & S is the standard deviation desired.
VII. RESULTS AND DISCUSSIONS
The results of simulations are summarized in table 1, 2 and 3.Model calculates the values in predictable manner of the main performance indicators in designed processes that are: transfer Time, transfer cost, recourse utilization for the process and number of entities processed in the process. Product transfer cost of all the players in the supply chain has reduced by operating the business in the developed model.
The Council’s product transfer cost reduced by 3.14%, SBO’s transfer cost reduced by 2.85%, retailer’s cost by 5.5% and Disassembly cost reduced by 1.44%. Product transfer time among the players also reduced after the simulation analysis. The Council’s by 2.7%, SBO’s by 2.7%, Retailer’s by 1.74% and Disassembly centre’s by 1.15%.Resources (Work Station) utilization increases by the simulation analysis of the designed networks model. Acid reclamation by 6%, Battery manufacturing by 8%, Plastic body manufacturing by 11%, Disassembly centre by 43%, Lead scrap by 14%, Plastic recycling by 43%, pure lead production by 23%, Pyro-mettallurgical Process by 17%, Scrap plastic by 31% and Spent acid utilization by 10%. The results clearly illustrate the dramatic improvement in the some performance indicators of reverse logistics operation by using developed reverse logistics network model.
TABLE I
COMPARISON OF TRANSFER COST
Transporters Transfer Cost (Rs.)
Council SBO Retailer Disassembly
centre
Manual (Average)
7.00 7.00 5.40 5.46
Simulation (Average)
6.78 6.80 5.10 5.39
Difference 3.14% 2.85% 5.5% 1.44%
TABLE II
COMPARISON OF TRANSFER TIME
Transporters Transfer time (minutes)
Council SBO Retailer Disassembly
centre
Manual (Average)
72 72 46 3.6
Simulation (Average)
70 70 45 35
Difference 2.7% 2.7% 1.74% 1.15%
TABLE III
COMPARISON OF RESOURCE UTILIZATION
Resource Utilization (Number Busy)
Manual (Average)
Simulation (Average)
Improvement (%) Approx.
Acid reclamation 0.40 0.43 06
Battery
Manufacturing 0.75 0.81 08
Plastic Body
Manufacturing 0.78 0.86 11
Disassembly 0.55 0.78 43
Lead Scrap 0.70 0.79 14
Plastic recycling 0.25 0.36 43
Pure lead 0.20 0.25 23
Pyro-mettallurgical
Process 0.85 0.99 17
Scrap plastic 0.42 0.55 31
VIII. CONCLUSION
In the present work, we have illustrated our discussion with examples of reverse logistics practice followed in Small Medium Enterprises, which is an Acid battery manufacturing industry of North India with a focus on design of forward and reverse logistics network for collection of EOL products. This project concerned with a general framework in view of forward and reverse supply chain and developed a model on Arena software which simulates to improve the performance of reverse logistics network and product supply planning function. The principle of reverse logistics has provided the basis for this project, which investigates the take-back system for discarded spent batteries collected from the customers through different external suppliers such as councilors, SBOs, retailer and disassembler and EOL products transported to the recycling plant. Designing of a collection network for the take-back of spent batteries for recycling requires the integration of the network into an existing collection infrastructure.
Simulation modeling, presented in this work, allows the user to analyze the future performance of the network and to understand the complex relationship between the parties involved. The present simulation model has been tested by using EOL inverter batteries collection process of a battery manufacturing unit of North India. The model with minor modifications may be useful for simulating the collection process of other EOL products. The designed model calculates cycle time, transfer time; transfer cost, and resource utilization in a predictable manner. The paper shows the usefulness of using a simulation package such as ARENA that helps in saving time and money as well as offering flexibility for the modeling process.
ACKNOWLEDGMENT
The authors would like to acknowledge the support of Simulation laboratory of Mechanical Engineering Department of Sant Longowal Institute of Engineering and Technology, Longowal, Punjab (Established by Government of India Deemed to be University) and Luminous Power Technology Limited of North India where the research works were performed. This work has been done as a part of doctoral thesis with title “Some studies on reverse logistics network design & remanufacturing strategies”.
REFERENCES
[1] Alshamrani, A., Mathur, K. and Ballou, R.H. “Reverse logistics: simultaneous design of delivery routes and return strategies”,
Computers and Operations Research, Vol.34, 2007, pp.595-619. [2] Amini, M.M., Retzlaff-Roberts, D. and Beinstock, C.C. “Designing a
reverse logistics operation for short cycle time repair services”,
International Journal of Production Economics, Vol.96, No. 3, 2005, pp.367-380.
[3] Barros, A.I., Dekker, R and Scholten, V. “A two- level network for recycling sand: a case study”, European Journal of Operational Research, Vol.119, 1998, pp.192-214.
[4] Bernd E. Hirsch, Thorsten Kuhlmann, Jens Schumacher, ”Logistics simulation of recycling networks”, Computers in Industry, Vol.36, pp.31-38
[5] Dowlastshahi, S. “A strategic framework for the design and
implementation of remanufacturing operations in reverse logistics”,
International Journal of Production Research, Vol.43, No.16, 2005, pp.3455-3480.
[6] Gungor, A. and Gupta, S.M.”Issues in environmentally conscious manufacturing and product recovery: a survey”, Computers and Industrial Engineering, Vol.36, No.4, 1999, pp.811-853.
[7] K.K., Iksoo Song, Juyong Kim, Bongju Jeong,” Supply planning model for remanufacturing system in reverse logistics environment”,
Computers and Industrial Engineering, Vol. 51, 2006,pp.279-287.
APPENDIX
Figure 1 Reverse Logistic Network model of forward & reverse supply chain
Figure 2 Arena simulation model for reverse logistics operation
OEM
CouncilCollector
SBO Collector
Retailers Collector
NSW station
Disassembly
Centre Used Acid
Lead Scrap Plastic
Scrap
Fertilizer Productio
Recycling Plant
Recycled
Lead Recycle
d Plastic Store
Distributer Retailers Factory Outlet
Dispose batteries to Customers Dispose batteries
out of State
New Battery Manufacturing Material Flow
[image:5.595.83.516.543.700.2]