CrossMark
Published by DiscoverSys
ABSTRACT
Purpose : To compare the Ganglion Cell Complex (GCC) thickness with Retinal Nerve Fiber Layer (RNFL) thickness in correlation with visual field (VF) in varying degrees of myopia.
Design: a Cross-Sectional study.
Participants: Ninety-six eyes of 49 patients with myopia.
Methods: Patients with myopia examined with streak retinoscope to obtained the best corrected visual acuity based on spherical equivalent. Patients then divided into low (50 eyes=50.1%), moderate (31 eyes=32.3%), and high (15=15.6%) myopia. Axial length measured with A-Scan ultrasound divided into short (4=4.2%), moderate (74=77.1%), and long (18=18.7%). SD-OCT was used to measured GCC thickness in 9 areas including fovea (R1), parafovea (R2-R5), and perifovea (R6-R9) according to early treatment diabetic retinopathy study (ETDRS), and RNFL thickness in five areas (G, TS, TI, NS, N, NI). VF analysis with Humphrey field analyzer with SITA 24-2 pattern.
Main outcome measures: GCC thickness has higher correlation with degree of myopia particularly in perifovea area and means deviation than RNFL thickness.
Results: GCC thickness decreased significantly along with the elevation of myopia degree in almost entire area except R1 and R5 . Parafovea (R2-R4) and perifovea (R6-R9) were significantly correlated with p= 0.001, 0.005, 0.006 and p= 0.000, 0.000, 0.000, and 0.003 respectively. In contrast, RNFL thickness obtained lower correlation with myopia degree whereas the only significant result was found in Nasal area (p= 0.045). VF found to be strongly correlated with the degree of myopia in which p-value for Mean Deviation = 0.000.
Conclusions: GCC thickness may compare the predictive value of RNFL in predicting early retinal microstructural changes even in low degree myopia.
Financial Disclosure: Author has no financial disclosure.
Keywords: Retina, Myopia, Ganglion Cell
Cite This Article: Pratiwi, A., Ichsan, A.M., Muhiddin.H.S. 2018. Ganglion Cell Complex thickness as an early predictor of microstructural changes in varying degrees of myopia in comparison with Retinal Nerve Fiber Layer (RNFL) thickness. Bali Medical Journal 7(2): 1-5. DOI:10.15562/bmj. v7i2.861
Ganglion Cell Complex thickness as an early
predictor of microstructural changes in varying
degrees of myopia in comparison with Retinal Nerve
Fiber Layer (RNFL) thickness
Andi Pratiwi,* Andi Muhammad Ichsan,* Habibah Setyawati Muhiddin
INTRODUCTION
Myopia is the refractive anomaly of the eye in which the conjugate focus of the retina is at some finite point in front of the eye when the eye is not accom-modating. It can also be described as the refrac-tive condition in which parallel light rays from an object at optical infinity are focused by the eye in front of the retina, with accommodation relaxed. Myopia is derived from the term “muopia” which, in Greek, means to close the eyes. It manifests itself as blurred distance vision, hence, the popular term “nearsightedness.”1
With very large increases in refractive diopter (D), the retina can degenerate and become thinner, and the retinal microstructures change, especially at the posterior pole. Myopia is a risk factor for a number of retinal pathologies such as retinal detachment, macular holes, choroidal neovascu-larization, and retinoschisis. Thus, complications related to myopia are one of the leading causes of blindness. As a result, early detection of the changes
in intraretinal structures is of utmost importance for the myopic eye. Understanding the abnormal patterns of retinal structures will help in assessing early-stage, myopia- related complications.2
Several studies have used OCT to investigate relationships between variations in macular thick-ness and myopia. The thickthick-nesses of the retinal nerve fiber layer (NFL), ganglion cell layer (GCL), and inner plexiform layer (IPL) were reported by some authors to be thinner in myopic eyes compared to normal eyes. Furthermore, the thick-ness of the outer retinal layers, including the retinal pigment epithelium (RPE) and the photoreceptor layer, vary according to the axial length (AL).2
Additionally, it is important to determine if there is any correlation between the thickness of specific retinal layers and the AL and/or the refractive error in myopic patients and to determine if such correla-tions are predictive of developing myopia-related complications.2
Department of Ophthalmology, Faculty of Medicine, Hasanuddin University
*Correspondence to: Andi Pratiwi and
Andi Muhammad Ichsan have an equal contribution to this research, Department of Ophthalmology, Faculty of Medicine, Hasanuddin University
Received: 2017-09-20 Accepted: 2018-1-17 Published: 2018-5-1
Volume No.: 7
Issue: 2
First page No.: 1
P-ISSN.2089-1180
E-ISSN.2302-2914
RESEARCH DESIGN AND METHOD
The present study was an analytic observational study with cross-sectional design conducted in Hasanuddin University Hospital, Makassar, Indonesia. Period of study: April-June 2016Inclusion Criteria 1. Age 20-50-year-old
2. Patients with refractive error ≥ 0.50 D (SE) 3. Intra Ocular Pressure ≤ 21mmHg
4. Patient with normal optic disc without glauco-matous changes.
5. Agreed to be part of the study and signed the inform consent application.
Exclusion Criteria
1. The macular diseases such as age related macu-lar degeneration, macumacu-lar edema, epiretinal membrane.
2. History of diabetes or neurological diseases such as stroke, intracranial tumor, multiple sclerosis, intracranial infection.
3. History of ocular trauma
4. Corneal disease such as keratopathy. 5. History of intraocular surgery. 6. Uncooperative patient.
Data collection
All patients who met the inclusion criteria will be informed about the study procedure and if they were agreed then signed the consent application. 49 patients (96 eyes) were included in our study. The enrolled subjects were divided into the following 3 subgroups according to their spherical equivalents (SEs): low myopia (< -3.00 D, n= 47), moderate myopia (from -3.00 D to -6.00D, n= 34), and high myopia (> -6.00 D, n=15 ) and their AL : Short ( <22.5 mm, n=4 ), Moderate (22.51–25.5 mm, n=74 ), Long (>25.51 mm, n= 18).
Each subject underwent a complete ocular examination, which included measurements of best-corrected visual acuity with Snellen chart and streak retinoscope (Welch-Allyn WA-11710 3.5V), afferent pupillary reflex, anterior segment examination (Topcon SL-D7 Digital Ready Slit Lamp), intraocular pressure (IOP) by Goldmann applanation tonometry, funduscopy with 90D lens (Volk Optical, Mentor, Ohio, USA), AL measure-ment using an ultrasound biometer (Tomey, Ultrasonic A/B Scanner and Biometer, UD-6000), macular ganglion complex thickness and peri-papillary retinal nerve fibre layer thickness using Spectral Domain Optical Coherence Tomography (Spectralis HRA+OCT, Heidelberg Engineering,
Germany), and visual field testing with Humprey Field Analyzer SITA 24-2 (Humphrey Field Analyzer II; Carl Zeiss Meditec, Dublin, California, USA)
SD-OCT Imaging
Imaging was performed using Heidelberg SD-OCT (Heidelberg Engineering, Germany)
The Ganglion Cell Complex thickness was measured with Heidelberg Spectral Domain OCT according to Early Treatment Diabetic Retinopathy Study (ETDRS) grid (6x6 mm) to obtain the values for each sector. The grid was divided into nine inde-pendent sectors; the inner and outer rings, with semidiameters of 1500 µm and 3000 µm, respec-tively, were segmented into four quadrants (supe-rior, infe(supe-rior, nasal, and temporal). The central sector was defined as being within 1000 µm of the center of the fovea.3
Segmentation of GCC thickness were divided into; R1: Sentral, R2: inner superior, R3: Inner nasal, R4: Inner inferior, R5: Inner temporal, R6: Outer superior, R7: Outer nasal, R8: Outer inferior, R9:
Outer temporal.3
SD-OCT RNFL thickness measurements were performed using circular scans (software version 5.1.2; Heidelberg engineering) along with a peri-papillary circle of 360 degrees. Periperi-papillary nerve fiber layer thickness segmentation divided into; G: Cup, TS: Temporal Superior, NS: Nasal Superior, N: Nasal NI: Nasal Inferior, TI: Temporal Inferior, T: Temporal.
Visual Field Examination
Standardized visual field testing was performed with static automated perimetry (Swedish Interactive Threshold Algorithm standard 24-2, Humphrey Field Analyzer II; Carl Zeiss Meditec, Dublin, California, USA). A visual field was defined as reliable when fixation losses were less than 20%, and false-positive and false-negative rates were less than 33%. A glaucomatous visual field defect was defined as the presence of three or more signifi-cant (p<0.05) non-edge contiguous points with at least one at the p<0.01 level on the same side of the horizontal meridian in the pattern deviation plot, and classified as ‘outside normal limits’ on the Glaucoma Hemifield Test, confirmed on two consecutive visual field examinations.4
Statistical Analyses
Statistical Software
RNFL thickness of all sectors, GCC thickness in 9 regions, axial length, and visual field testing were examined with Statistical Package for Social Science (SPSS statistics, ver.22; IBM Corporation, New York, NY), and Microsoft word and excel have been used to generate graphs, and tables.
RESULT
Ninety-six eyes from 49 patients are included in our study. There are 32 men and 64 women. The patients are divided into 3 groups according to their SE and AL.
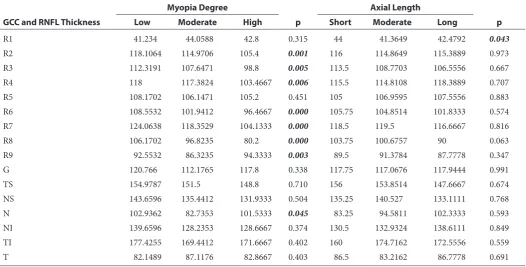
Table 1 consists of comparison for mean GCC (R1-R9) and RNFL thickness according to myopia degree and AL. The table shows a signifi-cant negative correlation (p <0.05) in which GCC thickness in low, moderate, and high myopia markedly different in parafovea (paracentral) and perifovea ( peripheral) except in R1 (p= 0.315) and R5 (p=0.451). In line with table 1, figure 1 reveal R6, R7, and R8 turns out to be the most significant area (p=0.000). In contrast, AL express insignificant
correlation with GCC thickness in most areas except in R1 (p=0.043).
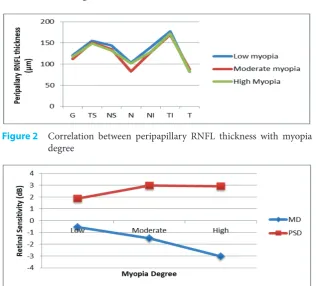
Comparison of peripapillary RNFL based on myopia degree and axial length is also shown in table 1. One way ANOVA comparative test indi-cate an insignificant correlation between RNFL with myopia degree and axial length. This table points that the thickest area of low, moderate, and high myopia are TS, TI, and TI, respectively. This result signifies that the temporal area is not inter-fered by myopia because there are no thickness changes regardless of the myopia degree. Similarly, AL showed the insignificant correlation among all degrees in all areas. Nevertheless, peripapillary RNFL indicates that there is a tendency to thinned in accordance with myopia degree elevation although the nasal area is the only area which shows a significant correlation (Figure 2).
Comparison of visual field test result based on myopia degree and AL are shown in table 2. Based on myopia degree, visual field test which is repre-sented with Mean Deviation (MD) and Pattern Standard Deviation (PSD) revealed a significant result p=0.000 and 0.029 respectively. Mean MD
Table 1 Comparison for mean GCC (R1-R9) and RNFL thickness according to myopia degree and axial length
GCC and RNFL Thickness
Myopia Degree
p
Axial Length
p
Low Moderate High Short Moderate Long
R1 41.234 44.0588 42.8 0.315 44 41.3649 42.4792 0.043
R2 118.1064 114.9706 105.4 0.001 116 114.8649 115.3889 0.973
R3 112.3191 107.6471 98.8 0.005 113.5 108.7703 106.5556 0.667
R4 118 117.3824 103.4667 0.006 115.5 114.8108 118.3889 0.707
R5 108.1702 106.1471 105.2 0.451 105 106.9595 107.5556 0.883
R6 108.5532 101.9412 96.4667 0.000 105.75 104.8514 101.8333 0.574
R7 124.0638 118.3529 104.1333 0.000 118.5 119.5 116.6667 0.816
R8 106.1702 96.8235 80.2 0.000 103.75 100.6757 90 0.063
R9 92.5532 86.3235 94.3333 0.003 89.5 91.3784 87.7778 0.347
G 120.766 112.1765 117.8 0.338 117.75 117.0676 117.9444 0.991
TS 154.9787 151.5 148.8 0.710 156 153.8514 147.6667 0.674
NS 143.6596 135.4412 131.9333 0.504 135.25 140.527 133.1111 0.768
N 102.9362 82.7353 101.5333 0.045 83.25 94.5811 102.3333 0.593
NI 139.6596 128.2353 128.6667 0.374 130.5 132.9324 138.6111 0.849
TI 177.4255 169.4412 171.6667 0.402 160 174.7162 172.5556 0.559
T 82.1489 87.1176 82.8667 0.403 86.5 83.2162 86.7778 0.691
Table 2 Comparison of visual field test result based on myopia degree and axial length
Visual Field
Myopia Degree
p
Axial length
p
Low Moderate High Short Moderate Long
MD -0.5621 -1.5026 -3.026 0.000 0.1300 -1.2286 -1.806 0.385
in low, moderate, and high myopia are -0.5621, -1.5026, and -3026, respectively. Mean PSD are 1.8709, 2.9918, and 2.9007 in low, moderate, and high myopia, respectively. However, based on AL, there is no significant correlation with MD (p= 0.385) and PSD (p=0.186). Correlation between myopia degree and visual field showed a negative correlation in which the higher the myopia degree, the lower the MD and PSD value. (Figure 3)
DISCUSSION
Correlation between retinal GCC thickness based on myopia degree showed a significant result between both variables. Almost all macula areas, except R1 and R5, experience a marked decreased in thickness along with the increase of myopia degree.
This result is in line with some other studies related to retinal GCC, where they stated in their research that foveal thickness (R1) was not decreased in myopia, nonetheless, parafovea (R2-R5) and perifo-vea (R6-R9), were positively correlated with myopia degree, the further away from the fovea, the thinner the macula as myopia progress.2,5,6
Pearson correlation test for GCC thickness with AL indicate a significant result in some areas that is R1 (p=0.017), R6 (p=0.001), R7 (p=0.023), R8 (p=0.000). This result denotes that there is a negative correlation between those two variables, although not evenly in all areas. However, one-way ANOVA test revealed almost no significant correla-tion between GCC thickness with AL except R1 (Fovea, p= 0.043). This matter represents that fovea is the area most affected by the increase of axial length.
As already known, R1 is a central area that only consists of outer retinal layer segments and has no inner layers. Previous studies using OCT to figure out the relationship between macular thickness vari-ety with myopia. Some of those reported that nerve fiber layer, ganglion cell layer, and inner plexiform layer are thinned due to myopia in comparison with normal people, whilst axial length has more influ-ence to outer retinal layers including photoreceptor and retinal pigment epithelium (RPE).2 A study by
Lam et al. found that macular thinning only occur in the outer ring (3-6mm). The reason is peripheral retina seem to be less resistant to stretching due to lack of large vessels. But different mechanism ruled in the posterior pole whereas perifovea area which is closer to the vascular arcade thinned faster than parafovea which lies farther away.9 Other
mecha-nism stated by Zhao et al., that foveal area has the highest RPE permeability so that the thickness will not decrease dramatically.5 Numerous studies also
state different result with this study. One thing that can lead to this is most of those studies using total retinal thickness as the parameter instead of specifically put GCC as the particular layer to be measured.
Correlation between peripapillary RNFL and myopia degree showed that temporal superior (TS) and temporal inferior (TI) is the thickest among all, whilst temporal (T) is the thinnest. The same result published in 2010 by Kim et al. In their study they found that peripapillary RNFL decreased signifi-cantly but not evenly in all areas, with temporal superior, and temporal inferior became the thickest area. They stated that these results raise the possi-bility that peripapillary RNFL redistributed along with the axial stretching in myopia. When the axial length is stretched, the retina will be dragged to the temporal horizon. In the process, the RNFL will be Figure 3 Correlation between MD and PSD with myopia degree
Figure 1 Correlation between retinal GCC thickness with myopia degree according to ETDRS area
compressed against the bundles originating from the opposite hemisphere at the horizontal raphe. This would result in thickening of the RNFL in the temporal quadrant. In contrast, the nasal area would become thinner as it is stretched.6
After using ANOVA test, according to the degree of myopia only nasal area that shows a significant difference between low degree myopia, moderate degree myopia, and high degree myopia (p= 0.045), meanwhile according to the axial length of eyeballs, there is no significance in all the area. The relation-ship between peripapillary retinal nerve thickness with the degree of myopia can be seen that temporal superior (TS) area and temporal inferior (TI) area is the thickest layer, and temporal (T) area become the thinnest layer.
Structure-function relationship between myopia degree and axial length with visual field revealed a significant correlation for Mean Deviation (MD), and Pattern Standard Deviation (PSD) whereas MD value decreased (p= 0.000, one-way ANOVA test) and PSD increased (p = 0.029, one-way ANOVA test) as the myopia degree elevated. These result denoted that the decreased of retinal sensitivity (MD and PSD value) is quite specific to be used as a parameter of microstructural changes in the retina. Statistical analyses for visual field and axial length relationship in this study found to be insig-nificant. However, it is clearly showed that MD value decreased and PSD increased along with axial length. These results indicate decreased retinal sensitivity that interfered by axial elongation. Varies explanation related to decreased of visual field sensitivity in myopia had been submitted. Retinal stretching due to axial elongation will broaden the interphotoreceptor distance, thus, triggered distor-tion of the photoreceptor, and lead to decreased of retinal sensitivity.10
CONCLUSION
In summary, we have demonstrated that there is a significant correlation between myopia degree with macular GCC thickness in almost all areas based on ETDRS criteria, except R1 and R5. In contrast, peri-papillary retinal nerve fiber layer showed results in which the only significant correlation was found in the nasal area. There was no significant correlation between axial length with GCC and peripapil-lary RNFL. Nevertheless, MD and PSD markedly different in low, moderate, and high myopia. These results indicate that GCC thickness may be used as a predictive value to compare the RNFL in order to predict microstructural changes even in low myopia. and PSD markedly different in low, moder-ate, and high myopia. These results indicate that
GCC thickness may be used as a predictive value to compare the RNFL in order to predict microstruc-tural changes even in low myopia.
A limitation of our study is the relatively small numbers in each group of myopia and axial length. In addition, we use SE to define myopia criteria, so the astigmatism part could have introduced poten-tial selection bias. Other than that, AL measure-ments using contact instead of optical biometer could possibly bias the AL results.
AUTHOR CONTRIBUTIONS
Andi Pratiwi and Andi Muhammad Ichsan have an equal contribution to this research. Habibah Setyawati Muhiddin as the first co-author contrib-uted in sampling and designing the research.
REFERENCES
1. American Optometrist Association. (2006). Optometric Clinical Practice Guideline Care of the Patient with Myopia. USA: St.Louis.
2. Liu et al. (2015). Macular Thickness Profiles of Intraretinal Layers in Myopia Evaluated by Ultrahigh-Resolution Optical Coherence Tomography. China: American Journal of Ophthalmology.
3. Wang J, et al. (2015). Swept-source Optical Coherence Tomography of Macular Retinal and Choroidal Structures in Healthy Eyes. Europe PubMed Central. Volume 15: 122. 4. Tham Y_C, et al. (2013). Relationship between ganglion
inner-cell plexiform layer and optic disc/retinal nerve fiber layer parameters in non-glaucomatous eyes. British Journal of Ophthalmology. Volume 97: 1592-1597. 5. Zhao et al. (2013). Effect of Myopia on Ganglion Cell
Complex and Peripapillary Retinal Nerve Fibre Layer Measurements: a Fourier-Domain Optical Coherence Tomography Study of Young Chinese Persons. Clinical and Experimental Ophthalmology. Volume 41:561-566. 6. Kim et al. (2010). Peripapillary Retinal Nerve Fibre Layer
Thickness Profiles in Subjects with Myopia Measured Using the Stratus Optical Coherence Tomography. British Journal of Ophthalmology. 94:115-120.
7. Wakitani et al. (2003). Macular thickness measurements in healthy subjects with different axial lengths using optical coherence tomography. Retina. Philadelphia, Pa. 23(2): 177-82
8. Lim et al. (2005). Use of optical coherence tomography to assess variations in macular retinal thickness in myopia. Invest Ophthalmol Vis Sci. 46(3):974-8
9. Lam et al. (2007). Regional Variations in the Relationship between Macular Thickness Measurements and Myopia. Investigative Ophthalmology and Visual Science, 48: 376-382
10. Kita et al. (2013). Relationship Between Macular Ganglion Cell Complex Thickness and Macular Outer Retinal Thickness: a Spectral-Domain Optical Coherence Tomography Study. Clinical and Experimental Ophthalmology. 41: 674-682.