ISSN 0975-928X
741
Research Article
Association analysis for seed yield and component traits in segregating
populations of blackgram (
Vigna mungo
(L.) Hepper)
P. Sathya1, N. Manivannan1, A. Mahalingam1, V.K. Satya2 and C. Parameswari3.
1National Pulses Research Centre, Tamil Nadu Agricultural University, Vamban-622 303, 2
Krishi Vigyan Kendra, Tamil Nadu Agricultural University, Tindivanam-604002
3
Agricultural College and Research Institute, Tamil Nadu Agricultural University, Madurai-625104 E-Mail:[email protected]
(Received: 25 May 2018; Revised: 23 Jun 2018; Accepted: 26 Jun 2018)
Abstract
The present research work on blackgram (Vigna mungo(L.) Hepper) was carried out at National Pulses Research Centre, Vamban during kharif 2017 to assess the association among yield attributes in F2 population of five crosses viz., VBN(Bg) 4 x Mash 114,
VBN(Bg) 4 x Mash 1008,VBN 8 x Mash 114, VBN 8 x Mash 1008 and VBN 8 x VBG11-053. Correlation analysis revealed that seed yield was positively correlated with plant height, number of branches per plant, number of clusters per plant, number of pods per cluster, total number of pods, pod length, number of seeds per pod and 100- seed weight in VBN(Bg) 4 X Mash 1008 and VBN 8 x Mash 1008 cross combinations. Same trend was observed in the crosses VBN(Bg) 4 x Mash 114, VBN 8 x Mash 114 except for plant height and in VBN 8 x VBG 11-053 except for pod length. The path coefficient analysis showed that, in all the five populations studied, number of clusters per plant, number of pods per plant, number of seeds per pod and 100 seed weight had positive direct effect on yield. Blackgram seed yield can be significantly improved with the selection of plants with more number of pods, number of clusters per plant and 100 seed weight in the segregating populations as these traits were positively associated with the seed yield.
Keywords
Blackgram , F2 population, correlation analysis, path analysis, seed yield
Introduction
Blackgram (Vigna mungo(L.) Hepper, 2n = 22) is an important legume crop occupying peculiar position in Indian agriculture. It is the affordable source of protein for the poor and has long been known as the poor men’s meat (Mian, 1976). The pulse crops, in general, give lower yield than the cereal crops as they are generally cultivated in marginally poor soils, mostly in rainfed conditions (Suguna et al., 2017). Yield is a complex character collectively influenced by various components. Association studies gives information about the contribution of different characters towards seed yield. The study on inter-relationship between the component traits and seed yield will formulate an effective and viable breeding programme for improvement of seed yield in a short time. The present study aimed to assess the correlation and path coefficients in order to formulate selection criteria for evolving high yielding genotypes.
Material and Methods
The present research work was carried out at the National Pulses Research Centre, Vamban during the
kharif 2017. Five different cross combinations in F2
generation viz., VBN (Bg) 4 x Mash 114, VBN (Bg) 4 x Mash 1008, VBN 8 x Mash 114, VBN 8 x Mash 1008 and VBN 8 x VBG11053 in F2 along with their parents formed the basic genetic material for the present study. In each F2 cross combinations a
minimum of 200 plants were maintained. Observations were recorded on plant height (cm), number of branches per plant, number of clusters per plant, number of pods per cluster, total number of pods, pod length (cm), number of seeds per pod, 100 seed weight (g) and seed yield per plant (g). Observations were recorded in all the single plants in each cross combinations. The TNAUSTAT software (Manivannan, 2014) was used to analyze the correlation and path coefficients.
Results and Discussion
ISSN 0975-928X
742 consideration of the interactions between the
component characters may sometimes be misleading (Codawat, 1980).
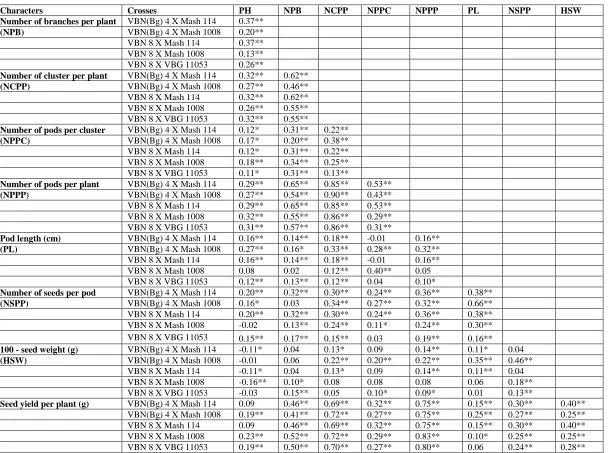
The simple correlation coefficient between seed yield and yield component characters in F2 generation of
five cross combinations are presented in Table 1. The results revealed that, the seed yield per plant had significant and positive correlation with plant height, number of branches per plant, number of clusters per plant, number of pods per cluster, total number of pods, pod length, number of seeds per pod and 100 seed weight in the crosses viz.,VBN (Bg) 4 x Mash 1008 and VBN 8 x Mash 1008. Plant height in crosses VBN (Bg) 4 x Mash 114 and VBN 8 x Mash 114 and pod length in the cross VBN 8 x VBG 11053 had non significant association with seed yield (Table 1). These results are in close agreement with findings of Parveen et al.(2011), Mehra et al.(2016) and Singh et al.(2016) for plant height. Chand and Rao (2002), Konda et al. (2008) and Sharma (2015) reported same finding for number of branches per plant. Bharti et al.(2013), Kumar et al. (2015) and Sushmitharaj et al.(2018) for number of clusters per plant; Chauhan et al.(2007), Shivade et al.(2011) and Bharti et al.(2013), for number of pods per cluster; Reni et al.(2013), Patidar and Sharma (2017)for total number of pods per plant; Miah et al. (2016) and Sohel et al.(2016) observations recorded for pod length; Singh et al.(2016) and Suguna et al.(2017), for number of seeds per pod Konda et al.(2008) and Netam et al.(2010) for 100-seed weight also reported similar findings.
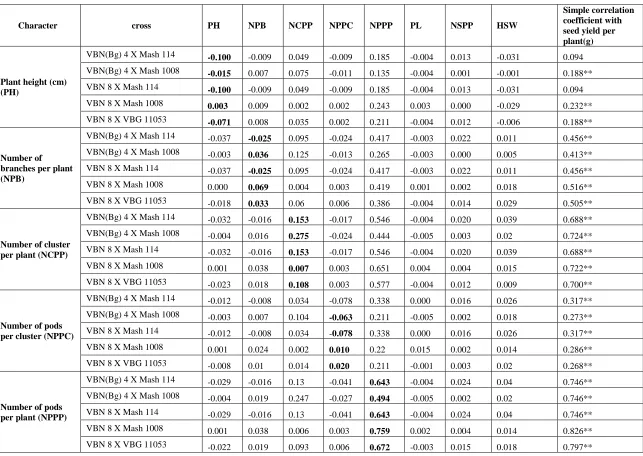
Correlation values provide only nature and degree of relationship of yield contributing characters on seed yield. Path coefficient analysis is a statistical technique to split the observed correlation coefficients into direct and indirect effects of independent variables on the dependent variable. If the correlation between seed yield and a character is due to the direct effects of character, it reflects true relationship between them. Hence, selection can be practiced for such a character in order to improve yield. However, if correlation is due to indirect effect of the character through another component trait, the breeder has to select for the latter trait through which indirect effect is exerted. The direct and indirect effect of yield components on seed yield per plant was presented in Table 2. In the present study, number of pods per plant had high and positive direct effect on seed yield in all the five populations. Hundred seed weight and number of clusters per plant had moderate or low and positive direct effect on seed yield in most of the crosses.
The results are in accordance with Chand and Rao (2002), Chauhan et al.(2007) and Reni et al.(2013) for number of pods per plant, number of seeds per pod, number of clusters per plant and 100 seed weight.
Among various traits, number of pods per plant alone showed high to moderate and positive indirect effect for most of traits. Bharti et al.(2013) reported positive and indirect effect on seed yield per plant via clusters per plant, number of pods per cluster and number of seeds per pod. Patidar and Sharma (2017) for plant height and number of pods per plant and Miah et al.(2016) reported high and positive indirect effects for 100 - seed weight, number of branches per plant on seed yield per plant.
Hence , based on the results of correlation and path analysis, it may be concluded that the traits, number of pods per plant, 100 seed weight and number of pods per cluster, can be considered as selection indices for seed yield improvement programme in blackgram.
References
Bharti, B., Kumar, R., Bind, H.N., Kumar, A. and Sharma, V. 2013. Correlation and path analysis for yield and yield components in black gram [Vigna mungo (L.) Hepper]. Internat. J. Plant Sci., 9:
410-413.
Chauhan, M.P., Mishra, A.C. and Singh, A.K. 2007. Correlation and path analysis in urdbean. Legume Res., 30: 205-208.
Codawat, S. L. 1980. Notes on path coefficient analysis in foxtail millet [Setaria italic (L) Beauv.]. Madras Agril. J. 67: 690-692.
Konda, C.R., Salimath, P.M. and Mishra, M.N. 2008. Correlation and path Coefficient analysis in black gram. Legume Res., 31:202-205.
Kumar, G.V., Vanaja, M., Sathish, P., Vagheera, P.and Lakhsmi, N.J. 2015. Correlation analysis for quantitative traits in blackgram [Vigna mungo
(L.) Hepper] in different seasons. Internat. J. Scientific and Res Publications., 5:1
Mian, A.L. 1976. Grow more pulses to keep your pulse wellan assayof Bangladesh pulses. Department of Agronomy. BAU, Mymensingh. pp. 11-15.
Manivannan, N. 2014. TNAUSTAT - Statistical package.
Retrived from
http://sites.google.com/site/tnaustat. On
ISSN 0975-928X
743 Mehra, R., Tikle, A.N., Saxena. A., Munjal. A., khandia. R
and Singh, M. 2016. Correlation, path-coefficient and genetic diversity in Blackgram (Vigna mungo
(L) Hepper), Internat. Res. J. Plant Sci., 7(1): 001-011.
Netam, C.R.R.N., Pandey, R.L. and Khan, R.U. 2010. Estimation of relationship of seed yield with its attributing traits in urdbean [Vigna mungo (L.) Hepper]. Advan in Plant Sci., 23: 97-100.
Parveen, S.I., Sekhar, M. R., Reddy, D.M. and Sudhakar, P. 2011. Correlation and path coefficient analysis for yield and yield components in blackgram [Vigna mungo (L.) Hepper]. Internat. J. Appli. Biol.and Pharmaceuticals Technol.,3: 619-625.
Patidar, M. and Sharma, H. 2017. Correlation and path coefficient studies in Blackgram (Vigna mungo
(L.) Hepper). J. Pharmacognosy and Phytochem.,
(6(4): 1626-1628
Poran, C. and Rabhunandha, R. 2002. Breakage of undesirable correlations in blackgram (Vigna mungo L. Hepper). Legume Res., 25, 37-40.
Reni, Y.P., Rao, Y.K., Satish, Y. and Babu,S. J. 2013. Estimates of genetic parameters and path analysis in blackgram [Vigna mungo (L.) Hepper].
Internat. J. Plant, Animal and Environ Sci., 4:
231-234.
Sharma.R. 2015. Association analysis for yield and its components in Urd bean (Vigna mungo l.) Genotypes. The bioscan,10(4): 2121-2124.
Shivade, H.A., Rewale, A.P. and Patil, S.B. 2011. Correlation and path analysis for yield and yield components in blackgram [Vigna mungo (L.) Hepper]. Legume Res.,34: 178-183
Singh. M., Swarup, M. I., Billore, and Chaudhari, P.R.2016. Association analysis of seed yield and its attributing traits in black gram [Vigna mungo
(L.) Hepper]. Agric. Sci. Digest., 36 (2): 83-87
Sohel, M. H., Miah, M. R., Mohiuddin, S. J., Islam, A. K. M. S., Rahman, M. M. and Haque, M. A. 2016. Correlation and path coefficient analysis of Blackgram (Vigna mungo L.). J. Biosci and Agric Res., 07(02), 621-629.
Suguna, R.,Savitha, P. and Kumar, C.R.A. 2017. Correlation and Path Analysis for Yellow Mosaic Virus Disease Resistance and Yield Improvement in Blackgram [Vigna mungo (L.) Hepper]. Int. J. Curr. Microbiol .App. Sci., 6(11): 2443-2455
ISSN 0975-928X
744 Table 1. Simple correlation coefficient between yield and yield attributes in F2 generation of various crosses in blackgram.
*,** Significant at 5 % and 1 % level of probability, respectively.
Characters Crosses PH NPB NCPP NPPC NPPP PL NSPP HSW
Number of branches per plant VBN(Bg) 4 X Mash 114 0.37**
(NPB) VBN(Bg) 4 X Mash 1008 0.20**
VBN 8 X Mash 114 0.37** VBN 8 X Mash 1008 0.13** VBN 8 X VBG 11053 0.26**
Number of cluster per plant VBN(Bg) 4 X Mash 114 0.32** 0.62**
(NCPP) VBN(Bg) 4 X Mash 1008 0.27** 0.46**
VBN 8 X Mash 114 0.32** 0.62** VBN 8 X Mash 1008 0.26** 0.55** VBN 8 X VBG 11053 0.32** 0.55**
Number of pods per cluster VBN(Bg) 4 X Mash 114 0.12* 0.31** 0.22**
(NPPC) VBN(Bg) 4 X Mash 1008 0.17* 0.20** 0.38**
VBN 8 X Mash 114 0.12* 0.31** 0.22** VBN 8 X Mash 1008 0.18** 0.34** 0.25** VBN 8 X VBG 11053 0.11* 0.31** 0.13**
Number of pods per plant VBN(Bg) 4 X Mash 114 0.29** 0.65** 0.85** 0.53**
(NPPP) VBN(Bg) 4 X Mash 1008 0.27** 0.54** 0.90** 0.43**
VBN 8 X Mash 114 0.29** 0.65** 0.85** 0.53** VBN 8 X Mash 1008 0.32** 0.55** 0.86** 0.29** VBN 8 X VBG 11053 0.31** 0.57** 0.86** 0.31**
Pod length (cm) VBN(Bg) 4 X Mash 114 0.16** 0.14** 0.18** -0.01 0.16**
(PL) VBN(Bg) 4 X Mash 1008 0.27** 0.16* 0.33** 0.28** 0.32**
VBN 8 X Mash 114 0.16** 0.14** 0.18** -0.01 0.16** VBN 8 X Mash 1008 0.08 0.02 0.12** 0.40** 0.05 VBN 8 X VBG 11053 0.12** 0.13** 0.12** 0.04 0.10*
Number of seeds per pod VBN(Bg) 4 X Mash 114 0.20** 0.32** 0.30** 0.24** 0.36** 0.38**
(NSPP) VBN(Bg) 4 X Mash 1008 0.16* 0.03 0.34** 0.27** 0.32** 0.66**
VBN 8 X Mash 114 0.20** 0.32** 0.30** 0.24** 0.36** 0.38** VBN 8 X Mash 1008 -0.02 0.13** 0.24** 0.11* 0.24** 0.30** VBN 8 X VBG 11053 0.15** 0.17** 0.15** 0.03 0.19** 0.16**
100 - seed weight (g) VBN(Bg) 4 X Mash 114 -0.11* 0.04 0.13* 0.09 0.14** 0.11* 0.04
(HSW) VBN(Bg) 4 X Mash 1008 -0.01 0.06 0.22** 0.20** 0.22** 0.35** 0.46**
VBN 8 X Mash 114 -0.11* 0.04 0.13* 0.09 0.14** 0.11** 0.04
VBN 8 X Mash 1008 -0.16** 0.10* 0.08 0.08 0.08 0.06 0.18**
VBN 8 X VBG 11053 -0.03 0.15** 0.05 0.10* 0.09* 0.01 0.13**
Seed yield per plant (g) VBN(Bg) 4 X Mash 114 0.09 0.46** 0.69** 0.32** 0.75** 0.15** 0.30** 0.40**
ISSN 0975-928X
745 Table 2. Direct and indirect effect of yield components on yield per plant in F2 generation for various crosses
Character cross PH NPB NCPP NPPC NPPP PL NSPP HSW
Simple correlation coefficient with seed yield per plant(g)
Plant height (cm) (PH)
VBN(Bg) 4 X Mash 114 -0.100 -0.009 0.049 -0.009 0.185 -0.004 0.013 -0.031 0.094
VBN(Bg) 4 X Mash 1008 -0.015 0.007 0.075 -0.011 0.135 -0.004 0.001 -0.001 0.188**
VBN 8 X Mash 114 -0.100 -0.009 0.049 -0.009 0.185 -0.004 0.013 -0.031 0.094
VBN 8 X Mash 1008 0.003 0.009 0.002 0.002 0.243 0.003 0.000 -0.029 0.232**
VBN 8 X VBG 11053 -0.071 0.008 0.035 0.002 0.211 -0.004 0.012 -0.006 0.188**
Number of branches per plant (NPB)
VBN(Bg) 4 X Mash 114 -0.037 -0.025 0.095 -0.024 0.417 -0.003 0.022 0.011 0.456**
VBN(Bg) 4 X Mash 1008 -0.003 0.036 0.125 -0.013 0.265 -0.003 0.000 0.005 0.413**
VBN 8 X Mash 114 -0.037 -0.025 0.095 -0.024 0.417 -0.003 0.022 0.011 0.456**
VBN 8 X Mash 1008 0.000 0.069 0.004 0.003 0.419 0.001 0.002 0.018 0.516**
VBN 8 X VBG 11053 -0.018 0.033 0.06 0.006 0.386 -0.004 0.014 0.029 0.505**
Number of cluster per plant (NCPP)
VBN(Bg) 4 X Mash 114 -0.032 -0.016 0.153 -0.017 0.546 -0.004 0.020 0.039 0.688**
VBN(Bg) 4 X Mash 1008 -0.004 0.016 0.275 -0.024 0.444 -0.005 0.003 0.02 0.724**
VBN 8 X Mash 114 -0.032 -0.016 0.153 -0.017 0.546 -0.004 0.020 0.039 0.688**
VBN 8 X Mash 1008 0.001 0.038 0.007 0.003 0.651 0.004 0.004 0.015 0.722**
VBN 8 X VBG 11053 -0.023 0.018 0.108 0.003 0.577 -0.004 0.012 0.009 0.700**
Number of pods per cluster (NPPC)
VBN(Bg) 4 X Mash 114 -0.012 -0.008 0.034 -0.078 0.338 0.000 0.016 0.026 0.317**
VBN(Bg) 4 X Mash 1008 -0.003 0.007 0.104 -0.063 0.211 -0.005 0.002 0.018 0.273**
VBN 8 X Mash 114 -0.012 -0.008 0.034 -0.078 0.338 0.000 0.016 0.026 0.317**
VBN 8 X Mash 1008 0.001 0.024 0.002 0.010 0.22 0.015 0.002 0.014 0.286**
VBN 8 X VBG 11053 -0.008 0.01 0.014 0.020 0.211 -0.001 0.003 0.02 0.268**
Number of pods per plant (NPPP)
VBN(Bg) 4 X Mash 114 -0.029 -0.016 0.13 -0.041 0.643 -0.004 0.024 0.04 0.746**
VBN(Bg) 4 X Mash 1008 -0.004 0.019 0.247 -0.027 0.494 -0.005 0.002 0.02 0.746**
VBN 8 X Mash 114 -0.029 -0.016 0.13 -0.041 0.643 -0.004 0.024 0.04 0.746**
VBN 8 X Mash 1008 0.001 0.038 0.006 0.003 0.759 0.002 0.004 0.014 0.826**
ISSN 0975-928X
746
Pod length (cm) (PL)
VBN(Bg) 4 X Mash 114 -0.016 -0.004 0.027 0.001 0.103 -0.023 0.026 0.032 0.146**
VBN(Bg) 4 X Mash 1008 -0.004 0.006 0.091 -0.018 0.156 -0.016 0.005 0.032 0.252**
VBN 8 X Mash 114 -0.016 -0.004 0.027 0.001 0.103 -0.023 0.026 0.032 0.146**
VBN 8 X Mash 1008 0.000 0.002 0.001 0.004 0.041 0.038 0.005 0.010 0.100*
VBN 8 X VBG 11053 -0.008 0.004 0.013 0.001 0.068 -0.033 0.013 0.002 0.059
Number of seeds per pod (NSPP)
VBN(Bg) 4 X Mash 114 -0.020 -0.008 0.046 -0.019 0.232 -0.009 0.067 0.010 0.300**
VBN(Bg) 4 X Mash 1008 -0.002 0.001 0.093 -0.017 0.157 -0.011 0.008 0.042 0.272**
VBN 8 X Mash 114 -0.020 -0.008 0.046 -0.019 0.232 -0.009 0.067 0.010 0.300**
VBN 8 X Mash 1008 0.000 0.009 0.002 0.001 0.181 0.011 0.015 0.033 0.252**
VBN 8 X VBG 11053 -0.011 0.006 0.016 0.001 0.126 -0.005 0.082 0.026 0.240**
100 - seed weight(g) (HSW)
VBN(Bg) 4 X Mash 114 0.011 -0.001 0.021 -0.007 0.088 -0.003 0.002 0.291 0.402**
VBN(Bg) 4 X Mash 1008 0.000 0.002 0.06 -0.013 0.108 -0.006 0.004 0.091 0.246**
VBN 8 X Mash 114 0.011 -0.001 0.021 -0.007 0.088 -0.003 0.002 0.291 0.402**
VBN 8 X Mash 1008 0.000 0.007 0.001 0.001 0.058 0.002 0.003 0.179 0.250**
VBN 8 X VBG 11053 0.002 0.005 0.005 0.002 0.063 0.000 0.011 0.191 0.279**
* Bold figures denote direct effects .
*,** Significant at 5 % and 1 % level of probability, respectively.
S.No Crosses Residual effect
1 VBN(Bg) 4 X Mash 114 0.5721
2 VBN(Bg) 4 X Mash 1008 0.6460
3 VBN 8 X Mash 114 0.5721
4 VBN 8 X Mash 1008 0.5261