CrossMark Published by DiscoverSys
ABSTRACT
Background: This study aimed to assess the comparison between two HbA1c analyzers, Alere Afinion AS100, a boronate affinity based point of care testing (POCT), and High-Performance Liquid Chromatography (HPLC) based analyzer Bio-Rad Variant II Turbo HbA1c kit-2.0 as reference method.
Methods: This study involved 120 samples of peripheral K3EDTA whole blood sent to Clinical Pathology Laboratory of Cipto Mangunkusumo National Hospital for HbA1c measurement. Based on reference method, 40 samples with HbA1c ≤ 6.4%, 40 samples with HbA1c > 6.4%, and 40 samples with variant hemoglobin or hemoglobinopathy were included. Precision and accuracy of both analyzers were assessed using control materials. The goodness of fit between these methods were assessed by Bland-Altman plot and Passing-Bablok regression test.
Results were compared to National Glycohemoglobin Standardization Program (NGSP) recommendations.
Results: Reference method had total error (TE) ranging from 3.15% to 4.9%, while Afinion ranged from 2.16% to 3.24%. Both methods correlated well with Passing-Bablok regression showing no proportional or systematic differences. Linearity between tests was proven by Cusum test value of p > 0.05. Bland-Altman plot yielded 91.74% goodness of fit. No significant differences were observed in hemoglobinopathy and variant hemoglobin analysis of HbA1c. Conclusion: Afinion was precise, accurate, and linear to HPLC reference method. Both methods exhibited no systematic or proportional differences. Despite Bland-Altman plot of less than 95% goodness of fit, no clinically significant result was found based on NGSP criteria.
Keywords: Afinion, boronate affinity, HbA1c, HPLC, POCT, variant II Turbo.
Cite this Article: Tjahjadi, R., Giantini, A. 2019. Comparison of HbA1c measurement methods between automatic boronate affinity point of care testing and high-performance liquid chromatography. Bali Medical Journal 8(1): 270-274. DOI:10.15562/bmj.v8i1.1346
Comparison of HbA
1cmeasurement methods
between automatic boronate affinity point of care
testing and high-performance liquid
chromatography
Ricky Tjahjadi,1* Astuti Giantini2
INTRODUCTION
Diabetes is a chronic disease with increasing inci-dence around the globe. In 2014, it was estimated that 380 million of world population suffered from diabetes with projected incidence of 592 million in 2035. Diabetes usually diagnosed by utilizing fast-ing blood glucose, oral glucose tolerance test and HbA1c. The HbA1c has the added value of therapy monitoring.1
Diabetes management is proposed to keep blood glucose in normal range with minimal fluctuation. Blood glucose measurement could be done in laboratory using serum and plasma, or personally done using point of care testing (POCT) device on capillary blood sample. Since blood glucose natu-rally fluctuates, glycated hemoglobin is a better substitute for long term monitoring. Of all glycated hemoglobin, HbA1c is the most studied and checked parameter.2
Accurate measurement of HbA1c guides clini-cians to manage patient’s glycemic status and to aid in the setting of clinical decision making. The American Diabetes Association (ADA) recom-mended at least two measurements a year on
diabetic patient whose HbA1c is well-controlled, or even four measurements for those with uncon-trolled glycemia.3 World Health Organization (WHO) emphasizes that HbA1c could be utilized as a diagnostic tool only if the assay is well-controlled, interference free, and standardized to an inter-national reference.4,5 Harmonization of variable assays is achieved by standardization and certifica-tion by Nacertifica-tional Glycohemoglobin Standardizacertifica-tion Program (NGSP) and Diabetes Control and Complications Trial (DCCT).6
NGSP certified methods have to be periodically monitored since not all assays perform well in certain condition.4Erythrocyte age and conditions have to be taken into account when interpreting HbA1c. Patients with hemolysis or other conditions resulting in shortened erythrocyte age tends to have lower value of HbA1c, while other conditions such as iron deficiency anemia will result in higher HbA1c. Variant haemoglobins such as HbF, HbS and HbC also interferes with certain HbA1c assays. Manufacturers modify assays to eliminate variant hemoglobin interferences, but studies find that 1Clinical Pathology Resident,
Faculty of Medicine, University of Indonesia, Cipto Mangunkusumo Hospital, Jakarta, Indonesia
2Staff of Clinical Pathology
Department, Cipto Mangunkusumo Hospital, Jakarta,
Indonesia
*Corresponding to:
Ricky Tjahjadi; Clinical Pathology Resident, Faculty of Medicine, University of Indonesia, Cipto Mangunkusumo Hospital, Jakarta, Indonesia
Received: 2018-10-18 Accepted: 2019-1-15 Published: 2019-1-22
Volume No.: 8
Issue: 1
First page No.: 270
P-ISSN.2089-1180
E-ISSN.2302-2914
variations exist between NGSP certified methods which could change HbA1c diagnostic value.1,4
To date, there are more than 150 HbA1c assays with only two main principles, which are separation of hemoglobin fractions and chemical reaction.1,4 Each method has different interferences, but all methods have to be traceable to NGSP.4 POC devices offer convenience in reagents preparation, sampling and analysis, but need to be reliable enough to hold clinically relevant information.7 An ideal HbA
1c
assay needs to consistently have CV under 2% and minimal bias, also considering each method’s inter-fering factors.8 Quality of HbA
1c assays is a major
concern, since many comparative studies showed high CV and bias, even between NGSP certified assays.9 According to NGSP, both Afinion and Variant II are not interfered by the presence of HbC, HbS, HbE and HbD. Variant II is not interfered when HbF concentration is less than 25%, while no specific data is available on Afinion although it is assumed that boronate affinity is free from interfer-ence with HbF concentration 10 – 15 %.10
This research was conducted to assess the comparability between two HbA1c assays, HPLC in Bio-Rad VariantTM II TURBO HbA1c kit-2.0 and
boronate affinity POCT Alere Afinion HbA1c on varying HbA1c concentration and haemoglobinop-athy samples. Both methods used in this study have been certified and can be traced back to NGSP at www.ngsp.org.
MATERIALS AND METHODS
The study was a cross-sectional study and taken from April 2017 to June 2017. Sample analysis was done in Clinical Pathology Laboratory, Cipto Mangunkusumo General Hospital. A sum of 120 samples were obtained from patients’ remaining K3EDTA venous blood samples whose HbA1c were measured in RSCM Clinical Pathology Laboratory from April to May 2017. Samples were simultane-ously analyzed on Variant II and Afinion. Based on Variant II results, 40 samples had HbA1c concen-tration equal to or less than 6.4%, 40 samples with HbA1c concentration of more than 6.4 %, and the rest consisted of hemoglobinopathy samples. These 120 samples fulfilled minimum requirement for comparison test.11 Hemolytic samples were excluded from study population.12 Ethical approval was obtained from Ethics Committee, Faculty of Medicine, University of Indonesia according to approval letter 430/UN2.F1/ETIK/ 2017.
This study used Bio-Rad’s VariantTM II TURBO
HbA1c kit-2.0 as reference method which utilizes ion-exchange principle. Total retention time is 90 seconds per sample.13,14 Afinion AS100 Analyzer
(serial number AS0043636) as this study’s POCT method examined HbA1c by boronate affinity prin-ciple. The HbA1c analysis on Afinion has a detec-tion limit of 4-15% (NGSP) or 20-140 mmol/mol (IFCC).9 Accuracy and precision for both methods were assessed using two levels of control materials in which were optimized for each device before sample analyses. Statistical analysis was performed with IBM Statistical Package for the SocialSciences (SPSS) v20.0 and MedCalc Statistical Software v15.2. Accuracy and precision were described by mean, standard deviation (SD), coefficient of vari-ant (CV) and bias (d). Total error (TE) was calcu-lated by formula of: TE = d + 1.65 CV. Desirable TE was less than 3% according to Ricos’ allowable total error recommendation (TEa) or less than 5% according to Royal College of Pathologists of Australasia (RCPA)’s recommendation.15,16
Samples were analyzed separately according to HbA1c ≤ 6.4%, HbA1c > 6.4%, haemoglobinopathy samples, and as a whole comparison. Distribution of each data group was analyzed using Shapiro Wilk or Kolmogorov Smirnov when analyzed as a whole sample. Passing-Bablok regression was used to determine systematic or propor-tional differences between methods used in the sturfy. Linearity was assessed by cumulative sum (cusum) test. Cusum test’s p value of more than 0.05 meant methods compared were linear and Passing-Bablok formula could be applied.17,18 Bland-Altman plots were generated to analyze goodness of fit through mean difference line, limit of agreement (LoA) lines, and 95% confidence interval lines.19,20 Even if there is yet no consensus on bias limitations which held clinical signifi-cance, NGSP determined two methods should only have 95% confidence interval difference value of ±0.75% to be in accordance.21,22
RESULTS
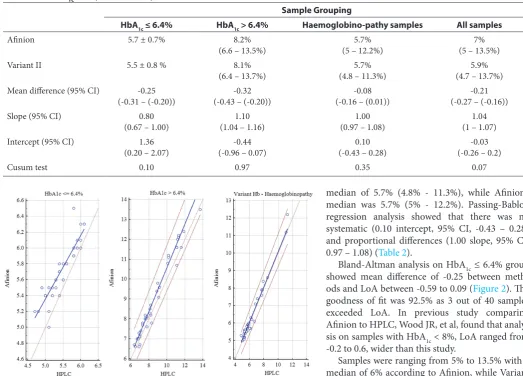
Performance summary of Variant II and Afinition between within-run and Afinion groups were depicted in Table 1. In Table 1, Afinion’s level 1 with-in-run test which was slightly lower than factory recommendation. HbA1c analysis on Afinion had a mean of 5.70% ± 0.35%, while Variant II yielded 5.45% ± 0.40% (Figure 1). Cusum test’s p value was 0.10, while Passing-Bablok regression had inter-cept of 1.36 (95% CI, 0.2 – 2.07), slope of 0.8 (95% CI, 0.67 – 1). Systematic difference as shown by Passing-Bablok intercept meant that Afinion always yield higher HbA1c than Variant II (Figure 1).
a median of 8.1%, ranging from 6.4% to 13.7%, while Afinion’s median was 8.2% and ranged from 6.6% to 13.5%.
Linearity was proven by Cusum test (p=0.97) and no systematic difference existed (intercept value was -0.44 and 95% CI ranging from -0.96 to 0.07), while proportional difference was observed on this higher value group (1.10 slope and 95% CI ranged from 1.04 – 1.16).
Haemoglobinopathy group data was not normally distributed according to Shapiro Wilk analysis. HbA analysis on Varian II resulted in
median of 5.7% (4.8% - 11.3%), while Afinion’s median was 5.7% (5% - 12.2%). Passing-Bablok regression analysis showed that there was no systematic (0.10 intercept, 95% CI, -0.43 – 0.28) and proportional differences (1.00 slope, 95% CI, 0.97 – 1.08) (Table 2).
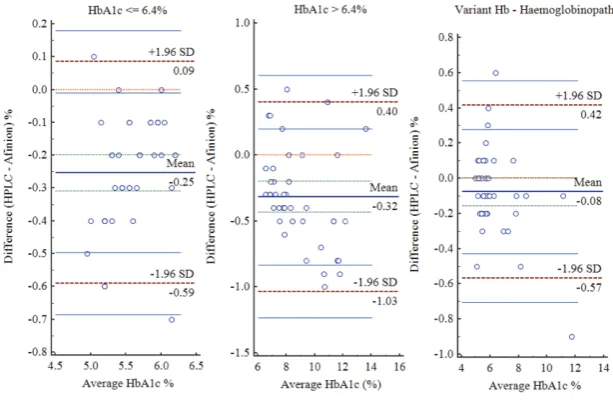
Bland-Altman analysis on HbA1c ≤ 6.4% group showed mean difference of -0.25 between meth-ods and LoA between -0.59 to 0.09 (Figure 2). The goodness of fit was 92.5% as 3 out of 40 samples exceeded LoA. In previous study comparing Afinion to HPLC, Wood JR, et al, found that analy-sis on samples with HbA1c < 8%, LoA ranged from -0.2 to 0.6, wider than this study.
Samples were ranging from 5% to 13.5% with a median of 6% according to Afinion, while Variant II results ranged from 4.7% to 13.7% and median was 5.9%. Passing-Bablok regression showed linearity between methods with Cusum test p value of 0.07. Intercept was -0.03 (95% CI, -0.26 – 0.2) and slope was 1.04 (95% CI, 1 – 1.07), so Afinion result could be formulated as 1.04 x – 0.03, given x is Variant II measurement (Figure 3). This result pointed that no systematic or proportional differ-ences existed between methods. Bland-Altman Plot gave -0.21% mean difference, with lower LoA of -0.78 (95% CI, -0.88 – (-0.69)) and upper LoA of 0.36 (95% CI, 0.27–0.45). The goodness of fit was 91.67% as ten out of 120 samples were not in accor-dance with the suitability test (Figure 3).
Table 2 HbA1c analysis summary on Variant II and Afinion
Sample Grouping
HbA1c ≤ 6.4% HbA1c > 6.4% Haemoglobino-pathy samples All samples
Afinion 5.7 ± 0.7% 8.2%
(6.6 – 13.5%) (5 – 12.2%)5.7% (5 – 13.5%)7%
Variant II 5.5 ± 0.8 % 8.1%
(6.4 – 13.7%) (4.8 – 11.3%)5.7% (4.7 – 13.7%)5.9%
Mean difference (95% CI) -0.25
(-0.31 – (-0.20)) (-0.43 – (-0.20))-0.32 (-0.16 – (0.01))-0.08 (-0.27 – (-0.16))-0.21
Slope (95% CI) 0.80
(0.67 – 1.00) (1.04 – 1.16)1.10 (0.97 – 1.08)1.00 (1 – 1.07)1.04
Intercept (95% CI) 1.36
(0.20 – 2.07) (-0.96 – 0.07)-0.44 (-0.43 – 0.28)0.10 (-0.26 – 0.2)-0.03
Cusum test 0.10 0.97 0.35 0.07
Figure 1 Passing-Bablok regression analysis on three HbA1c categories Table 1 Performance summary of Variant II and Afinion
Within-run Between-day
CV (%) d (%) TE CV (%) Factory Rec. CV (%) d (%) TE CV (%) Factory Rec.
Variant II level 1 1.54 -3.9 - 0 4.9 0.78 1.33 -1.9 – 1.9 3.15 0.66
Variant II level 2 2.08 -5.15 – 2.06 4.36 0.39 1.46 -4.1 – 1 3.64 0.69
Afinion level 1 0.83 0 – 1.58 2.16 0.9 1.1 1.58 – 3.17 2.77 0.6
DISCUSSION
Both methods’ CV got beyond each respective factory recommendations, except for Afinion’s level 1 within-run test which was slightly lower than factory recommendation (Table 1). This result was still acceptable since most publications recom-mended CV ≤ 4% for HbA1c assays, even if it still could cause HbA1c deviation of 0.3% in 7 out of 100 examinations. NGSP consistently encourage manu-facturers to achieve CV of less than 2% as desirable value,7,22 and this was achieved by Afinion in current study. Accuracy was analyzed and compared to Ricos’ recommendation which took imprecision, bias, and biological variation into account. Variant II had TE < 5% on all test levels which surpassed Ricos’ recommendation of less than 3%, but it still fulfilled RCPA’s criteria. Afinion averaged lower TE than Variant II with level 2 within-run test as
the only test surpassing 3%.15,16 This result was in accordance to previous Afinion performance study done by Wood JR, et al (2012) which yielded CV value of 2%.23
No systematic difference in linearity existed in this study while proportional difference was observed on this higher value group. Similar result was achieved by Wood, et al, who compared Afinion to HPLC, resulting in differences of -0.5% to 0.7% in HbA1c range from 8 to 10%, and differences of -0.7% to 1.1% for those whose HbA1c were more than 10%.23,24
Based on the haemoglobinopathy assessment, our study found that the mean relative difference between methods was higher than other popu-lation, in accordance to this study.23 On HbA
1c >
6.4% group, mean difference was -0.32 with LoA between -1.03 to 0.4, which resulted in 97.5% agreement. Compared to NGSP’s criteria which is 95% confidence interval of difference within 0.75% HbA1c, then both methods still meet the criteria (agree).25 Bland-Altman analysis on variant Hb and haemoglobinopathy samples showed that 95% of data compatible (fit) with -0.08% mean difference, upper LoA was 0.42 and -0.57 for lower LoA.
CONCLUSION
Afinion was precise with a CV value of less than 2%, but still had bias when analyzing patholog-ical control and yielded TE of 3.24%. Analysis by boronate affinity on Afinion was linear with HPLC method on Bio-Rad’s Variant II. Neither systematic nor proportional differences were found between methods when all samples were analyzed altogether. No significant bias was found on haemoglobinopa-thy samples analysis. Bland-Altman plot showed less than 95% goodness of fit, but the differences were still acceptable according to NGSP’s criteria.
Afinion had decent performance in accuracy and precision, so it could be utilized as HbA1c moni-toring device. Should analysis turned in doubtful result, clinical judgment and patient’s condition should be considered. Reference method should be consulted if needed.
ETHICS APPROVAL
This study has been approved by the Ethics of Committee, University of Indonesia, Jakarta, Indonesia
COMPETING INTEREST
The authors declare that they have no competing interests.
Figure 2 Bland-Altman plot on three HbA1c categories
AUTHORS’ CONTRIBUTION
Ricky Tjahjadi carried out data collection, labora-tory analysis, statistical analysis, and drafted manu-script. Ricky Tjahjadi and Astuti Giantini designed the study. Astuti Giantini supervised the study and revised manuscript. All authors read and approved the final manuscript.
REFERENCES
1. Sacks DB. Diabetes mellitus. In: Rifai N, Horvath AR, Wittwer CT [editor]. Tietz textbook of clinical chemis-try and molecular diagnostics. 6th ed. Missouri: Elsevier; 2018.p.1160-200.
2. Freeman VS. Carbohydrates. In: Bishop ML, Fody EP, Schoeff LE [editor]. Clinical chemistry: techniques, princi-ples, correlations. 6th ed. Baltimore: Lippincott Williams & Wilkins; 2010.p.309-27.
3. Cefalu WT [editor]. Standards of medical care in diabe-tes – 2017. USA: American Diabetes Association; 2017. 4. Razi F, Esfahani EN, Farzami MR, Tootee A, Qorbani M,
Ebrahimi SA, et al. Effect of the different assays of HbA1c on diabetic patients monitoring. Journal of Diabetes &
Metabolic Disorders. 2015;14:65.
5. Weykamp C. HbA1c: a review of analytical and clinical aspects. Ann Lab Med. 2013;33:393-400.
6. Adamska E, Waszczeniuk M, Goscik J, Golonko A, Wilk J, Pliszka J, et al. The usefulness of glycated hemoglobin A1c (HbA1c) for identifying dysglycemic states in individu-als without previously diagnosed diabetes. Advances in
Medical Sciences. 2012;57(2):296-301.
7. Heinemann L, Freckmann G. Quality of HbA1c measure-ment in the practice: the german perspective. Joiurnal of
Diabetes Science and Technology. 2015;9(3):687-95.
8. Westgard. Desirable biological variation database spec-ifications. Accessed Sept 18th 2017 [published 2014]. Available from: https://www.westgard.com/biodatabase1. htm#1.
9. Little RR. Performance of HbA1c assay methods: good enough? Clin Chem. 2016;60(8):1031-3.
10. NGSP. HbA1c assay interferences. Accessed Sept 18th 2017 [published Dec 2016]. Available from: http://www.ngsp. org/interf.asp.
11. Hage DS. Chromatography. In: Rifai N, Horvath AR, Wittwer CT [editor]. Tietz textbook of clinical chemis-try and molecular diagnostics. 6th ed. Missouri: Elsevier; 2018.p.266-94.
12. Alere Afinion HbA1c [package insert]. Norway; 2014. 13. Bio-Rad VARIANT II TURBO HbA1c Kit - 2.0 Instruction
Manual [package insert]. USA; 2009.
14. Hage DS. Chromatography. In: Rifai N, Horvath AR, Wittwer CT [editor]. Tietz textbook of clinical chemis-try and molecular diagnostics. 6th ed. Missouri: Elsevier; 2018.p.266-94.
15. Westgard. Desirable biological variation database spec-ifications. Accessed Sept 18th 2017 [published 2014]. Available from: https://www.westgard.com/biodatabase1. htm#1.
16. RCPA. RCPA allowable limits of performance for bio-chemistry. Accessed Sept 27th 2017 [published 2014]. Available from: https://www.westgard.com/rcpa-biochem-istry.htm#glycohaemoglobin.
17. Medcalc. Passing-Bablok regression. Accessed Sept 18th 2017 [published 2017]. Available from: https://www.med-calc.org/manual/passing-bablok_regression.php. 18. Bilic-Zulle L. Comparison of methods: Passing and Bablok 19. Medcalc. Bland-Altman plot. Accessed Sept 18th 2017
[published 2017]. Available from: https://www.medcalc. org/manual/blandaltman.php.
20. Bland JM, Altman DG. Statistical method for assessing agreement between two methods of clinical measurement.
The Lancet. 1986:307-10.
21. Summary of NGSP criteria. Accessed Sept 18th 2017 [pub-lished 2010]. Available from: http://www.ngsp.org/crit-summ.asp.
22. Rohlfing CL, Parvin CA, Sacks DB, Little RR. Comparing analytic performance criteria: evaluation of HbA1c certification criteria as an example. Clin Chim Acta. 2014;10:259-63.
23. Wood JR, Kaminski BM, Kollman C, Beck RW, Hall CA, Yun JP, et al. Accuracy and precision of the axis-shield afin-ion hemoglobin A1c measurement device. J Diabetes Sci Technol. 2012;6(2):380-6.
24. Zin RMWM, Kamil ZIA, Soh TRT, Embong M, Mohamud WNW. Haemoglobin A1c: comparing perfor-mance of two point of care devices with laboratory analy-ser. BMC Res Notes. 2013;6:540.
25. Little RR, Rohlfing CL, Sacks DB. Status of hemoglobin A1c measurement and goals for improvement: from chaos to order for improving diabetes care. Clinical Chemistry. 2011;57(2):205-14.