http://ijessr.com Page 1 LEARNER AUTONOMY PROFILE: AN ESTIMATION OF NORMATIVE STATISTICS
FOR NONTRADITIONAL ADULTS IN THE UNITED STATES
Michael K. Ponton
Regent University 1000 Regent University Drive Virginia Beach, VA, 23464, United States
Email Address: [email protected]
ABSTRACT
The Learner Autonomy Profile (LAP) is a battery of five instruments: the Inventory of Learner Desire (ILD), the Inventory of Learner Resourcefulness (ILR), the Inventory of Learner Initiative (ILI), the Inventory of Learner Persistence (ILP), and the Appraisal of Learner Autonomy (ALA). For over 15 years, the LAP (licensed to Human Resource Development Enterprises; HRDE) has been used in research on learner autonomy as well as the efforts of HRDE-certified coaches to facilitate the strengthening of learner autonomy in clients. To date, over 2,000 individuals have taken this battery around the world thereby producing multiple nonprobability samples. In 2017, Ponton presented normative descriptive statistics of mean and standard deviation for the ALAusing a previously unpublished estimation technique on a nonprobability sample (N = 817) arguably representing nontraditional adults (aged 25-64) in the United States with at least a high school education. The purpose of this article is to extend this previous analysis and provide estimates for the normative descriptive statistics associated with the ILD, ILR, ILI, and ILP thereby completing the LAP battery
KEYWORDS: Learner Autonomy Profile, learner autonomy, normative statistics, descriptive statistics, estimation technique.
1. INTRODUCTION
http://ijessr.com Page 2 The ILD (originally titled the Inventory of Intentional Behavior; Meyer, 2001) measures the presence of three constructs: basic freedoms, managing power, and acquired skills. Not contextualized to learning, the ILD measures salient constructs related to an adult’s ability to act agentically. The ILR (Carr, 1999) measures the degree to which an adult (a) anticipates the future benefits of learning, (b) prioritizes learning over nonlearning activities, (c) chooses to participate in learning versus nonlearning activities, and (d) solves problems that interfere with desired learning activities. The ILI (Ponton, 1999) assesses the presence of the following intentions as manifest by an adult learner: goal-directedness, action-orientation, persistence in overcoming obstacles, active-approach to problem solving, and self-startedness. The ILP (Derrick, 2001) measures construct that support perseverance in adult learning: volition, self-regulation, and goal-directedness. Bandura (1986, 1997) developed a social cognitive theory that incorporates self-efficacy—a self-perception of the ability to act successfully—as an important factor in motivating action and, thus, personal agency. Because of this, Ponton, Derrick, Hall, Rhea, and Carr (2005; [republished] 2016) developed the Appraisal of Learning Autonomy (ALA) as a measure of self-efficacy in autonomous learning, which was added to the LAP by HRDE.
The LAP (ILD, ILR, ILI, ILP, and ALA) has been administered to well over 2,000 participants in research studies and HRDE coaching activities around the world but primarily in the United States (U.S.) and Southeast Asia. Ponton, Carr, Schuette, and Confessore (2010, [republished] 2016) presented intercorrelations between all five scales where all correlations were significant at the .01 level and ranged from .391 to .893 (N = 2,074). Due to the varied uses, the LAP database of participants is not a probability sample of any particular population.
In 2017, Ponton used a then unpublished estimation technique (subsequently published in Ponton & Rovai, 2018) to develop normative statistics—mean and standard deviation—for the ALA for U.S. nontraditional adults (age range 25 to 64) with minimally a high school education. Normative descriptive statistics are often needed as comparative values, and Ponton (2018) used these estimated ALA statistics in showing the extent to which professors exceed the population in self-efficacy in autonomous learning. The purpose of this article is to replicate the analysis performed by Ponton (2017) and develop normative statistics for the ILD, ILR, ILI, and ILP with respect to the same defined population of (miminally) high school educated, nontraditional U.S. adults.
2. METHOD
2.1 Estimation technique
http://ijessr.com Page 3 Let:
k = number of groups
ni = sample size of ith group
wi = weighting of ith group
Mi = mean of ith group
ki i
n N
1
= pooled sample size.
The mean square statistic is given by
2
1 s n n
MS . (1)
For the pooled sample, the pooled mean is the weighted mean given by
ki
i i
P wM
M
1
. (2)
The weighted solution for the pooled mean square is then given by
k
i
P i i i
P w MS M M
MS
1
2
(3)
http://ijessr.com Page 4
P
P MS
N N s
1
2
(4)
2 P
P s
s . (5)
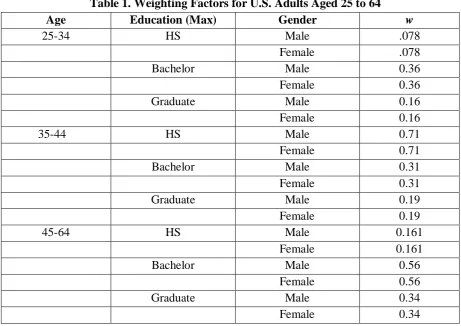
Using data presented by Ryan and Bauman (2016) on the U.S. adult population, Ponton (2017) developed the weighting factor (w; see eq. 2) presented in Table 1 that corresponds to the demographic variables captured by the LAP regarding age, education, and gender.
Table 1. Weighting Factors for U.S. Adults Aged 25 to 64
Age Education (Max) Gender w
25-34 HS Male .078
Female .078
Bachelor Male 0.36
Female 0.36
Graduate Male 0.16
Female 0.16
35-44 HS Male 0.71
Female 0.71
Bachelor Male 0.31
Female 0.31
Graduate Male 0.19
Female 0.19
45-64 HS Male 0.161
Female 0.161
Bachelor Male 0.56
Female 0.56
Graduate Male 0.34
Female 0.34
Note. 50-50 weighting by gender used.
For the present study, the goal was to calculate Mp and sp (i.e., the normative mean and standard deviation, respectively) for the ILD, ILR, ILI, and ILP.
2.2 DATA
http://ijessr.com Page 5 population of interest—U.S. nontraditional adults (age range 25 to 64) with minimally a high school education—a nonprobability sample of size 817 was generated.
3. FINDINGS
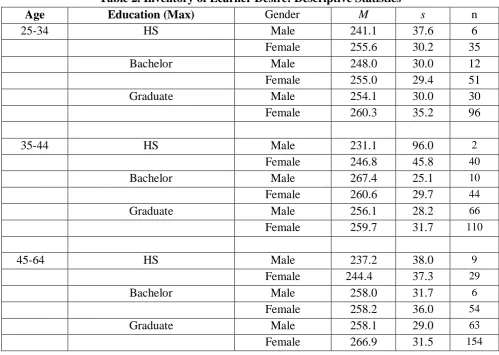
Descriptive statistics for the raw data are presented in Tables 2 through 5 for the ILD (possible range 0-330), ILR (possible range 0-530), ILI (possible range 0-440), and ILP (possible range 0-340), respectively. Table 6 presents the descriptive statistics (i.e., mean and standard deviation) for the raw data and the estimated normative statistics using equations 1-5. Note that as more data are acquired, further refinements to these estimates can be made using the method presented.
Table 2. Inventory of Learner Desire: Descriptive Statistics
Age Education (Max) Gender M s n
25-34 HS Male 241.1 37.6 6
Female 255.6 30.2 35
Bachelor Male 248.0 30.0 12
Female 255.0 29.4 51
Graduate Male 254.1 30.0 30
Female 260.3 35.2 96
35-44 HS Male 231.1 96.0 2
Female 246.8 45.8 40
Bachelor Male 267.4 25.1 10
Female 260.6 29.7 44
Graduate Male 256.1 28.2 66
Female 259.7 31.7 110
45-64 HS Male 237.2 38.0 9
Female 244.4 37.3 29
Bachelor Male 258.0 31.7 6
Female 258.2 36.0 54
Graduate Male 258.1 29.0 63
Female 266.9 31.5 154
Note. M = 258.3 and s = 33.1 for the raw data (N = 817).
http://ijessr.com Page 6
Age Education (Max) Gender M s n
25-34 HS Male 415.0 63.4 6
Female 418.2 54.2 35
Bachelor Male 322.6 68.6 12
Female 405.2 49.4 51
Graduate Male 382.8 51.3 30
Female 394.7 53.4 96
35-44 HS Male 404.9 80.8 2
Female 411.0 69.0 40
Bachelor Male 432.1 43.4 10
Female 408.1 56.1 44
Graduate Male 404.8 54.1 66
Female 414.2 59.8 110
45-64 HS Male 407.6 52.5 9
Female 413.0 49.2 29
Bachelor Male 412.8 38.4 6
Female 387.3 59.7 54
Graduate Male 410.2 50.3 63
Female 424.6 55.1 154
Note. M = 407.7 and s = 57.3 for the raw data (N = 817).
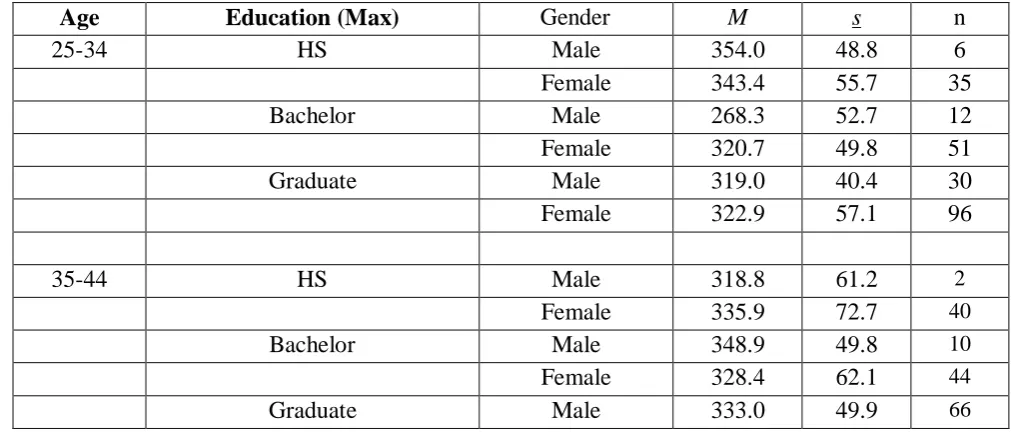
Table 4. Inventory of Learner Initiative: Descriptive Statistics
Age Education (Max) Gender M s n
25-34 HS Male 354.0 48.8 6
Female 343.4 55.7 35
Bachelor Male 268.3 52.7 12
Female 320.7 49.8 51
Graduate Male 319.0 40.4 30
Female 322.9 57.1 96
35-44 HS Male 318.8 61.2 2
Female 335.9 72.7 40
Bachelor Male 348.9 49.8 10
Female 328.4 62.1 44
http://ijessr.com Page 7
Female 348.4 55.8 110
45-64 HS Male 343.6 39.2 9
Female 346.5 50.5 29
Bachelor Male 361.1 33.1 6
Female 308.4 61.9 54
Graduate Male 340.8 45.1 63
Female 352.5 48.9 154
Note. M = 335.8 and s = 55.6 for the raw data (N = 817).
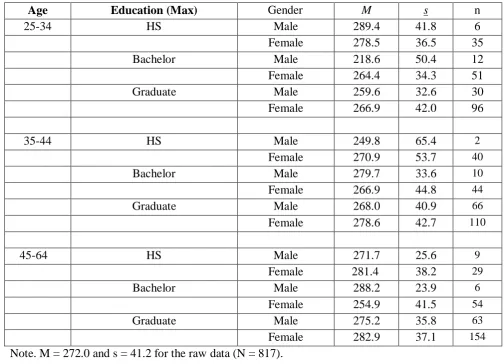
Table 5. Inventory of Learner Persistence: Descriptive Statistics
Age Education (Max) Gender M s n
25-34 HS Male 289.4 41.8 6
Female 278.5 36.5 35
Bachelor Male 218.6 50.4 12
Female 264.4 34.3 51
Graduate Male 259.6 32.6 30
Female 266.9 42.0 96
35-44 HS Male 249.8 65.4 2
Female 270.9 53.7 40
Bachelor Male 279.7 33.6 10
Female 266.9 44.8 44
Graduate Male 268.0 40.9 66
Female 278.6 42.7 110
45-64 HS Male 271.7 25.6 9
Female 281.4 38.2 29
Bachelor Male 288.2 23.9 6
Female 254.9 41.5 54
Graduate Male 275.2 35.8 63
Female 282.9 37.1 154
http://ijessr.com Page 8 Table 6. Raw Data and Pooled Estimates: Mean and Standard Deviation
Instrument M s MSp (eq. 2) (eq. 5)
ILD 258.3 33.1 249.5 38.9
ILR 407.7 57.3 408.5 56.7
ILI 335.8 55.6 338.5 53.1
ILP 272.0 41.2 272.8 40.6
Note. N= 817.
4. DISCUSSION
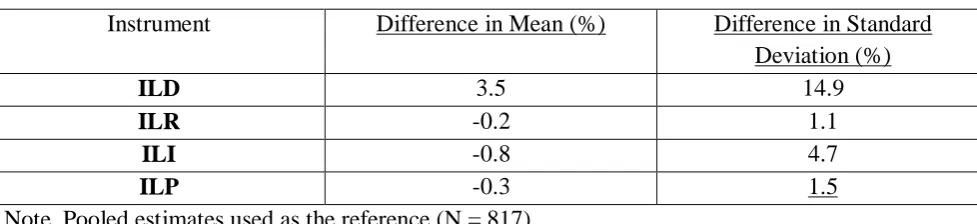
Other than the ILD, the difference between the raw data and pooled estimate for the mean is less than 1%; for the ILD, the difference is 3.5% (see Table 7). The larger differences are with respect to the standard deviation with again the largest difference found with the ILD (14.9%) followed by the ILI (4.7%), ILP (1.5%), and ILR (1.1%) as per Table 7.
Table 7. Percent Difference Between Raw Statistics and Pooled Estimates
Instrument Difference in Mean (%) Difference in Standard
Deviation (%)
ILD 3.5 14.9
ILR -0.2 1.1
ILI -0.8 4.7
ILP -0.3 1.5
Note. Pooled estimates used as the reference (N = 817).
The present findings suggest that there can be a large difference (particularly with respect to the ILD) in interpretive meanings attributed to the LAP findings of studies designed to assess differences between targeted groups and the population of U.S. nontraditional adults (age range 25 to 64) with minimally a high school education. As such, it is highly recommended to use the pooled estimates presented. The estimation technique outlined (Ponton, 2017)—derived from an exact mathematical solution (Ponton & Rovai, 2018)—offers a direct method of estimation that should be considered for other instruments in developing similarly important normative descriptive statistics that can be used in comparative studies.
5. REFERENCES
Bandura, A. (1986). Social foundations of thought and action: A social cognitive theory. Englewood Cliffs, NJ: Prentice Hall.
http://ijessr.com Page 9 Carr, P. B. (1999). The measurement of resourcefulness intentions in the adult autonomous learner (Doctoral dissertation). Retrieved from ProQuest Dissertations & Theses Global. (Order No. 9949341).
Confessore, G. J. (1992). An introduction to the study of self-directed learning. In G. J. Confessore & S. J. Confessore, (Eds.), Guideposts to self-directed learning: Expert commentary on essential concepts (pp. 1-6). King of Prussia, PA: Organization Design and Development.
Derrick, M. G. (2001). The measurement of an adult's intention to exhibit persistence in autonomous learning (Doctoral dissertation). Retrieved from ProQuest Dissertations & Theses Global. (Order No. 3006915).
Fishbein, M. & Ajzen, I. (1975). Belief, attitude, intention, and behavior: An introduction to theory and research. Reading, MA: Addison-Wesley.
Meyer, D. T. (2001). The measurement of intentional behavior as a prerequisite to autonomous learning (Doctoral dissertation). Retrieved from ProQuest Dissertations & Theses Global. (Order No. 9999882).
Ng, S. F., & Confessore, G. J. (2010). The relationship of multiple learning styles to levels of learner autonomy. International Journal of Self-Directed Learning, 7(1), 1-14. Retrieved from
http://sdlglobal.com/journals.php
Park, E., & Confessore, G. J. (2002). Development of new instrumentation: Validation of the Learner Autonomy Profile beta version. In H. B. Long & Associates (Eds.), Twenty-first century advances in self-directed learning (pp. 289-306). Schaumburg, IL: Motorola University Press.
Ponton, M. K. (1999). The measurement of an adult's intention to exhibit personal initiative in autonomous learning (Doctoral dissertation). Retrieved from ProQuest Dissertations & Theses Global. (Order No. 9949350).
Ponton, M. K. (2017). Appraisal of Learner Autonomy: An estimation of normative statistics for U.S. nontraditional adults. International Journal of Self-Directed Learning, 14(2), 45-52. Retrieved from http://sdlglobal.com/journals.php
Ponton, M. K. (2018). Self-efficacy in autonomous learning: A preliminary study of full professors. International Journal of Self-Directed Learning, 15(1), 31-42. Retrieved from
http://sdlglobal.com/journals.php
Ponton, M. K., Carr, P. B., & Derick, M. G. (2004). A path analysis of the conative factors
associated with autonomous learning. International Journal of Self-Directed Learning, 1(1), 59-69. Ponton, M. K., Carr, P. B., Schuette, C. T., & Confessore, G. J. (2010). Self-efficacy and the Learner Autonomy Profile. International Journal of Self-Directed Learning, 7(2), 54-63.
Ponton, M. K., Carr, P. B., Schuette, C. T., & Confessore, G. J. (2016). Self-efficacy and the Learner Autonomy Profile. In M. K. Ponton & P. B. Carr (Eds.), Autonomous and self-directed learning: Agentic perspectives (pp. 193-205). Chesapeake, VA: Watertree Press.
http://ijessr.com Page 10 Ponton, M. K., Derrick, M. G., Hall, J. M., Rhea, N. E., & Carr, P. B. (2005). The relationship
between self-efficacy and autonomous learning: The development of new instrumentation. International Journal of Self-Directed Learning, 2(1), 50-61.
Ponton, M. K., Derrick, M. G., Hall, J. M., Rhea, N. E., & Carr, P. B. (2016). The relationship between self-efficacy and autonomous learning: The development of new instrumentation. In M. K. Ponton & P. B. Carr (Eds.), Autonomous and self-directed learning: Agentic perspectives (pp. 167-183). Chesapeake, VA: Watertree Press.
Ponton, M. K., & Rovai, A. P. (2018). Exact solution for pooled standard deviation. International Journal of Education and Social Science, 5(1), 22-27.
Ryan, C. L., & Bauman, K. (2016). Educational attainment in the United States: 2015. Retrieved from the U.S. Census Bureau website:https://www.census.gov