evaluation of module extraction algorithms in complex
biological networks. PhD thesis, University of
Nottingham.
Access from the University of Nottingham repository: http://eprints.nottingham.ac.uk/30524/1/thesis.pdf
Copyright and reuse:
The Nottingham ePrints service makes this work by researchers of the University of Nottingham available open access under the following conditions.
· Copyright and all moral rights to the version of the paper presented here belong to
the individual author(s) and/or other copyright owners.
· To the extent reasonable and practicable the material made available in Nottingham
ePrints has been checked for eligibility before being made available.
· Copies of full items can be used for personal research or study, educational, or
not-for-profit purposes without prior permission or charge provided that the authors, title and full bibliographic details are credited, a hyperlink and/or URL is given for the original metadata page and the content is not changed in any way.
· Quotations or similar reproductions must be sufficiently acknowledged.
Please see our full end user licence at:
http://eprints.nottingham.ac.uk/end_user_agreement.pdf
A note on versions:
The version presented here may differ from the published version or from the version of record. If you wish to cite this item you are advised to consult the publisher’s version. Please see the repository url above for details on accessing the published version and note that access may require a subscription.
evaluation of module extraction
algorithms in complex biological
networks
James Peter Gilbert, BSc
A thesis presented for the degree of
Doctor of Philosophy
School of Computer Science
University of Nottingham
United Kingdom
2015
I would like to thank my supervisors Jamie Twycross, Andrzej Bargeila and Andrew Wood for constantly providing support throughout my PhD, especially though difficult periods where the light at the end of the tunnel felt very dim. To Michael Holdsworth and Natalio Krasnogor, thank you for providing me with the opportunity and resources with this undertaking, making this work possible. To Pawe l Widera, thank you for constantly challenging me during my first year of study and never being happy with work that was “good enough”. To my family for the support they have given me over this period. I would like to all my friends and colleagues in Nottingham and Newcastle that helped the dull days go by and made sure the important things got done. But mostly I would like to thank Josie McCulloch for putting up with me for the last 3 years and being a constant source of support and inspiration.
This thesis presents CiGRAM, a model of complex networks with known modular structure that is capable of generating realistic graph topology. Much of the recent focus on module detection has been geared towards developing new algorithms capable of detecting biologically significant clusters. However, evaluating clusterings detected by different methods shows that there is little topological agreement or consensus in terms of meta-data despite most methods discovering modules with significant ontology.
In this thesis an approach to modelling complex networks with ground-truth modular structure is presented. This approach is capable of generating graphs with heterogeneous degree distributions, high clustering coefficients and assortative degree correlations observed in real data but often ignored in existing benchmarks. Moreover, the model for modular structure concludes that non-modular random graphs are indistinguishable from modules.
This model can be tuned to fit many empirical biological and non-biological datasets through fitting target graph summary statistics. The ground-truth structure allows the evaluation of module extraction algorithms in a domain specific context. Furthermore, it was found that degree assortativity appears to negatively impact several module extraction methods such as the popular infomap and modularity maximisation methods. Results presented disagree with other benchmark models highlighting the potential for future research into improving existing methods in ways that challenge assumptions about the detectability of modules.
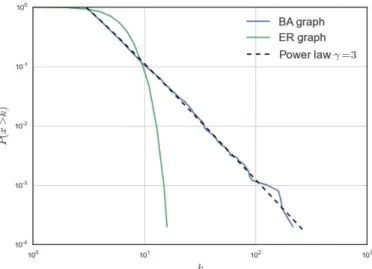
2.1 Hairballs . . . 23 2.2 Example of a partition and cover. . . 26 2.3 Modularity landscape of theE coli metabolic network. . . 28 2.4 Degree distribution of an Erd˝os-R´enyi-Gilbert random graph . . 37 2.5 Complementary cumulative degree distributions for
Barabasi-Albert (BA) and Erd˝os-R´enyi (ER) graphs . . . 40
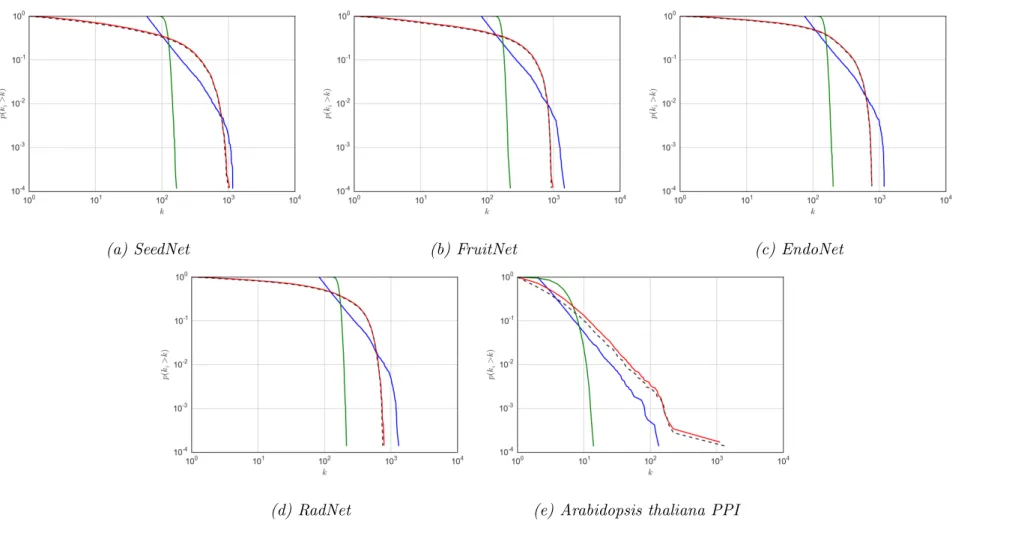
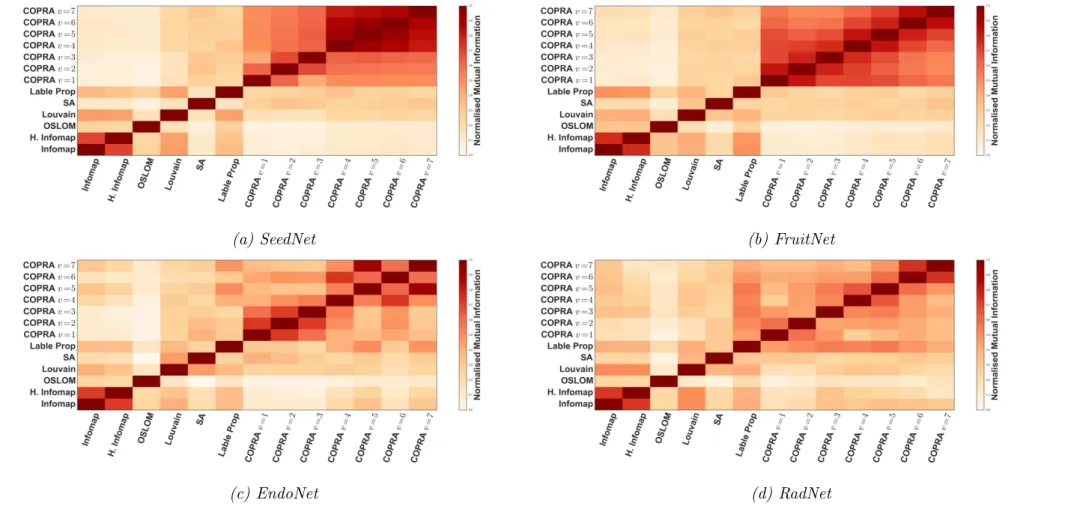
3.1 Degree distributions of co-expression networks. . . 56 3.2 Normalised mutual information between clusterings detected by
different algorithms. . . 61 3.3 Measuring algorithmic consistency at different correlation
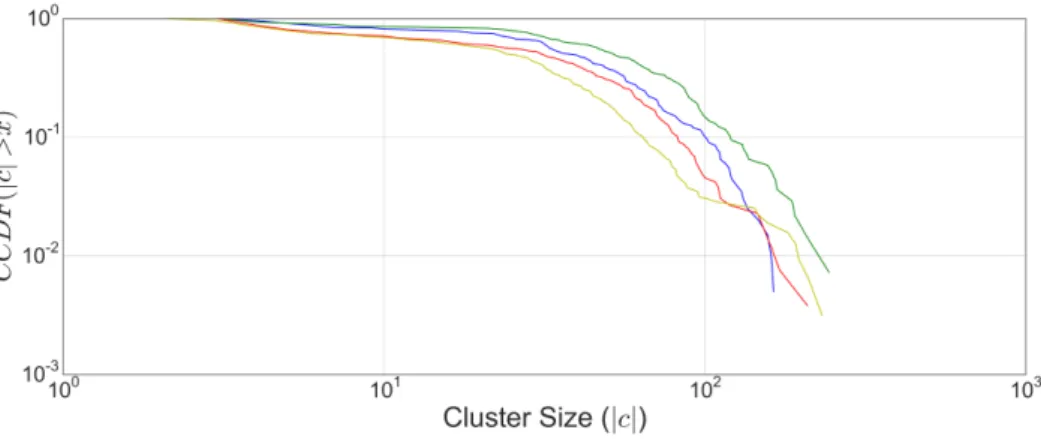
thresh-olds. . . 63 3.4 Complementary cumulative degree distributions for cluster sizes
of OSLOM modules. . . 71 3.5 Fraction of clusters enriched for different phylogenetic groups. . 74
4.1 Wrapped Gaussian distributions. . . 85 4.2 α distribution depending onσs. . . 86
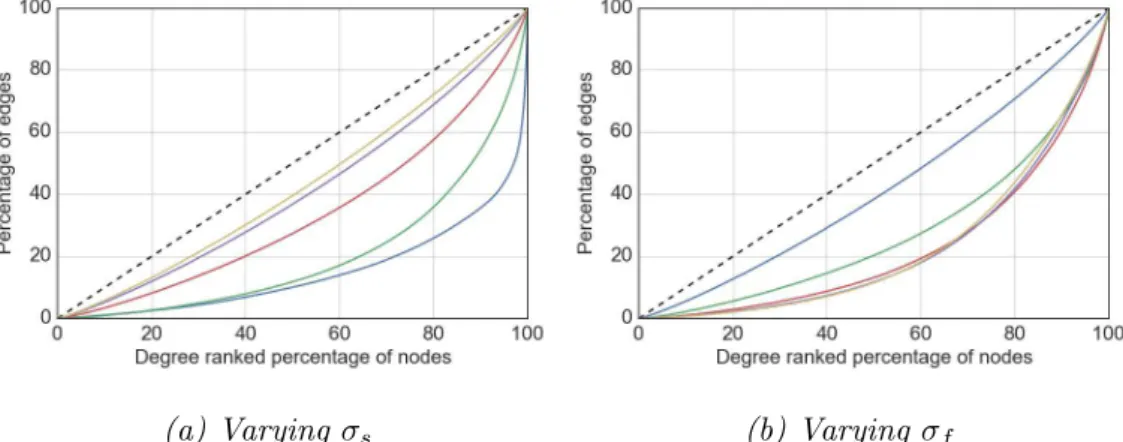
4.3 Influence of the model parameters σs (a) and σf (b) on the
resulting degree distributions of the generated graphs. . . 93 4.4 Influence ofa parameter on topology . . . 95 4.5 Influence of assortativity parameter on degree distributions. . . 96 4.6 Dependency between assortativity and density. . . 97 4.7 Visualisation of assortative, heterogeneous community structure. 102 4.8 Dependency between the number of communities and degree
distribution. . . 105
4.10 Modularity and clustering with increasing number of communi-ties K. . . 107 4.11 Modularity and clustering for increasing po. . . 108
4.12 Example graphs generated with varying levels of overlap . . . . 112 4.13 Time (t) in seconds to generate graphs. . . 113
5.1 Spectral fit of metabolic networks with CiGRAM. . . 122 5.2 Topological properties of best spectral fits for metabolic networks
generated with CiGRAM. . . 123 5.3 Complementary cumulative degree distributions highlights the
insensitivity of the KS test to the extreme tails of distributions. 125 5.4 Degree distributions for best fit models and compared to real
world graphs. . . 136 5.5 Distribution of degree assortativity coefficient for best fit models.137 5.6 Distribution of mean clustering for best fit models. . . 138
6.1 Clustering and degree assortativity coefficients of LFR bench-mark models with increasing mixing µ. . . 147 6.2 Normalised mutual information results on assortative graphs for
the Infomap algorithm. . . 151 6.3 Normalised mutual information results on assortative graphs for
the OSLOM algorithm. . . 155 6.4 Normalised mutual information results on assortative graphs for
different algorithms. . . 156 6.5 Normalised mutual information results on assortative graphs for
different algorithms. . . 157 6.6 Practical performance of community detection algorithms for E
coli metabolic network models . . . 159 6.7 Practical performance of community detection algorithms for
biological models . . . 163 6.8 Practical performance of community detection algorithms for
between algorithms . . . 168
A.1 Web based visualisation of RadNet network. . . 181 A.2 Search and gene view interfaces to the Network web visualisation
tool. . . 183 A.3 Cluster based visualisation of FruitNet. . . 184
B.1 Influence of density on the resulting normalised Laplacian spectra.186 B.2 Spectral and cumulative spectral distributions for varying levels
of σ and a parameters. . . 187 B.3 Spectral and cumulative spectral distributions varying K. . . 188 B.4 Spectral and cumulative spectral distributions varying ek and po. 191
B.5 Distribution of mean shortest path length for best fit models. . . 192 B.6 Distribution of central point dominance for best fit models . . . 193 B.7 Distribution of maximal modularity for best fit models . . . 194 B.8 Spectral distribution of networks. . . 195 B.9 Cumulative distribution of the eigenvalues of the Normalised
Laplacian matrix. . . 196
C.1 Accuracy of best fit degree distributions by KS distance from target average CDF across range ofek. . . 199
C.2 Cumulative degree distribution plots for best fit assortative models at varying levels of ek. . . 200
C.3 Complementary cumulative degree distribution plots for best fit assortative models at varying levels of ek. . . 201
C.4 Violin plots showing accuracy of maximum degree across range of ek targets. . . 202
C.5 Violin plots of assortativity for graphs generated with CiGRAM with best fit parameters . . . 203 C.6 Normalised mutual information consensus matrix for agreement
between algorithms on best fit biological networks with the Fixed
Overlap models. . . 205 C.8 Normalised mutual information consensus matrix for agreement
between algorithms on best fit biological networks with the High Overlap models. . . 206
2.1 Definitions for symbols used throughout the thesis. . . 15
3.1 Observed topological properties of co-expression datasets. . . 54
3.2 Module extraction algorithms tested in this study. . . 57
3.3 RadNet significantly over-represented gene ontology terms. . . . 67
3.4 EndoNet significantly over-represented gene ontology terms. . . 68
3.5 SeedNet significantly over-represented gene ontology terms. . . . 69
3.6 FruitNet significantly over-represented gene ontology terms. . . 70
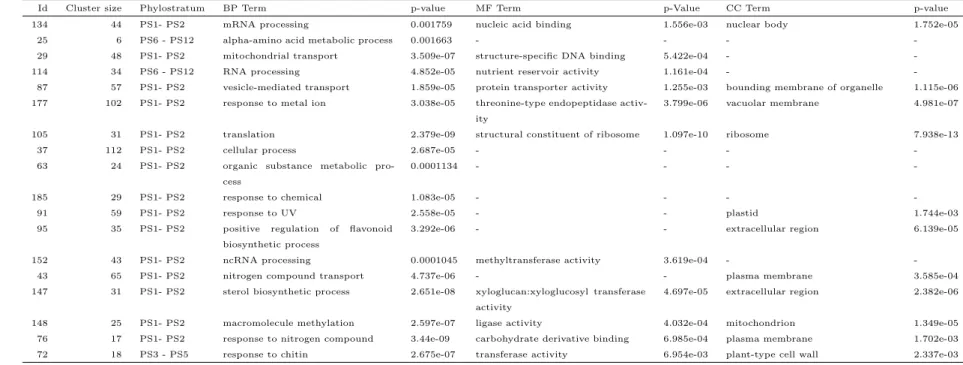
3.7 Most significant gene ontology terms in EndoNet for communities detected by the OSLOM algorithm significant for a phylogenetic group. . . 75
3.8 Most significant gene ontology terms in RadNet for communities detected by the OSLOM algorithm significant for a phylogenetic group. . . 76
3.9 Most significant gene ontology terms in SeedNet for communities detected by the OSLOM algorithm significant for a phylogenetic group. . . 77
3.10 FruitNet significant clusters found with each algorithm for known co-regulated gene sets. . . 79
4.1 Description of CiGRAM parameters. . . 97
5.1 Topology of datasets fitted with CiGRAM . . . 118
5.2 Fit of graph spectra for metabolic networks . . . 124
5.3 Best fit CiGRAM results . . . 133
6.1 Parameters of the LFR benchmark . . . 145
6.3 Significance of Normalised Mutual Information (NMI) recall by algorithms on assortative graphs generated with CiGRAM. . . . 153 6.4 Biological networks overall performance of algorithms ranked by
mean NMI scores . . . 165 6.5 Overall performance of algorithms ranked by mean NMI scores
across all test models and samples for the non-biological networks.166
B.1 CiGRAM best fit parameters discovered with particle swarm optimisation. . . 189 B.2 Topological results for best fit models. . . 190
Abstract ii
List of Figures iii
List of Tables vii
1 Introduction 1
1.1 Introduction . . . 1
1.2 Background and motivation . . . 2
1.3 Aims and objectives . . . 3
1.4 Research questions . . . 3
1.5 Organisation of the thesis . . . 4
1.6 Contributions to knowledge . . . 6
2 Literature Review 8 2.1 Introduction . . . 8
2.2 Preliminary graph theory . . . 8
2.2.1 Basic concepts . . . 9
2.2.2 Measures of topology . . . 11
2.2.3 Graph Laplacians . . . 13
2.3 Modules in biological networks . . . 14
2.3.1 Protein-Protein interaction networks . . . 16
2.3.2 Correlation of expression networks . . . 18
2.3.3 Metabolic Networks . . . 20
2.3.4 Visualisation of biological networks . . . 22
2.3.5 Discussion of biological modules . . . 24
2.4 Methods for module extraction . . . 25
2.4.3 Information theoretic approaches . . . 31
2.4.4 Statistically significant modules with OSLOM . . . 33
2.4.5 Label Propagation . . . 34
2.4.6 Summary of module detection methods . . . 35
2.5 The topology of complex networks . . . 36
2.5.1 Heterogeneous degree distributions . . . 38
2.5.2 Small worlds and transitivity . . . 41
2.5.3 Models with fixed degree distributions . . . 42
2.5.4 Assortative networks . . . 43
2.5.5 Benchmarking models for module detection algorithms . 45 2.6 Chapter summary . . . 47
2.7 Conclusions from the literature . . . 47
3 Modules in correlation of gene expression networks 49 3.1 Introduction . . . 49
3.2 Datasets . . . 51
3.2.1 Topology and model fit . . . 53
3.3 Community detection algorithms . . . 55
3.3.1 Comparing generated clusterings . . . 58
3.3.2 Clustering comparison summary . . . 62
3.4 Enrichment of modules . . . 64
3.4.1 Gene ontology enrichment . . . 65
3.4.2 Clusters and phylogeny . . . 71
3.4.3 Knock-out experiments . . . 73
3.4.4 Enrichment summary . . . 78
3.5 Chapter Summary and Discussion . . . 80
4 Circular Gaussian random graph models 82 4.1 Introduction . . . 82
4.2 Single community model . . . 84
4.2.1 Wrapped Gaussian distributions . . . 84
4.2.5 Model results . . . 92
4.2.6 Single community model summary . . . 94
4.3 Graphs with modular structure . . . 96
4.3.1 Core assumption about modules . . . 98
4.3.2 Basic block structure . . . 99
4.3.3 Heterogeneous modules with overlapping nodes . . . 100
4.3.4 Modular model results and discussion . . . 104
4.3.5 Modular graph summary . . . 107
4.4 Related topological models . . . 108
4.5 Implementation and performance . . . 109
4.6 Chapter summary . . . 110
5 Model parameter selection 114 5.1 Introduction . . . 114
5.2 Particle Swarm Optimisation . . . 115
5.3 Dataset descriptions . . . 117
5.4 Fitting graph spectra . . . 118
5.4.1 Fitting Metabolic Networks . . . 121
5.4.2 Discussion of fitting network spectra . . . 122
5.5 Fitting summary statistics . . . 124
5.5.1 Measuring degree distribution distance . . . 125
5.5.2 Summary statistic distance . . . 127
5.5.3 Graph parameter tests . . . 128
5.5.4 Assessing fit quality . . . 131
5.5.5 Results summary . . . 140
5.6 Chapter summary . . . 140
6 Benchmarking module detection algorithms 142 6.1 Introduction . . . 142
6.2 Comparison with the LFR benchmark . . . 144
6.3 Ensuring connectivity in CiGRAM . . . 147
6.5.1 Performance on best fit graphs . . . 159
6.5.2 Performance summary . . . 167
6.6 Chapter summary . . . 169
7 Conclusions and future work 171 7.1 Thesis summary . . . 171 7.2 Conclusions . . . 173 7.3 Limitations . . . 174 7.4 Contributions . . . 175 7.4.1 Major contributions . . . 175 7.4.2 Minor contributions . . . 177 7.5 Future work . . . 178
A Web visualisation tool 181 B Model parameter selection supplement 185 B.1 CiGRAM and graph spectra . . . 185
B.1.1 Parameter influence on spectra . . . 185
B.2 Additional fitting results . . . 186
C Benchmarking supplement 197
Introduction
1.1
Introduction
The detection of modules, highly interconnected substructures that perform specific tasks, in complex biological networks is a considerable challenge that is of importance to many areas of biological hypothesis generation. The algorithms that perform these tasks are crucial to the development of our understanding of the inner workings of living things. This thesis concerns the development of tools to aid the analysis, evaluation and selection of module detection algorithms in a practical context. By providing realistic models that fit observed topological properties, such as heterogeneous connection distributions and highly transitive relationships, it is possible to provide an analysis of algorithmic performance. However, to date, current modelling approaches focus on general “universal” properties such as scale-free topology, rather than providing domain and context specific tests. The most significant contribution here presents an approach to generating random graphs with realistic properties such as heterogeneous connection counts and configurable correlation coefficients for connections between similar vertices. This introductory chapter aims to outline the motivation and aims of the thesis and gives a broad outline of each of the chapters contained within.
1.2
Background and motivation
Since the development of high throughput “omics” data collection methods, the biosciences have become deluged with big data problems that require the development of new methods of analysis [1]. Seeing the world through the eyes of a “one gene one function” perspective is a view of nature that is quickly being replaced with a view of systemic function. At the core of the methodology of this systems biology approach is the concept of abiological network [2]. This abstraction focuses on understanding the function of genes and proteins through their interactions with one another and the outside world.
This systems paradigm has given rise to the notion of biologicalmodules; sub-networks of genes that perform specific, isolated functions that relate to testable hypotheses [3]. These modules have been shown to relate to known biological processes such as complexes within networks of protein interactions [4].
The detection of these modular components borrows heavily from the field of complex networks. This discipline focuses on uncovering how topology influences systemic behaviour [5]. The field has been popularised by notions such as “small-worlds” [6], where networks are characterised by short average path lengths due to properties such as“scale-free” [7] topology where extremely heterogeneous configurations are found to emerge in natural systems. These and related ideas have crossed over in to computational biology in many core areas.
The development of module discovery in biological networks is closely related to the idea ofcommunity detection in sociological networks [8]. Consequently, the terms “community” and “module” are used interchangeably throughout this thesis. This work promises interesting results, yet the recent explosion in the number of methods at the researcher’s disposal [8] has created its own set of problems. Few benchmarks exist to evaluate community detection algorithms [9], and those that do exist are problem specific and lack the ability to properly mimic the topology of other real world networks.
1.3
Aims and objectives
The overall aim of this project is to develop a method to evaluate the per-formance of module extraction algorithms in the context of realistic topology. This requires the development of a modelling approach capable of generating ground-truth modular structures against which algorithms can be compared. In order to achieve this goal, a number of key points need to be achieved:
1. To evaluate current methods for validating clustering approaches through use of meta-data, highlighting any limitations.
2. Formally define what modular structure is and how it can be modelled.
3. Develop a model capable of generating synthetic complex networks with realistic topology and a known community structure.
4. Select the best parameters of this generative model in order to match the topology of real world datasets.
5. Evaluation of the impact real world topology has upon module extraction algorithms.
6. Development of a formal methodology for selecting appropriate module extraction algorithms in a domain specific setting.
1.4
Research questions
The above aims and objectives relate to several specific research questions to be asked in this thesis.
• How do different module extraction algorithms compare to one another? This question is of real interest to research in complex biologi-cal networks. If different algorithms produce different clusterings, it is important to understand the methods that can be used to aid selection.
• How can a module be formally defined? If one wishes to model networks with modular structure, a clear definition of what a community
actually is must be defined. In terms of computational modelling, a clear definition of modular structure that can be evaluated is required.
• How can assortative structure be modelled? Degree assortativity is an important topological property that is found in many real world networks relating to the propensity of nodes to connect to nodes of similar degree (defined more formally in Section 2.5.4) From the perspective of a probabilistic model, there must be an intuitive method of configuring the degree-degree correlations.
• Can the developed probabilistic model be fitted to real net-works or other specific topology? Whilst a model capable of gener-ating interesting topology is useful, it is only really an important tool if it can be tuned to fit empirical data. This requires an investigation into the distance measures and summary statistics that can be used to evaluated model fit.
• Does assortativity impact the performance of module detection algorithms? Degree assortativity is a feature observed in many networks that has not been widely modelled. This means that it is unknown as to whether a given community detection approach is impacted by correlated degree connectivity or not.
• For a given network, which module detection algorithm is the best choice? This question lies at the heart of this thesis. The wide array of module extraction approaches makes it difficult for researchers to select an appropriate algorithm for a given task. The use of accurate models with a known modular structure can aid in this decision, as well as helping with the improvement of algorithms for domain specific purposes.
1.5
Organisation of the thesis
This section outlines each chapter of this dissertation.
Chapter 2 provides the literature review for this thesis. This chapter first gives a broad overview of the graph theoretic definitions used throughout this
thesis. The remainder of the chapter can be thought of as being broadly broken into two sections. The first section consists of a review of relevant work with regards to biological correlation of expression, protein interaction and metabolic networks involved in this study. The second section of this chapter is concerned with the theory and topology of complex networks in a wider sense. Particular attention is paid to relevant models for the generation of topological structure as well as a review of existing module detection algorithms used throughout this study.
Chapter 3 then moves on to a core practical and theoretical application for the theory of complex networks in the form of whole genome correlation of expression data sets taken from plant biology. This serves as an evaluation of the state of the art in module detection. Particular focus is paid to the limitation of selecting such methods and ways to evaluate the detected communities using available, externally curated meta-data. An appendix to this chapter, Appendix A, also presents a web visualisation tool for these methods that offers bioscientists the ability to query the large scale datasets used in this study.
Chapter 4 introduces theCircularGaussianRandomGraphModel (CiGRAM). This is an approach to generating synthetic networks with realistic topology and community structure. CiGRAM is an extended form of fixed density random graphs that uses latent geometric variables to generate degree correlations and heterogeneity, with block structure to form modules. This approach makes the assumption that a module is indistinguishable from a random sub-graph, providing an approach for evaluating community detection algorithms.
In Chapter 5 the applicability of CiGRAM is validated. This comes in the form of evaluating the spectral properties CiGRAM is capable of generating, as well as the use of spectral distance and summary statistics to fit real world networks.
Chapter 6 formally demonstrates how CiGRAM can be used to evaluate community detection algorithms. One aspect of this work is the analysis of community detection algorithms in the context of assortative graphs, a property observed in the data sets evaluated in Chapter 3. The chapter then presents a formal methodology for the evaluation of community detection algorithms in the context of best-fit models from Chapter 5. This presents an approach
to algorithm evaluation and selection in a practical context. The chapter also includes a comparison of CiGRAM to other related benchmark graphs.
The thesis concludes in Chapter 7, where a summary of the contributions is provided. This also includes a discussion into how well the core aims and objectives of this work were met, as well as ideas for possible future directions of this research.
1.6
Contributions to knowledge
The research described in this thesis has demonstrated applicability of module detection algorithms to complex networks derived from correlation analysis of expression data sets. The use of statistical methods to aid biological dis-covery gives several specific biological hypotheses that can be experimentally validated, such as the relationship between co-expressed biological modules and evolutionarily conserved genes. This work also highlights a core limitation in the current methods due to the lack of agreement between the different module detection algorithms. This achieves one of the key objectives of the thesis; the evaluation of current approaches for validating detected clusters against known meta-data. A key finding is that the methods appear to be insufficient with regard to aiding algorithm selection.
The most significant contribution of this thesis is CiGRAM, which achieves the key objective of a model capable of generating a ground-truth modular structure. This model generates realistic modular structure through a simple assumption about the definition of a module, that it is indistinguishable from a random graph in terms of dividing into meaningful sub modules. This allowed the development of a methodology for the evaluation of module detection algorithms through the use of realistic synthetic models of datasets, another objective of the thesis. This methodology can be briefly outlined as follows and relates strongly to the structure of the thesis:
• Select a model capable of generating a known ground truth community structure and topology matching the real world network.
the empirical data.
• Generate multiple models with fixed levels of overlap and other parameters to provide a wide topological test bed.
• Test the algorithms on these models and select the best algorithm in terms of score.
• Validation of algorithms against available meta-data relating vertices to function.
Where multiple algorithms perform well, the additional meta-data step should be used evaluate clusters detected in real world data (such as the methods explored in Chapter 3) allowing the user to make an informed decision about algorithm selection. CiGRAM also allowed the discovery that certain key algorithms perform significantly worse in the presence of high levels of degree assortativity, a property observed in empirical data.
In addition to the definition of CiGRAM described in this thesis, Open Source software has been developed providing an extensible python library that can be used for module extraction evaluation. Appendix A also presents a set of web visualisations which provide the opportunity for researchers to explore the large scale expression data sets with a view to hypothesis generation. This is provided without the need to download and conduct a lengthy analysis of the data, as other sources of information are readily integrated into the tools.
Literature Review
2.1
Introduction
The following Chapter reviews the literature related to the project. Firstly a preliminary section discussing the graph theory used throughout this thesis is provided. Next, the importance of modules in biological datasets is discussed, focusing on protein-protein interaction, metabolic and correlation of expression networks. The following section moves onto technical examples of how the global modular structure of networks is detected. Finally, methods for modelling the topology found in empirical datasets are discussed, giving a grounding for the benchmarking approach presented in Chapter 4.
2.2
Preliminary graph theory
This section gives the basic definitions of terminology relating to graph theory used throughout this thesis. The reader should note that the words “network” and“graph” are used interchangeably. A network can refer to any set of objects, referred to as nodes or vertices, that interact according to some specific pattern of edges. This notion inherently relates to the flow of information between objects in a system. If one imagines a particle taking a random walk around a network, stopping at each vertex, the set of vertices that can be visited is always dependent on the set of adjacent edges at the current vertex. A graph can be thought of as an intuitive map between related elements that could relate to direct interactions, correlations, or the notion of a discrete state space in which
each node describes the current state of some system and any adjacent vertices relate to the states that can be transitioned to. The concern of this thesis is the topological and structural properties underlying biological networks.
Beyond the definitions contained in this chapter, the terminology in this thesis is presented as and when the reader requires it. However, to aid quick reference, Table 2.1 displays common definitions with sections listed to aid comprehension.
2.2.1
Basic concepts
Formally, consider anundirected,unweighted graphGas a set of vertices V and edges E such that a pair of vertices iand j are considered to be connected if the tuple (i, j) is present in the set of edges E. By convention we will term the number of vertices in a graph as the cardinality of the vertex set n=|V| and the number of edges as the cardinality of the edge setm =|E|. Simultaneously, we consider the adjacency matrix of a graph A to be the n×n binary matrix representing Gsuch that Aij = 1 if vertices i andj are adjacent and Aij = 0
otherwise. Where a graph has edges that are non-equivalent, we consider this a weighted graph. In the case of a weighted graph, the elements of A can take on any real number.
In the case of directed graphs, or digraphs, we consider A to be non-symmetric and the order of (i, j) to be relevant. The direction of an edge indicates the available flow of information. If the link (i, j) is present within a digraph then information can flow from vertex ito vertexj, whilst if the vertex (j, i) is not present then no information can pass from j to i.
Node degree refers to the number of adjacent edges that a node has. We can consider the total degree of a node to beki = Pj∈V Aij or, in set theoretic
notation, as the cardinality of the set of edges containingi, ki =|{(i, j)|(i, j)∈
E}|. The set of edges adjacent to a given vertex is its neighbourhood. In the case of directed graphs we can consider in degree as the cardinality of the set of adjacent edges pointing to the node, and out degree as the cardinality of the set of adjacent edges pointing to other vertices.
comparing graphs in the presence of topological measures or summary statistics. We define the density of an undirected graph as,
d(G) = 2m
n(n−1). (2.1)
When d(G) is close to 1 the graph is considered dense, whereas graphs with density close to 0 are considered sparse. A similar calculation to density is the average node degree denoted by ˆk = 2m
n . Note that a hard definition of
“sparseness” depends upon the cardinality of the vertex set, in this case the values of the adjacency matrix are mostly zero. Almost all complex networks are considered sparse, and structural properties such as heterogeneity in the number of edges of each node often require sparse graphs [10].
A subgraph of a graph is any non-empty subset of the nodes and edges. A path, or walk, within a graph is any ordered sequence of vertices such that an edge exists between each vertex. The shortest path between two nodes is the path with the lowest cardinality; many such paths may exist. A graph is said to be connected if there exists a path between each pair of vertices. The largest connected component of a graph is the largest connected subgraph. An induced subgraph is a subgraph that contains a subset of verticies from V as well as all edges between them contained in the set E. An n-clique refers to anyfully connected graph or subgraph that contains an edge between all pairs of vertices.
A cycle is any closed walk such that the path starts and ends on the same node, with no repetitions of vertices in between. A tree is a form of acyclic graph, that is to say that without cycles there is one and only one path between each pair of vertices. Trees are both necessarily connected and contain exactly
n−1 edges, adding any edge to a tree will, therefore, introduce a cycle. We define a two star as a path containing any triple of nodes, of specific interest is the number of two stars a node is central to. The number of two stars a given node is central to can be defined as,
si =ki(ki−1). (2.2)
This is an important property when considering local and global network statistics such as the clustering coefficient [6], described in detail later.
Another important measure relating to networks is the mean shortest path length. The mean shortest path length is given by,
l(G) = 1
n
X
(i,j)∈V
sp(i, j), (2.3)
where sp(i, j) is the shortest path length between a pair of vertices. In Section 2.5.2, the notion of a small world network is discussed. In this context, the mean shortest path length is used to characterise a specific form of network.
2.2.2
Measures of topology
The following section summarises some of the important topological summary measurements that are used to characterise networks in this thesis. The reader is referred to a review [11] for a more comprehensive list of measurements.
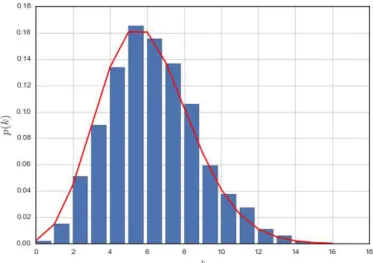
Degree distributions
The degree distribution is an important summary statistic that will be discussed at length in this thesis. For simple graphs, a histogram is sufficient to model the degree distribution, selecting a number of bins appropriate to the network size. However, many of the networks studied in this thesis follow heavy-tailed distributions, making it difficult to select an appropriate number of bins [12]. Consequently, the convention of the complementary cumulative distribution, which considers the probability that you will find a node with degree greater than a given value P(x≤k), is adopted. These are viewed on a log-log scale in order to easily differentiate between distributions. Further information on heavy-tailed degree distributions is provided in Section 2.5.1.
Clustering coefficients
A triangle is defined as the triple (i, j, k), such that the three nodes form a complete subgraph, sometimes termed a transitive closure. An elegant way of measuring this transitivity is the clustering coefficient [6]. The clustering coefficient of a node is given by,
Ci =
2ti
ki(ki−1)
where ti is the number of triangles containing node i. Where Ci = 1 we can
say that vertexi is in every possible triangle that it can be contained within, likewise whereki = 0 we can see thati is contained within no triangles. This
definition of the clustering coefficient is equivalent to the density of the induced subgraph of a node’s neighbourhood. It is conventional to measure the mean clustering for a given network C = N1 P
i∈V Ci against a random graph of
equivalent density. When considering the clustering coefficient, the convention used throughout this thesis is to ignore nodes with a degree of 1 as they are not central to two stars.
Vertex criticality
The notion that a vertex is critical to the structure and function of a network is captured by centrality measures [11]. The most commonly used measure is betweenness centrality [13] which measures the fraction of shortest paths through a given node as follows,
Bu =
X
i,j∈V
δ(i, u, j)
δ(i, j) , (2.5)
whereδ(i, u, j) is the number of shortest paths between vertices i andj that pass through vertexuand δ(i, j) is the total number of shortest paths between
iand j. The betweenness centrality calculation can also be applied to edges as Equation 2.5 allowsu to be an edge or a vertex. This is an approach used, for example, in the Newman-Girvan algorithm for detecting modular structure [14].
In order to measure the dependence the graph has on a small number of vertices, the central point dominance of a graph is defined by,
CP D= 1
n−1 X
i∈V
Bmax−Bi, (2.6)
WhereBmax is the maximum betweenness over all vertices. CP D is necessarily
in the range [0,1], a value of 0 indicates that the graph is highly decentralised and not dependent upon any small number of vertices. In contrast, where
CP D is close to 1, the network is highly dependent upon a small number of vertices with a high level of betweenness centrality.
2.2.3
Graph Laplacians
Spectral clustering is one of the oldest methods for partitioning graphs [15] and refers to methods that partition data according to using the eigenvectors of matrices. The approach taken with graphs is either to use the Laplacian or Normalised Laplacian of the graph rather than the adjacency matrix. The Laplacian of an adjacency matrix is given by,
L=D−A (2.7)
where D is defined as the degree matrix of A, that is to say D is a diagonal matrix such that Dii= ki, the degree of each vertex. We can then see that the
elements of L can be defined as,
Lij = ki if i=j, −1 if i6=j and Aij = 1, 0 otherwise. (2.8)
The normalised form of the Laplacian matrix is defined by,
L =I −D−12AD− 1 2, (2.9) where D−12 =diag{k−12 1 , k −12 2 , ..., k −12
n }. From the definition in Equation 2.9 we
can then see that the normalised Laplacian takes the form [16],
Lij = 1 if i=j, −√1 kikj if i6=j and Aij = 1, 0 otherwise . (2.10)
Conventionally, spectral methods use the eigenvectors of the graph as a pro-jection of the graph onto a metric space. This allows one to use conventional clustering approaches such as k-means clustering to partition the graph space. However, many of the approaches used within this domain do not lend them-selves well to complex, heterogeneous networks of the form we are interested in as they often assume properties such as roughly uniform cluster size [17, 18].
Whilst conventional spectral clustering is extremely limited in its application to large, heterogeneous sparse graphs found here, Fay et al. [16] summarised
the potential as a form of graph distance measure using the eigenvalues of the normalised Laplacian to characterise the structure of graphs. This approach is of little help to finding modular structure directly, but may have implications for finding appropriate models both with and without community structure. In Chapter 5 these distances are applied to fitting graphs models to empirical data.
2.3
Modules in biological networks
This section discusses the practical aspects of module discovery in biology, giving the reader some insight into the importance of modular structure. The idea of functional components is the basis of systems biology [3] and is at the heart of modern research. The extraction of meaningful biological functions promises to improve the understanding of living things through generating meaningful hypotheses about the co-regulation or common processes involved in biological systems. Integration of external data sources and multiple networks is a core aspect of modern bioinformatics [19], the focus of this thesis, however, is the discovery of structural modules from the topology alone.
This section is structured in terms of three classes of biological networks of interest to this study; gene correlation of expression (co-expression) networks, physical binary protein-protein interactions (PPI) and metabolic networks constructed from pathways of reactions. The limitations of these approaches cannot be understood without first understanding the objectives involved with these forms of study. This section reviews the methods of construction within these networks before discussing some exemplary studies into how modules have aided biological knowledge. This gives a grounding in the biological relevance of these modules, but is not a technical review of the function of the algorithms used. Following on from this section, Section 2.4 provides a review of the practical, computational approaches for finding modules in complex networks. This is, by no means, an exhaustive study of networks that apply to biological forms. Neural networks [20], Gene Regulatory networks [21] and many other forms of network are actively studied, and many of the methods discussed in this section have applications beyond those studied here [2].
Symbol Description Definition
G Graph, collection of vertices and edges. Section 2.2.1
V Set of Vertices. Section 2.2.1
E Set of edges. Section 2.2.1
m Number of edges. Section 2.2.1
n Number of nodes. Section 2.2.1
A Adjacency matrix. Section 2.2.1
Aij Binary variable for adjacency of two vertices. Section 2.2.1
ki Degree of node i. Section 2.2.1
ˆ
k Average node degree. Section 2.2.1
d(G) Graph or subgraph density. Section 2.2.1
l(G) Mean shortest path length. Section 2.2.1
Ci Clustering coefficient of node i. Equation 2.4
C Network average clustering coefficient. Section 2.4
Bu Betweenness centrality of edge or vertex. Equation 2.5
CP D Central point dominance. Equation 2.6
P Partition of a graph. Section 2.4.1
C Set of communities or modules. Section 2.4.1
Q Observed Modularity of a partition or graph. Equation 2.11
Qmax Maximal modularity partition of a graph. Equation 2.11
r Degree assortativity coefficient. Equation 2.26
N M I Normalised mutual information. Section 3.3.1
2.3.1
Protein-Protein interaction networks
If proteins are considered the mediator of biological action acting as part of complex signalling mechanisms, catalysing metabolic reactions and performing fundamental cellular processes like transcription, then their interactions surely determine much of the functional nature of biology. This whole scale, bottom up approach characterises a goal of systems biology and is often referred to as the interactome [22]. The objective of this line of study is no less than characterising every molecular interaction that occurs within an organism.
The scale of these networks is vast, for example, a recent study into the human interactome has experimentally collected 30,000 interactions between 14,000 proteins and this is only around half of the total interactions expected [23]. If one gene coded a single protein, the human interactome would contain over 20,000 proteins. Splice variants of DNA and potential post translational modifications greatly increase this number [24]. If one were to test this many interactions it would require 200 million protein pairs to be combined to generate a binary map.
As a consequence, the use of high throughput technology such as Yeast 2-Hybrid (Y2H) [25] and Tandem Affinity Purification (TAP) mass spectrometry [26] are required to generate large scale datasets. Y2H assays are based on modified yeast strains to indirectly measure the interaction of proteins. Given two proteins of interest protein x and protein y, x would be treated as bait protein and fused with the DNA-binding domain (BD) of a transcription factor, whilst y the “prey” protein is fused with the activating domain (AD) of the transcription factor. Only when the proteins interact is the AD in close enough proximity with the BD for a reporter gene to be expressed, thus giving a binary measure of the interaction between proteins.
A huge limitation of the protein interaction networks is that the collection methods are prone to error, reporting both false negatives and false positives. For example, most Y2H interactions are only published if verified by other sources [27]. In 2002 Von Meringet al. [28] concluded that the accuracy rate from high throughput experiments was as low as 20%. Whilst development in this regard has improved, Huang and Bader [29] still concluded that false
discovery rates and false detection rates are very high. The solution to this problem may lie with improved mechanisms for the collection of data, but until this occurs methods that model and validate mechanisms for biological network discovery are required. Despite limitations Y2H and TAP have been applied to map many of the protein-protein interactions of many organisms as highlighted by nearly 15 years of development [4, 30–32].
An alternative approach to building large scale interaction networks is to use online resources such as STRING [33] and BioGRID [34]. These databases store a wealth of literature-curated protein interactions and constantly grow in size. These resources also provide convenient programmatic APIs that allow the integration of datasets into reusable informatics tools as well as aiding the enrichment of gene sets and aiding error collection. However, TAP-MS and Y2H datasets have been shown to be far more reliable than literature curated networks. The work of Venkatesan et al.[35] highlights that methods that use approaches such as gene ontology should not assume that these attributes are free from bias. Indeed, in less well characterised organisms, much of the data regarding interactions appears to be highly erroneous, making it difficult to use for validating the TAP-MS and Y2H methods discussed above.
Modules in interaction networks
The manner in which proteins interact characterises the function of living things. The notable first work into detecting groups of functionally related proteins in complex networks is that of Spirin and Mirny [36]. It is natural to be drawn to the idea of a clear group of proteins that bind together at a specific point to form a molecular machine. For example, RNA splicing requires a number of proteins to act as a singular macro-molecule.
Alternatively, one can consider a cluster of proteins that form aspects of a functional process, these proteins interact but at different time scales. For example, protein kinases involved in signal transduction will interact with one another, but their expression will be controlled by environmental or metabolic processes. From the perspective of interacting groups in a binary map, the time delay is not encoded information and so both functional processes and complexes will be detectable in a similar manner. In the case of functional
modules, protein interaction networks offer insight into the function of biological processes that may take place over long time scales making it difficult to directly generate hypotheses from conventional lab based methods. By detecting these groups in binary interaction maps, hypotheses about functions over extremely long time scales can be generated, highlighting the potential of module detection approaches.
The authors of [36] developed a method for uncovering modules based on the betweenness centrality of proteins which proved effective at the time. However, there has been extensive development in both algorithms for detecting modules [8] and datasets [4, 31, 32]. As a consequence, hierarchical and overlapping approaches have been developed and applied in more recent studies [37].
The work of the Arabidopsis Interactome Mapping Consortium produced an accurate interaction network which was developed with Y2H [4]. To date, very little further work has been conducted into plant protein interaction networks due to the difficulty of applying TAP-MS [38], making the Arabidopsis interactome a valuable source of information for plant biology. In [4], edge clustering [37] was applied and discovered a number of experimentally verified modules such as those related with signalling pathways in barley [39].
2.3.2
Correlation of expression networks
Microarrays output a gene expression profile for tissue under some experimental condition. Many gene or whole genome analysis is possible depending on the specific probe sets available [40]. Microarrays work by laying down a number of probes that match RNA or DNA sequences through hybridisation; i.e. a probe is a specific complementary sequence of DNA or RNA that matches all or part of a gene transcript. Each probe will be within a certain area and the number of molecules that a probe matches can be counted (e.g. through florescent dye produced as a result of hybridisation). Design is a key issue with these experiments as data can often be noisy or prone to sample bias and, as a result, appropriate statistical procedures need to be developed before an experiment to give a normalised view of expression levels [40].
of gene expression data, they are fast being replaced by the use of high accuracy RNA sequencing (RNA-seq) [41] techniques that do not require a whole genome to be sequenced, eliminate bias associated with probes and offer improved accuracy. Rather than matching genes through hybridisation, which often introduces bias to experiments, RNA-seq matches sequences, meaning a fully sequenced genome is not required. Fundamentally, however, both technologies measure tissue and time specific genome wide expression levels [42].
Due to the developments in transcriptomics that allow the analysis of the entire transcriptome, methods such as correlation of expression networks are a popular method for the analysis of datasets. Here, gene expression levels are measured at either different time points, or in different environmental conditions. A correlation matrix is generated based on the expression profiles of each gene [22]. This can be converted into a graph by selecting a correlation score threshold which can nominally be a specific level of confidence. For example, the correlation threshold for which 95% of potential interactions are excluded (p < 0.05). An alternative method for selection could be basing it on some topological feature that is wished to be observed, for example, in the work of Bassel et al. [43] the threshold was selected because this maximized a power law distribution for the network. Alternatively, this could be a rank of the top N co-expressed genes or a threshold based on particular genes of interest [44]. The selection of the correct correlation threshold for a given network is a balancing act between removing spurious edges that limit the analysis of data and maintaining enough information such that some network inference can be conducted.
It is important to point out that, where correlation networks are concerned, an edge does not indicate a direct interaction between genes. To establish a causal link one must provide evidence in support. Correlation networks work under the “guilt by association” principle; when genes are expressed in the same tissue at the same time across multiple samples in response to similar stimuli it is likely that they are related [44].
The study of SeedNet by Bassel et al. [43] highlights the potential to use genome wide expression data to elucidate biological function. Here, the authors collected multiple microarray experiments of publicly available data
from different sources in order to investigate seed germination. A co-expression network was then created and clusters were generated through agglomerative hierarchical clustering of the microarray data. Combining previous experimental data showed a clear relationship between clusters and genes known to be associated with germination and non-germination. This use of known data should be considered exemplary in the analysis of this form of data as it generates the hypothesis that unknown genes within associated clusters are likely to influence or be influenced by the same regulatory processes.
The idea of a module in a correlation of expression network relates to the notion of co-regulation and relates strongly to the notion of “guilt by association”. The general formulation is that, if a group of genes have a similar expression pattern over a time course or set of experiments, they should form a dense cluster. These clusters then form a hypothesis that the genes contained within are regulated by the same transcription factor or transcription factors. In Chapter 3 the analysis of topological clusters is conducted on SeedNet, two further Arabidopsis datasets and a Tomato Fruit Ripening Network. This includes combining external data sources, such as gene knockout experiments, to aid the understanding of these clustered groups.
2.3.3
Metabolic Networks
Metabolic networks are crucial to the understanding of biological systems. At any given time, a huge number of metabolic interactions occur within living cells, this can be characterised by the transformation of metabolites into substances that are useful to biological organisms, normally catalysed through the use of enzymes. One can represent these networks as directed networks between reactants and products [45] or, in a similar vein to the correlation of expression networks described above, the relative level of expression of metabolites at given time points can be used to form an undirected edge under the “guilt by association” principle [46]. Databases such as KEGG [47], WikiPathways [48], EcoCyc [49] and MetaCyc [50] store various amounts of metabolic interaction data for organisms including low level pathways and full organism metabolic maps. In this work, metabolic networks are treated as sets of metabolites that
share an edge if they are linked by a reaction. Extremely common so called “currency” metabolites, such as ADP or H20 are generally removed. This is a common approach taken that sacrifices much of the complexity of the system in order to simplify analysis [22].
A major work in the analysis of large scale metabolic networks came at the turn of the century with the Work of Jeong et al. [51]. Here the authors discussed the “scale-free” nature of the networks, referring to the extreme heterogeneity of node degree (a topic discussed in Section 2.5.1), though little attention was paid to the specific modular structure. Later, work by Ravasz et al.[52] was conducted into the hierarchical organisation of metabolic networks by proposing a model in which networks form dense modular structures. Many of theses detected structures correlate strongly with known groups of pathways, indicating the value of uncovering modular structure.
Flux balance analysis [53] is a widely used tool that uses metabolic network models to calculate steady-states of biological systems, with respect to metabo-lites present at any given time. However, more precise analysis of enzyme kinetics is often limited when dealing with large scale complex networks and requires breaking networks down into smaller sub components that can be modelled and experimentally validated. This can be achieved through first hand expert knowledge, however, as datasets grow in size the combinatorial explosion makes automating the discovery of meaningful modular components a necessary step for this form of analysis [22].
The work of Guimera and Amaral [54] highlights one of the best early examples of applying module detection algorithms to complex metabolic net-works. By applying modularity maximisation to 12 metabolic networks from different species, the authors were able to create what can be described as a functional cartography. The role of nodes within the network can be associated with inter-modular communication or intra-module function. This is done by computing two measures, the within module degree and the participation coefficient.
Comparing nodes by their level of participation within a modular structure allows the creation of several broad groups; nodes that are peripheral and contain all or most of their edges inside their own module, inter-module connectors
that are either hubs or non-hubs, “provincial” hubs that have most of their edges within their own module, and “kinless” hubs and non-hubs that have connections largely between communities. A common problem with much of the historical analysis of metabolic networks has been the limitation of modularity based algorithms [14] that do not allow overlapping vertices. More recent methods of community detection have moved into the discovery of overlapping modules [37], which is a distinctly different problem. Further details on specific methods for module detection are discussed in Section 2.4.
Aside from the numerical analysis, the annotation of functional modules through mapping them to KEGG pathways [47] shows a good example of how clustering, combined with visualisation, can be used to relay information from computational studies to domain experts. The use of modules as a form of visual “map” is a topic that merits further discussion and is explored in the next section.
2.3.4
Visualisation of biological networks
The need to make sense of large scale networks is of great interest to systems biology research [55]. The objective of network visualisation tools should be to present complex data in an intuitive fashion that allows interpretation. Specifi-cally, visualisations need to focus on hypothesis generation, aiding experimental design [56].
The conventional “Hairball” forms of force direct layouts [57] are often found in publications. This way of viewing data does not help knowledge discovery. Alternative approaches of visualising data attempt a cluster based approach. For example, the OpenOrd layout [58] improves on conventional force directed layouts and ignores edges over larger distances. Figure 2.1 contrasts these two methods highlighting the difference between these approaches.
However, an aesthetically pleasing visualisation is only useful if it conveys meaningful information. For this to occur, the network visualisation must be based on a meaningful set of clusters and integrate external sources of information. Numerous software packages exist with regards to integrating visual information, such as Pajek [59] and ONDEX [60]. Perhaps the most
(a) Fruchterman-Reingold (b) OpenOrd
Figure 2.1: Examples of Fruchterman-Reingold and OpenOrd “hairball” visualisations of the Arabidopsis Protein-Protein interaction network taken from BioGRID [34].
popular tool of all is Cytoscape [61]. Cytoscape has the appealing aspect that a huge number of plugins are available [62] which allows integration of other sources of information such as gene ontology [63]. ONDEX [60], is an interesting approach to integrating different sources of information. The objective here is to combine experimental data from a number of sources such as KEGG [47], Transpath [64] and AraCyc [65]. Combing external information not only aids interpretation of datasets, but crucially, allows the generation of hypotheses.
In terms of displaying clusters, many approaches to the visualisation in-volve grouping nodes together by common shared attributes or topology. For example, the clusterMaker [66] Cytoscape plug-in allows users to cluster genes into relevant groups. This approach makes annotation easier and allows the researcher to investigate large scale, macro level interactions between functional groups.
In Chapter 3, a web visualisation of a Tomato fruit correlation of expression network is presented that uses the clustering algorithm found within the OSLOM module detection tool [67] in order to group related vertices. Whilst not so much a limitation of this approach as with the underlying clustering process, grouping nodes together requires one to trust the accuracy of module detection algorithms. The following sections go into more detail with regards to these limitations, but it must be stated that any visualisation that uses this approach
should be treated with a healthy degree of scepticism.
2.3.5
Discussion of biological modules
It is clear that the idea of detecting clusters within networks is an important goal within systems biology. This has been the focus of understanding biological systems, made up of thousands of genes and potentially millions of interaction, for around over a decade [3]. In this section, we have looked at some exemplary studies that have focused on the functional biological modules in protein interaction and metabolic networks as well as strongly co-expressed genes that aid data analysis. Modules also offer an interesting approach to visualising large scale data, offering a way to tame the unruly “hairball”. Much of this work, however, relies on experimental validation and combining other sources of information such as gene ontology. Whilst often extensive, the granularity and inaccuracy of information appears to be a problem, computational approaches offer opportunities to solve these issues [68]. In Chapter 3, it is shown that when moving from a well studied organism like Arabidopsis to a less well researched one like the Tomato, the gene ontology becomes significantly less reliable. Different approaches will likely give different results and more focus on understanding the assumptions relating to the formation and detectability needs to be considered.
There are several competing hypotheses for the origins of modular organisa-tion within protein interacorganisa-tion and metabolic networks. One such hypothesis is that the modular organisation is a result of natural selection optimising for the minimum number of links [69]. The argument here is that maintaining redundant links is not beneficial and, gradually, modular structure emerges due to its efficiency. Gene duplication models [70, 71] offer the alternative hypothe-sis that biological systems evolve by a process of copying, with these models appearing to create higher modularity than one would find by chance [72]. This hypothesis argues the modules are simply a by product of the process of gene duplication rather than modularity being specifically selected for. However, recent work has found that the existing gene duplication models may not be the best representation of real world protein interaction networks [73].
Whilst there is debate in the literature about the underlying cause for modularity in networks, there is clear evidence for modular structure in protein interaction and metabolic networks [52, 72, 74], and these modules are known to relate to functions. Uncovering these modules is a problem in computational biology and determining modular function is a vital aspect of systems biology. Detecting modules in networks is a purely hypothetical act and experimental validation must be completed in order to test hypotheses, a process vastly more time consuming than computational analysis. Section 2.4 now moves on to the technical aspect of detecting communities in large, complex networks.
2.4
Methods for module extraction
Despite the volume of literature and the number of algorithms related to the subject, there is still no widely agreed upon definition of what a module or community is [8]. The most commonly adopted assumption is that a community is a group of nodes that is more densely connected internally than externally. Thas has led to the definition of both overlapping and non-overlapping network structures. Approaches such as Infomap [75] and Modularity maximisation [14] find a single module for each vertex, whilst clique percolation [76] and Link communities by Ahnet al.[37], cluster vertices into more than a single group. In this section, we briefly discuss the competing definitions for modular structure before reviewing some of the popular methods for uncovering modules in large scale complex networks.
2.4.1
Covers and Partitions
There are two formal definitions of the block structure in networks, partitions and covers. A partition is a set of clusters or communities on the vertex set
P(V) ={c1, c2, ..., cn}such that each node is contained within one and only one
community. Each community has the condition that it must be an internally connected induced subgraph of G. An equivalent definition of a partition is a cut set on the edge set E. In the definition of a partition, each edge is either inside an induced subgraph c, or lies between two such subgraphs. We then define a cut set as a proper subset of E, on the condition that for each cycle
within G if an edge within the cycle is inside the cut set, there must be no path between the nodes that it connects. In practical terms, this means that for every cycle either two or more edges are contained within the cut set or no edges are included. Whilst some focus has been paid to the attention of the relationship between cycles and modular structure [77], this is an an area that is certainly open to further exploration. Furthermore, there has been no formal explicit association between cut sets, cycles and partition based methods. Another implication for the use of cut sets in partition based methods is that it demonstrates that the search space for any objective function is no larger than 2m possible partitions.
Covers refer to overlapping modular structures. A cover is, again, a set of clusters that form internally connected induced subgraphs of the parent graph,
C(V) ={c1, c2, ...cn}. The distinction between a partition and a cover is that
a vertex can be the member of many modules in a cover based approach. The above definition could be considered a crisp definition of a cover in which a node is either a member, or not, of a given cluster. We also encounter a so called fuzzy definition of a community in which a node has a degree of membership to a given cluster e.g. µc(i)∈[0,1] such thatPc∈C(V)µc(i) = 1 [78].
Figure 2.2 visually shows covers and partitions.
Figure 2.2: Example of a partition (left) and cover (right). The central overlapping node could be considered to be contained within two communities.
The remainder of this section discusses a number of methods for uncovering global modular structure in large graphs. This is broken into broad subsections: modularity based methods [14], information theoretic approaches [75], the OSLOM algorithm [67] and methods based on the propagation of messages in a simulation [79]. This is, by no means, a comprehensive study of the algorithms and approaches for module extraction. For a more detailed view, the reader is
referred to a recent review [8]. Instead, the following sections aim to give the reader a practical grounding in the methods used in Chapters 3 and 6.
2.4.2
Modularity
Newman and Girvan proposed a measure of modularity [14] for any given partition of a graph. Modularity can be seen as both the measure of the quality of any partition in the set of all possible partitions and for the overall modular structure of a graph. Here, the partition quality function, Q, is defined under the condition that a null model graph has no community structure.] The null model is based on the probability of two vertices forming an edge in a null model that preserves degree and assumes that there is no increased probability for subsets of vertices to form edges. More formally, under the null model two nodes i, j are assumed to connected with the probability kikj
2m where ki is the
degree of vertex iand m= |E|the total number of edges in the graph. This is identical in form to the Chung Lu model described in Section 2.5.3. Formally, the quality function is given by
Q= 1 2m X i,j Aij − kikj 2m δ(ci, cj), (2.11)
where the binary variable Aij = 1 when there exists and edge (i, j) and 0
otherwise, ci is the community in which i is placed inside and the function
δ(u, v) is the Kronecker delta, δ(ci, cj) = 1 if ci =cj and 0 otherwise.
A more convenient form of equation 2.11 can be found in [80],
Q(P) = X c∈P " mc m − P i∈cki 2m 2# , (2.12)
where c∈P is the induced subgraph community within a given partition of a graph and mc is the number of edges in c. We refer to Qmax as the maximal
modularity observed in a graph which can be seen as a summary statistic of a network’s topology. An edge only contributes to modularity if it is inside a community. Consequently, the modularity score will be higher for partitions with more edges inside communities than between them.
There are a huge number of heuristic based algorithms for finding the partition with maximal modularity. Approaches such as simulated annealing
[81], agglomerative methods [82] and genetic algorithms [83] have been tried. The work of Brandes et al. [80] discusses the difficulty of the problem and showed that it is NP-Complete, meaning that there is no polynomial time algorithm to maximise modularity in every instance unlessP =N P.
Figure 2.3: Modularity landscape of the E coli metabolic network [54] showing 3708 sampled partitions. Distance between partitions is calculated using variation of information [84] and dimensionality reduction is performed using curvilinear component analysis [85]. The inset (top) demonstrates the landscape of the high modularity region. Figure generated with the software of Good et al. [81].
In the excellent work of Goodet al.[81] the modularity landscape of several real world graphs is explored, demonstrating the extreme difficulty of this problem. The search space for modularity optimisation is highlighted in Figure 2.3, which shows the modularity scores of 3708 partitions of anE coli metabolic network [54] (used in Chapters 6 and 5) with distances calculated using a measure of the mutual information between partitions [84]. The dimensionality of the search space is then reduced using curvilinear component analysis [85] to allow visualisation. Note that thex andy axes are unlabelled as curvilinear component analysis is a reduction in space that has no natural interpretation. The top inset of the figure is the search space of the partitions with high values of modularity, and lacks a clear, singular peak. In other words, there are a large number of locally optimal partitions very close to the global optima in terms of modularity score, but very distant from one another in terms of the
mutual information shared between partitions. In Chapter 3, we explore the mutual information between different module extraction approaches applied to correlation of expression networks highlighting the difficulty in algorithm selection.
This “glassy” search space creates issues for heuristic algorithms, as it is likely that they simply find one of many potentially high valued solutions that is not the global optima. Furthermore, modularity is known to have a resolution limit [86] in that small communities are hidden in the presence of large communities. Given this search space, it is extremely difficult to argue that a given global optima is the “correct” partition for empirical data. The locally optima solutions vary over such a large scale of the search space whilst still retaining modularity scores that are very close to the globally best solution. Good et al. also go onto speculate that this search space is not unique to modularity but, rather, potentially present in all optimisation problems of this form [81], though further analysis of this is required.
Bagrow addresses another issue with modularity, in that trees (i.e. acyclic graphs) appear to have extremely high levels of modularity [87]. One can consider that a tree has high levels of modularity because any partition of the space will likely compare favourably to the null model found in Equation 2.11. A key aspect of this result is that when assessing the significance of modular structure the density of the graph is important. High values of modularity do not indicate the presence of modular structure on their own, the reported value must be made in comparison to the null model.
This does not mean that modularity is not a well reasoned approach to detecting communities. Indeed, the original algorithm presented by Newman and Girvan [14] used modularity as a method of choosing a point to cut the dendrogram generated by hierarchically clustering nodes based on betweenness centrality.
A recent approach to community detection uses a, so called, message passing algorithm in order to explore the landscape of modularity, rather than just optimising to find a single solution [88]. The results reported within this work suggest that an approach of using multiple high value partitions will likely yield successful and meaningful results. The approach of using a consensus of good
![Figure 2.1: Examples of Fruchterman-Reingold and OpenOrd “hairball” visualisations of the Arabidopsis Protein-Protein interaction network taken from BioGRID [34].](https://thumb-us.123doks.com/thumbv2/123dok_us/778889.2598505/37.892.156.683.107.407/examples-fruchterman-reingold-openord-hairball-visualisations-arabidopsis-interaction.webp)