http://www.sciencepublishinggroup.com/j/ogce doi: 10.11648/j.ogce.20170502.11
ISSN: 2376-7669(Print); ISSN: 2376-7677(Online)
Optimization of Weight on Bit During Drilling Operation
Based on Rate of Penetration
Mehaysen Ahmed Al-Mahasneh
Chemical Engineering Department, AL-Huson University College, AL-Balq'a Applied University, Irbid, Jordan
Email address:
[email protected], [email protected]
To cite this article:
Mehaysen Ahmed Al-Mahasneh. Optimization of Weight on Bit During Drilling Operation Based on Rate of Penetration. International Journal of Oil, Gas and Coal Engineering. Vol. 5, No. 2, 2017, pp. 13-18. doi: 10.11648/j.ogce.20170502.11
Received: January 31, 2017; Accepted: February 13, 2017; Published: March 15, 2017
Abstract:
Drilling optimization is very important during drilling operation, to save time and reduce cost of operation thus increases the profit. Drilling optimization aims to optimize controllable variables during drilling operation such as weight on bit and bit rotation speed for obtaining maximum drilling rate. In this study had been selected the effects of several parameters during drilling operation. Important parameters such as depth, density, bit weight, rotary speed per minute, efficiently cuttings transported hole is to take into account the factors given in Table 3. It was concluded that average annular fluid velocity is between 414.17 to 581.24ft/min, dominating parameter on cuttings transport, the higher the flow rate. s Another important factor is the mainly the rheological properties of the drilling fluid such as Vis=45-50 s, p.v=12, PH=10, mud weight is between 8.57 ppg to 8.74 ppg. The rate of penetration for the field data had been calculated for several data points. Although the weight on bit has increase from 6600 until 19800 lbs, 1137.41 lbs/in, rate of penetration still in the range of 11.74 ft/hr. The optimized bit weight is 13200 lbs or 1077.55 lbs/in during drilling operation, penetration rate for depth 4330.02 ft is suitable due to formation that is may be high in strength.Keywords:
Drilling Operation, Weight on Bit, Rate of Penetration, Optimization1. Introduction
Development of oilfield is subject to drill in cost efficient manners (Tuna, 2010) [1]. For that reason oilfield drilling operations will face hurdles to reduce overall costs, increase performances and reduce the probability of encountering problems. In oil well drilling drill ability of rock is noticed to decrease with increasing depth of the hole (Garnier and van Lingen, 1959) [2].
The increase in complexity for drilling operation has increase many problems thus results in critical cost consideration (Saleem et al., 2011) [3] as the drilling rate is affected significantly by changes in differential pressure (Vidrine and Benit, 1968) [4].
Different methods from different disciplines are being used nowadays in drilling activities in order to obtain a safe, environmental friendly and cost effective well construction (Tuna, 2010) [5].
Optimization of drilling operation can be obtained by increasing drilling speed (Moses and Egbon, 2011) [6]. In the drilling industry, the first well drilled in a new field generally
will have the highest cost. With increasing familiarity to the area optimized drilling could be implemented.
Those decreasing costs of each subsequent well to be drilled until a point is reached at which there is no significance improvement. Major drilling variables considered to have an effect on drill in mathematical models which attempted to combine known relations of drilling parameters.
The proposed models worked to optimize drilling operation by mean of selecting the best bit weight and rotary speed to achieve minimum cost. Considerable drilling cost, weight on bit, rotary speed, bit tooth wear and hydraulics. Secondly, is to predict rate of penetration vs. depth for the filed. Data, to determine optimize value of weight on bit specifically for certain depth in order to have an optimum drilling operations.
penetration vs. depth for the filed base, to determine optimize value of weight on bit specifically for certain depth in order to have an optimum drilling operation. achieved by means of used sing the available mathematical models (Irma, 2009) [7].
2. Factors Affecting Penetration Rate
The penetration of bearing wear is much more difficult than the prediction Of tooth wear. Like tooth wear, the instantaneous rate of bearing wear depend on the current condition of the bit. After the bearing surfaces become damaged the rate of bearing wear increase greatly. However, Since the bearing surfaces cannot be examined readily during the dull bit evaluation, a linear rate of bearing wear usually is
assumed. Also, bearing manufactures have found that for a given applied force the bearing life can be expressed in terms of total evaluations as long as the rotary speed is low enough to prevent an excessive temperature increase. Thus, bit bearing the usually is assumed to vary linearly with rotary speed [8]. The three main types of bearing assemblies used in rolling cutter bits are nonsealed roller, sealed roller, and sealed journal. The price of the bit is lowest for the nonsealed roller and highest for the sealed journal.
The rate of penetration achieved with the bit, as well as the rate of bit wear, has an obvious and direct bearing on the cost per foot drilled. The most important variables affecting operating conditions bit weight and rotary speed bit tooth wear, and bit hydraulics.
Table 1. Field Data from (Risha Field).
No Depth (ft) Bit type Drilling rate (ft) Total hrs W. O. B lb RPM ROP
1 1899.6 -1341.9 S84F 557.7 19.5 15400 100 28.6
2 2345.9 -1899.6 S84F 413.4 30.5 17600 100 13.56
3 -3182.572345.9 1x 836.6 57 19800-15400 100 14.67
4 3468.0-3182.57 S84F 285.4 13 11000 100 21.9
5 -3468.0 3543.48 S86F 124.6 7 19800 90 17.7
6 3543.48-3589.4 S86F 59 5 19800 80 16.4
7 3589.4-3668.15 S44 301.85 24.5 19800 80 12.32
8 4071.72–3891.6 M4N 180.45 16.5 19800 90 10.93
9 4253.15 -4071.7 S44 181.45 10 19800 100 18.14
Figure 1. The Effect Of Bit Loading at depth 4253.15 ft.
Figure 1 shows the prediction of rate of penetration using the actual rate of penetration taken from the drilling report. In the graph, it shown that for data number 2, 3, 7, 8 the value of predicted rate of penetration is not accurate. This is because during the statistical analysis that was performed, the
Table 2. Wells Summery Information.
Well name Well 1 Well 2 Well 3
Well Total depth, ft TVD 8711.053 8934 3125
Total depth, ft MD 9655.98 9655 3366
Trajectory Deviated Deviated Deviated
RT elevation,ft 3016.87 3016 831.5
Drilling Unit type National & IDECO National & IDECO National & IDECO
Drilling time days 52.65 75.6
Hole Section,In 171/2 121/2 81/2 6 6 81/2 121/4 171/2 26 121/4 81/2 6
Hole section Inclination, degree 0.25 1.5 66.7 89 86.54 39.48 1.5 - - 1.25 36.98 44
Hole section Depth,ft 1251 43330 8799 10016 8934 8760 4216 36 156.5 4193.11 8409.2 10253.12
Casing Size,In Feb-41 7 9 5/9 133/8 Feb-41 7 Aug-95 - 20 9 5/8 7 -
Casing shoe depth,ft 9954 8796 4327 1213 8930.8 8750.4 4209.5 - 154.2 4189.83 8405.92 -
Drilling Fluid type KCL KCL WB. M Spud KCL KCL W. B. M W. B. M W. B. M W. B. M KCL. polymer KCL. polymer
Drilling fluid Max density,ppg 8.57 10.82 8.74 8.57 8.57 10.91 8.57 8.57 8.57 8.58 10.45 8.57
KOP,ft 7874 8202.5 - - 7710.35
2.1. Factors Affecting Rate of Penetration
Environmental factors on the other hand are not controllable such as formation properties, drilling fluids requirements.
The reason that drilling fluid is considered to be an environmental factor is due to the fact that a certain amount of density is required in order to obtain certain objectives such as having enough overpressure to avoid flow of formation fluids.
2.2. Another Important Factor
Another important factor is the effect of the
overall hydraulics to the whole drilling operation which is
under the effect of many factors such as Lithology, type of the bit, down hole pressure and temperature conditions, drilling parameters and mainly the rheological properties of the drilling fluid. Rate of penetration performance depends and is a function of the controllable and environmental factors.Ozbayoglu et al. 2004 [9], conducted extensive sensitivity analysis on cuttings transport for the effects of major drilling parameters, while drilling for horizontal and highly inclined wells. It was concluded that average annular fluid velocity is the dominating parameter on cuttings transport, the higher the flow rate the less the cuttings bed development. One of the most important considerations in order to have an efficiently cuttings transported hole is to take into account the factors given in Table 3. [10, 11, 12].
Table 3. Factors for efficient hole cleaning.
1 Hole angle, degree 1.25 to 1.50
2 Fluid Velocity, ft/min, for three wells 414.17 to 581.24
3 Fluid Properties (rheological properties and density)
Vis=45-50 s, p.v=12, PH=10, 8.57ppg, 8.74 pg
4 Cuttings Size, shape, and concentration
Coarse medium and fine grained
5 Rate of pipe rotation and pipe
eccentricity 80, 90, 100, 125
6 Fluid flow regime (laminar or
turbulent) Turbulent flow
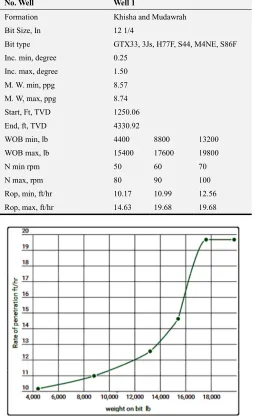
Table 4. Performed data runs for Well-1 12 ¼” Hole Formation KHISHA and MUDAWRAH.
No. Well Well 1
Formation Khisha and Mudawrah
Bit Size, In 12 1/4
Bit type GTX33, 3Js, H77F, S44, M4NE, S86F
Inc. min, degree 0.25
Inc. max, degree 1.50
M. W. min, ppg 8.57
M. W, max, ppg 8.74
Start, Ft, TVD 1250.06
End, ft, TVD 4330.92
WOB min, lb 4400 8800 13200
WOB max, lb 15400 17600 19800
N min rpm 50 60 70
N max, rpm 80 90 100
Rop, min, ft/hr 10.17 10.99 12.56
Rop, max, ft/hr 14.63 19.68 19.68
Table 5. Performed data runs for Well-1 12 ¼” Hole Formation KHISHA and MUDAWRAH.
No. Well Well 2
Formation Khisha and Mudawrah
Bit Size, In 12 1/4
Bit type HP53AJ, H77F, S86F
Inc. min, degree 0.7 5
Inc. max, degree 1.50
M. W. min, ppg 8.57
M. W, max, ppg 8.74
Start, Ft, TVD 36. 09
End, ft, TVD 4216.06
WOB min, lb 15400 17600 19800
WOB max, lb 22000 24200 26400
N min rpm 80 80 90
N max, rpm 90 90 100
Rop, min, ft/hr 5.90 7.21 7.87
Rop, ma x, ft/hr 8.53 9.51 11.81
Figure 3. The Effect Of Bit Loading at depth 4216.06 ft.
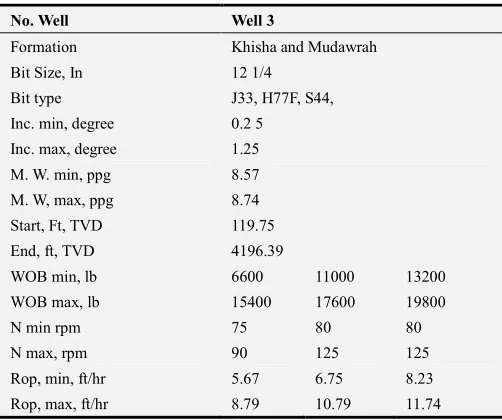
Table 6. Performed data runs for Well-1 12 ¼” Hole Formation KHISHA and MUDAWRAH.
No. Well Well 3
Formation Khisha and Mudawrah
Bit Size, In 12 1/4
Bit type J33, H77F, S44,
Inc. min, degree 0.2 5
Inc. max, degree 1.25
M. W. min, ppg 8.57
M. W, max, ppg 8.74
Start, Ft, TVD 119.75
End, ft, TVD 4196.39
WOB min, lb 6600 11000 13200
WOB max, lb 15400 17600 19800
N min rpm 75 80 80
N max, rpm 90 125 125
Rop, min, ft/hr 5.67 6.75 8.23
Rop, max, ft/hr 8.79 10.79 11.74
Figure 4. The Effect Of Bit Loading at depth 4196.39 ft.
3. Results & Discussion
The results for different optimization runs are as summarized in the following sections. The runs were individually performed for the same formation types, and provided that the data were belonging to equally sized bit diameters.
3.1. Presentation of the Results
The details for the formations Lithology description limestone white, dolomite medium to hard, sandstone partly coarse grained, clay stone with shale, sandstone fine to very fine grained medium to hard siliceous cemented. Sandstone soft plastic with siltstone medium hard, with streaks of shale dark grey, siliceous cemented, sandstone white light grey, medium grained to fine, micaceous siliceous cemented at Risha member (Unit I, II, III), and the actual formation tops.
The parameters those of which could be collected from a drilling activity are as listed in Table 3. Each parameter to be collected from the rig site is going to have an impact to the overall optimization process.
Data reliability and accuracy is very important, all of the data collecting sensors should be accurately calibrated and be signaling the correct magnitude of measurement.
3.2. Factors Affecting Rate of Penetration
Performed data runs for Well-1, 12 ¼” Hole, Formation Khisha and Mudawrah.
The details of the performed data runs are as summarized in Table 5 such as wellbore deviation is between 0.25 to 1.75 degrees, the minimum drilling fluid density is 8.57 ppg and the maximum drilling fluid density is 8.74 ppg, the weight applied to the bit and the rotation speed. The given dataset are belonging to Well.1 and Khisha & Mudawrah Formation. The bit type in use was a milled tooth in type H77F, J33, HP53GX, and insert in type S86F, S44.
The general operating parameters for minimum weight on bit magnitudes are between 4400, 8800, 13200 lb. and the maximum weight on bit are 15400, 17600, 19800 lbs, and 50 to 100 rpm for rotary speed [10, 11].
4. Rate of Penetration
Optimization of drilling operation can be obtained by increasing drilling speed (Moses and Egbon, 2011, 2012) [6]. After obtained the data, the rate of penetration was collocated from the field data. In Figure 2 shows the rate of penetration, using the actual rate of penetration taken from the drilling report. In the graph, it shown that data the value of penetration rate. However, as more data were obtained, the values of rate of penetration become more accurate. This data is shown in Figure 2 illustrate the simulation of weight on bit with penetration rate for depth 4330.02 ft, Table 4.
Rate of penetration increase at moderate values from 10.17 to 19.68 ft/hr with increasing weight on bit form 4400 to 19800 lbs, 1077.55 lbs/in. The optimum value of 13200 lbs or 1077.55 lbs/in of weight on bit can be used to have optimized drilling operation. This is valid as increasing weight on bit will increase rate of penetration but only to some value where after that, subsequence increase in bit weight causes only slight improvements in penetration rate.
Based on the graph obtain in Figure 3, shown the simulation of weight on bit with penetration rate for depth 4216.06 ft Table 5. Rate of penetration increase from 5.90 to 11.81 ft/hr with increasing weight on bit. However after that, rate of penetration increase slowly.
Although the weight on bit has increase from 15400 until 26400 lbs, 1706.12 lbs/in, rate of penetration still in the range of 11.81 ft/hr.
Based on the graph obtain in Figure 4 indicates the value of weight on bit with penetration rate for depth 4196.39ft Table 6. Rate of penetration increase at small ranges from 5.67 to 11.74 ft/hr with increasing weight on bit. However after that, rate of penetration increase slowly.
Although the weight on bit has increase from 6600 until 19800 lbs, 1137.41 lbs/in, rate of penetration still in the range of 11.74 ft/hr. The optimized bit weight is 13200 lbs or 1077.55 lbs/in during drilling operation, penetration rate for depth 4330.02 ft is suitable due to formation that is may be high in strength.
5. Conclusion
Main problems in this area loss circulation Partial and Severe total loss of circulation occurred at different depths in the 171/2" and 12 1/4" holes, the loss zones were treated by pumping cement plugs, mud plugs, gunk plugs and by dropping other various materials such as balls of mixed of bentonite and Loss of Circulation Materials (LCM) in addition to the special-Net product from Dowell Schlumberger without success to seal the loss zones. Because of that the 13 3/8" casing was run premature at depth 370m instead of 500m as programmed.
The results of optimization show the significance of this study. Determination of optimum weight on bit is very important in drilling operation as this parameter can be change during drilling operation. The optimization of weight on bit will optimize the whole drilling operation as a whole. Increasing rate of penetration will reduce the time need for drilling those reduces the cost for drilling operation.
Optimization for weight on bit found that for depth at 4330.02 ft, optimize weight on bit is 13200 lbs compared to 19800 lbs, at depth 4216.06 ft, optimize value of weight on bit is 15400 lbs compared to 26400 lbs. at depth 4196.39 ft, optimize value is 13933 lbs, compare to 19800lbs. The results of this study provide guidance for next drilling operation near the drilled.
References
[1] Tuna, E., 2010. Real-time-optimization of drilling parameters during drilling operations (Thesis). Middle East Technical University.
[2] Gamier, A. J, and N. H. Van lingen 1959 Phenomena Affecing Drilling Rate at Depth, SPE 1097- G> Annual Fall Meetingof SPE.
[3] Saleem, Q. T., A. H. Tunio, N. A. Ghirano and S. Irawan, 2011. Is It Possible to Ignore Problems Rising During Vertical Drilling A Review. Res. J. Appl. Sci. Eng. Technol., 3 (11): 1331-1336.
[4] Vidrine, D. J., E. J. Benit, 1968. Field verification of effect of differential pressure on drilling rate. J. Petroleum Technol., 20 (7). rilling rate. J. Petroleum Technol., 20 (7).
[5] Tuna, E., 2010. Real-time-optimization of drilling parameters during drilling operations (Thesis). Middle East Technical University.
[6] Moses, A. A. and F. Egbon, 2011. Semi-analytical models on the effect of drilling fluid properties on Rate of Penetration (ROP), SPE no. 150806. Proceedings of the Nigeria Annual International Conference and Exhibition, 30 July-3, Abuja, Nigeria.
[8] Bourgoyne A. T. Jr., Millheim K. K., Chenevert M. E., and Young F. S., "Applied Drilling Engineering", Society of Petroleum Engineers Text Book Series, Vol. 1, Richardson, TX, 1986.
[9] Ozbayoglu M. E., Miska S. Z., Reed T., and Takach N., “Analysis of the Effects of Major Drilling Parameters on Cuttings Transport Efficiency for High-Angle Wells in Coiled Tubing Drilling Operations,” SPE 89334, SPE /IcoTA CT Conf. andExhb., Houston, TX, March 2004.
[10] Final Drilling Report well RH-39, Drilling Rigs (National E-610, Ideco E-1700), Drilling Department August-2006.
[11] Final Drilling Report well RH-40 H, Drilling Rigs (National E-610, Ideco E-1700), Drilling Department June-2006.