Biogeosciences, 6, 739–749, 2009 www.biogeosciences.net/6/739/2009/
© Author(s) 2009. This work is distributed under the Creative Commons Attribution 3.0 License.
Biogeosciences
Quantifying methane emissions from rice fields in the Taihu Lake
region, China by coupling a detailed soil database with
biogeochemical model
L. Zhang1,2, D. Yu1, X. Shi1, D. Weindorf3, L. Zhao1, W. Ding1, H. Wang1, J. Pan2, and C. Li4
1State Key Laboratory of Soil and Sustainable Agriculture, Institute of Soil Science, Chinese Academy of Sciences,
Nanjing, China
2College of Resources and Environmental Sciences, Nanjing Agricultural University, Nanjing, China 3Louisiana State University AgCenter, Baton Rouge, Louisiana, USA
4Institute for the Study of Earth, Oceans and Space, University of New Hampshire, Durham, USA
Received: 22 September 2008 – Published in Biogeosciences Discuss.: 11 December 2008 Revised: 28 April 2009 – Accepted: 28 April 2009 – Published: 6 May 2009
Abstract. As China has approximately 22% of the world’s rice paddies, the regional quantification of CH4 emissions
from these paddies is important in determining their con-tribution to the global greenhouse gas effect. This paper reports the use of a biogeochemical model (DeNitrification and DeComposition or DNDC) for quantifying CH4
emis-sions from rice fields in the Taihu Lake region of China. For this application, the DNDC model was linked to a 1:50 000 soil database derived from 1107 paddy soil profiles com-piled during the Second National Soil Survey of China in the 1980s–1990s. The simulated results showed that the 2.3 Mha of paddy rice fields in the Taihu Lake region emitted the equivalent of 5.7 Tg C from 1982–2000, with the aver-age CH4flux ranging from 114 to 138 kg C ha−1y−1. As for
soil subgroups, the highest emission rate (660 kg C ha−1y−1) was linked to gleyed paddy soils accounting for about 4.4% of the total area of paddy soils. The lowest emission rate (91 kg C ha−1y−1) was associated with degleyed paddy soils accounting for about 18% of the total area of paddy soils. The most common soil in the area was hydromorphic paddy soils, which accounted for about 53% of the total area of paddy soils with a CH4 flux of 106 kg C ha−1y−1. On a
regional basis, the annual averaged CH4 flux in the Taihu
Lake plain soil region and alluvial plain soil region were higher than that in the low mountainous and hilly soil re-gion and the polder soil rere-gion. The model simulation was conducted with two databases using polygons or counties as
Correspondence to: D. Yu
the basic units. The county-based database contained soil information coarser than the polygon system built based on the 1:50 000 soil database. The modeled results with the two databases found similar spatial patterns of CH4
emis-sions in the Taihu Lake region. However, discrepancies ex-ist between the results from the two methods. The total CH4emissions generated from the polygon-based database
is 2.6 times the minimum CH4emissions generated from the
county-based database, and is 0.98 times the maximum CH4
emissions generated from the county-based database. The average value of the relative deviation ranged from−20% to 98% for most counties, which indicates that a more precise soil database is necessary to better simulate CH4emissions
from rice fields in the Taihu Lake region using the DNDC model.
1 Introduction
With economic development, environmental problems are becoming increasingly serious. The enhancement of the greenhouse effects is important aspect which has caused global concern. Methane (CH4) is an important
green-house gas and plays a large role in atmospheric processes. Since 1990, CH4 emissions are responsible for
approxi-mately 15%–20% of the greenhouse gas (GHG) emissions globally (IPCC, 1996). Presently, atmospheric CH4
concen-tration is 1774 ppb, and it is increasing rapidly at a rate of 1.0% yr−1(IPCC, 2007). Rice paddies have been identified as one of the major sources of atmospheric CH4, contributing
about 12% to global CH4emissions (Cicerone et al., 1988;
Lelieveld et al., 1993). China has approximately 22% of the world’s rice paddies and 38% of the world’s rice production, and CH4emissions are responsible for approximately 28% of
the total CH4emission of the world’s rice fields (Jiang et al.,
2004; Wang et al., 1993). Over the past two decades, mid-season drainage has been adopted throughout China as an al-ternative water management approach (Li et al., 2006). Field measurements in China indicate that midseason drainage sig-nificantly reduces CH4emissions (Cai et al., 1999).
There-fore, accurate estimates of CH4emissions from the rice fields
in China are vitally important for a comprehensive under-standing of global GHG dynamics.
Recently, scientists have used models to estimate CH4
emissions from cropping systems (Cao et al., 1995a, b, 1996, 1998; Huang et al., 1998; Matthews et al., 2000a, b). The DeNitrification-DeComposition (DNDC) model developed by Li et al. is a process-based model focused on trace gas emissions from agroecosystems (Li et al., 1992a, b, 1994). Using this model, environmental impacts on CH4emissions
such as climate change, land-use change, and agricultural ac-tivities including alternative farming management practices, can be assessed in a comprehensive way. Presently, the DNDC model has demonstrated good performance through its long-term applications in North America, Europe, Asia and Oceania. For instance, Li et al. (2000) tested the model against observed CH4 emissions from a rice field in
Beau-mont, Texas, USA. The simulated and measured relative de-viation of CH4 emissions was 5.4%, which demonstrated
that the DNDC model could accurately simulate CH4
emis-sions. Jagadeesh et al. (2006) simulated CH4and N2O
emis-sions from rice fields at different locations in India using the DNDC model and found that most discrepancies between simulated and observed seasonal fluxes were less than 20% of the field estimate of the seasonal flux.
The DNDC model has also been utilized to upscaling CH4
emissions from local site to regional scales. So far, most of the DNDC modeling conducted at regional scale has used counties as the basic geographic unit. However, regional es-timates of CH4fluxes cannot be derived simply from the
ex-tension of results from field-plot measurement of CH4fluxes
because of the spatial variations in climate, soil, and man-agement practices (Jagadeesh et al., 2006). As such, county scale model simulations can have great uncertainties as soil properties are averaged for each county, largely ignoring the nonlinear impacts of soil heterogeneity within a county (Pathak et al., 2005; Li et al., 2004; Cai et al., 2003).
For the rice-dominated Taihu Lake Region, we shifted the regional database linked to the DNDC model from a county-based to a grid-basd system which was built upon a new soil map that was recently developed in China. The 1:50 000 soil map was derived from 1107 paddy soil profiles summarized in the Second National Soil Survey of China in the 1980s– 1990s. By linking the detailed soil database to DNDC model, we attempted to improve the performance of the model. The goals of this study were to (1) estimate the inter-annual
[image:2.595.310.546.66.177.2]vari-674 675 676
Fig. 1.
677 678 679 680 681 682 683 684
Fig. 2.
29
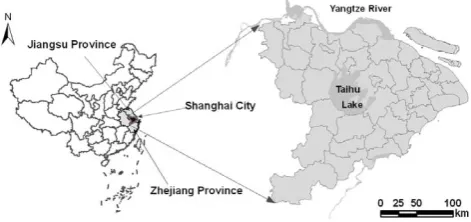
Fig. 1. Geographical location of the study area in China.
ation in CH4 emissions from rice paddy fields in the Taihu
Lake region of China from 1982 to 2000; (2) display the CH4
emissions patterns in different paddy soil subgroups as well as different soil sub-regions; and (3) compare CH4emissions
modeled with polygon- and county-based databases.
2 Materials and methods 2.1 Study area
The Taihu Lake region (118◦500–121◦540E, 29◦560– 32◦160N), an area of intensive rice cultivation, is located in the middle and lower reaches of the Yangtze River paddy soil region of China, includes the entire Shanghai City admin-istrative area and a part of Jiangsu and Zhejiang provinces, and covers a total area of 36 500 km2(Fig. 1) (Li, 1992). It mainly consists of plains formed on deltas with numerous rivers and lakes within the region. The climate is warm and moist with plenty of sunshine and a long growing season. Annual rainfall is 1100–1400 mm, and with a mean temper-ature of 16◦, and average annual sunshine of 1870–2225 h. The frost-free period is over 230 days. The study area is one of the oldest agricultural regions in China, with a history of rice cultivation for several centuries. Approximately 66% of the total land area is covered with paddy soils (Xu et al., 1980).
L. Zhang et al.: DNDC simulations of CH4 741
2.2 Description of the DNDC model
The DNDC (DeNitrification & DeComposition) model, un-der development at the University of New Hampshire since 1992, is a process-orientated simulation tool for soil carbon and nitrogen biogeochemistry cycles (Li et al., 1992 a, b, 1994, 1996). Presently, the DNDC model is one of the more widely accepted biogeochemical models in the world (Li, 2000, 2007). The model contains six interacting sub-models which describe the generation, decomposition, and transfor-mation of organic matter, and outputs the dynamics compo-nents of SOC and greenhouse gases fluxes.
The six sub-models include: (1) soil climate sub-models, which use soil physical properties, air temperature, and pcipitation data to calculate soil temperature, moisture and re-dox potential (Eh) profiles and soil water fluxes through time. The results of the calculation are then fed to the other sub-models; (2) a nitrification sub-model; (3) a denitrification sub-model, which calculates hourly denitrification rates and N2O, NO and N2production during periods when the soil Eh
decreases due to rainfall, irrigation, flooding or soil freezing; (4) a sub-model simulating the decomposition of SOC pools and CO2production through soil microbial respiration; (5) a
plant growth sub-model, which calculates daily root respira-tion, water and N uptake by plants, and plant growth; and (6) a fermentation sub-model, which calculates daily methane (CH4) production and oxidation.
The DNDC model can simulate C and N biogeochemi-cal cycles in paddy rice ecosystems, whereby the model has been implemented by adding a series of anaerobic processes (Li et al., 2002, 2004; Li, 2007; Cai et al., 2003). Paddy soil is characterized by frequent changes between saturated and unsaturated conditions driven by water management. Dur-ing changes in soil water content, the soil Eh is subject to substantial changes between +600 and−300 mV.
The DNDC model allocates substrates (e.g., DOC, NO−3, NH+4 etc.) to reductive reactions (e.g., denitrification, methanogenesis) and oxidative reactions (e.g., nitrification, methanotrophy) based on the relative fractional volumes of the oxidizing and reducing zones, and the potential oxidation and reduction reactions determined by Eh and pH (Yu et al., 2001, 2004; Li, 2007). By tracking the formation and defla-tion of a series of Eh volume fracdefla-tions driven by depledefla-tions of O2, NO−3, Mn4+, Fe3+, and SO24−consecutively, the DNDC
model estimates soil Eh dynamics as well as rates of reduc-tive/oxidative reactions, which produce and consume CH4or
N2O in the soil. This tracking links the soil water regime
to trace gas emissions for rice paddy ecosystems. Tempo-rally, the DNDC model predicts daily CH4and N2O fluxes
from rice fields during periods of extended flooding or shifts between flooded and drained states through the growing and fallow seasons.
2.3 Database development
A major challenge for using an ecosystem model at a regional scale is to assemble adequate datasets required to initialize and run the model. DNDC modeling of CH4emissions from
rice paddy fields requires data describing the soil properties, daily weather, cropping systems, and agricultural manage-ment practices.
In this study, two types of spatial soil databases, polygon-based and county-polygon-based, were used to support the DNDC re-gional simulations. The polygon-based soil database con-tained 52 034 polygons of paddy soils representing 1107 paddy soil profiles extracted from the latest national soil map (1:50 000), which was compiled using the Pedological Knowledge Based (PKB) method (Shi et al., 2004). The soil dataset covered 37 counties in the Taihu Lake region. The mapping units are based on the soil types as defined in Ge-netic Soil Classification of China (GSCC). The soil dataset consisted of many soil attribute fields, including profile code, soil name (in GSCC), profile thickness, bulk density, or-ganic matter content, texture, pH, etc. The county-based soil database was built from the default method developed for DNDC, in which the maximum and minimum values of soil texture, pH, bulk density, and organic carbon content were recorded for each county. The maximum and mini-mum values of the soil parameters were also induced from the 1:50 000 soil database with relatively coarse source data. During the regional runs with the county-based database, the DNDC produced two CH4 fluxes resulting from two runs
with the maximum and minimum soil values, respectively. The two flux values formed a range to define the uncertainty induced from upscaling each county (see detail in Li et al., 2004). For comparison in this study, both the polygon-based and county-based soil databases were run concurrently so the DNDC model could generalize regional CH4emissions for
the Taihu Lake region.
The crop dataset included physiological data of sum-mer rice and winter wheat. The agricultural management dataset included sowing acreages, nitrogen fertilizer appli-cation rates, livestock, planting and harvest dates, and agri-cultural population at the county level from 1982 to 2000 (from the Institute of Geographic Sciences and Natural Re-sources Research, Chinese Academy of Sciences). The climate dataset included daily weather data (precipitation, maximum and minimum air temperature) from 1982–2000, which was acquired from 13 weather stations in the Taihu Lake region (from Institute of Atmospheric Physics, Chinese Academy of Sciences). Each of the counties in the simula-tion was assigned to a weather stasimula-tion nearest to the evaluated county.
Farming management scenarios were compiled based on the assumptions as follows (Tang et al., 2006; Qiu et al., 2004): (1) Nitrogen fertilizer consisted of 40% urea, 40% NH4HCO3, and 20% NH4H2PO3; (2) 15% of aboveground
crop residue was returned to the soil; (3) 20% livestock
Table 1. The CH4emission from rice fields of the Tai-Lake region in China.
Author Location year Treatment and fertilizing amount Emission
kg N ha−1y−1 kg C ha−1y−1
Cai et al. (1994) Wu CountyaSOM 3.20% 1992–1993 no fertilizer 122.3
ammonium sulfate 223 73.7
ammonium sulfate 223+ manure 135.0
ammonium sulfate 223+nitrification inhibitor 99.0
ammonium sulfate 223continuous flooding 143.3
Cai et al., 1995 bJASS SOM 1.85% 1994 contrast 59.3
ammonium sulfate 100 34.5
ammonium sulfate 300 24.0
urea 100 55.5
urea 300 51.0
Li et al., 1993 Jiangning SOM 2.29% 1990–1992 manure+urea 100 195.0
manure 171.0
ammonium sulfate 140 47.3
manure+urea 100 half of dry farming 119.3
Xiong et al. (1999) Wu County SOM 3.5% 1994–1996 urea 191 82.5
ammonium hydrogen carbonate 191 52.5
aSOM: Soil Organic Matter;
bJASS: Jiangsu Academy for Agriculture Science.
wastes and 10% human wastes were added as manure to the soil; (4) One midseason drainage and shallow flooding were applied to summer rice; and (5) For the rice-wheat rotation, tillage was conducted twice before 1990 at 20 cm for rice and 10 cm for wheat on the planting dates; No-till was applied for wheat after 1990.
3 Results and discussion 3.1 Model validation
At present, the DNDC model has been tested against sev-eral CH4flux datasets from wetland rice sites in the United
States, Italy, China, Tailand, and Japan (Li et al., 2002; Cai et al., 2003). For sites in East Asia, simulated seasonal CH4
emissions from paddy soils were in good agreement with field studies (r2=0.96, regression slope=1.1, n=23) (Cai et al., 2003). Results showed that if the site soil characteristics, fertilization rate, fertilization type, crop and water manage-ment were well described, simulated fluxes were similar to observation (Fig. 2) (Zheng et al., 1997).
Previous field measurement of CH4 emissions from the
rice fields in the Taihu Lake region of China ranged from 20 to 200 kg C ha−1y−1 (Table 1) (Wang et al., 2001). In our study, DNDC-modeled CH4 emissions from the
major-ity paddy soils were in the range of 20 to 200 kg C ha−1y−1 (Fig. 3), indicating that the modeled results are consistent with observations for the Taihu Lake region. Table 1 shows that plots with no-fertilizer application yielded higher CH4
fluxes than those receiving only mineral fertilizer nitrogen
[image:4.595.309.547.354.494.2]674 675 676
Fig. 1.
677 678 679 680 681 682 683 684
Fig. 2.
29
Fig. 2. Comparison between observed and DNDC-modeled CH4
and N2O fluxes from a paddy rice field applied with midseason drainage in Wu County, the Taihu Lake region, China, in 1995.
(Cai et al., 1994). This was consistent with the general be-lief that alternating flooding and drainage (treatment of “am-monium sulfate 223”) should be beneficial in reducing CH4
emissions from rice paddy soils (Li et al., 2002). Under the same water regime conditions, addition of (NH4)2SO4
de-pressed CH4fluxes from rice fields, and the depressing effect
of (NH4)2SO4on CH4fluxes seemed to be alleviated by the
addition of a nitrification inhibitor.
The simulated CH4 emission using the DNDC model
L. Zhang et al.: DNDC simulations of CH4 743
[image:5.595.51.284.62.224.2]685 686 687 688 689 690 691 692 693 694 695 696 697 698 699 700 701 702 703
Fig. 3.
CH
4
em
is
s
ions
, T
g
C
0.25 0.26 0.27 0.28 0.29 0.30 0.31 0.32 0.33
1982 1983 1984 1985 1986 1987 1988 1989 1990 1991 1992 1993 1994 1995 1996 1997 1998 1999 2000 Year
Fig. 4.
30
Fig. 3. Distribution of the average CH4-C flux from 1982 to 2000
in the Taihu Lake region, China.
et al., 2003). Total CH4 emissions ranged from 14 to
180 kg C ha−1y−1, while simulated emissions ranged from
15 to 198 kg C ha−1y−1. The difference between the ob-served and simulated emissions in all sites ranged from−12 to 51 kg C ha−1y−1. The highest percentage of relative de-viation was found at the Nanjing site while the lowest was recorded at the Suzhou site. Most discrepancies between the simulated and observed yearly fluxes were less than 10%, which showed that the CH4emissions from paddy soil in the
Taihu Lake region were well simulated by the DNDC model. 3.2 Inter-annual variation in CH4 emissions in the
Taihu Lake region
Based on simulated results, the 2.3 M ha of paddy soils cultivated with summer rice and winter wheat in the Taihu Lake region emitted the equivalent of 5.7 Tg C from CH4 from 1982–2000. The average CH4 flux ranged
from 114 kg C ha−1y−1 to 138 kg C ha−1y−1. However, the modeled annual CH4 emission was highly variable
from year to year (Fig. 4). From 1982–1985, the CH4
emissions of the entire area were very low, accounting for 19% of the total CH4 emissions. This was mainly
caused by the low input of chemical fertilizer and ma-nure. The chemical fertilizer application rate ranged from 180 kg N ha−1yr−1 to 210 kg N ha−1yr−1and the manure rate ranged from 230 kg C ha−1yr−1to 240 kg C ha−1yr−1. After that (from 1986 to 1992), the application rates of fertil-izer tended to increase. Chemical fertilfertil-izers increased from 260 kg N ha−1yr−1to 400 kg N ha−1yr−1and manure went
up from 230 kg N ha−1yr−1to 280 kg N ha−1yr−1. The in-crease in livestock number provided more manure, which in turn enhanced substrates for methanogenesis (Sass et al., 1991; Zheng et al., 1999; Sun et al., 2007). While additional fertilizer application could lead to an increase in CH4
emis-sions due to an increase in rice productivity and biomass, a decrease due to soil Eh value induced induced by fertilizers
[image:5.595.312.545.65.183.2]685 686 687 688 689 690 691 692 693 694 695 696 697 698 699 700 701 702 703
Fig. 3.
CH
4
em
is
s
ions
, T
g
C
0.25 0.26 0.27 0.28 0.29 0.30 0.31 0.32 0.33
1982 1983 1984 1985 1986 1987 1988 1989 1990 1991 1992 1993 1994 1995 1996 1997 1998 1999 2000 Year
Fig. 4.
30
Fig. 4. Distribution of CH4emission from 1982 to 2000 in the Taihu
Lake region, China.
such as ammonium sulfate is also plausible (Lindau et al., 1990; Denier van der Gon and Neue, 1994; Wassmann et al., 1994; Yao and Chen, 1994; Dunfield et al., 1995). The seven years from 1986 to 1992 accounted for 37% of the to-tal CH4emissions. However, the increasing rate of modeled
CH4emissions decreased from 1993 to 2000. Agricultural
statistics show that the amount of synthetic fertilizers used in the region has decreased since 1993 (from the Institute of Ge-ographic Sciences and Natural Resources Research, Chinese Academy of Sciences).
3.3 CH4 emission pattern in different paddy soil
sub-groups in the Taihu Lake region
The hydromorphic subgroup is the most prominent paddy soil type in the Taihu Lake region, accounting for 53% of the total paddy soil area (Fig. 5a). This group contains a high organic carbon content (15 g kg−1) and total nitrogen (2.0 g kg−1) making it favorable for CH
4production by
pro-viding more substrates (soluble C, ammonium, and nitrate) (Zheng et al., 1999; Yao et al., 1999).The modeled average CH4flux was 106 kg C ha−1y−1 (Fig. 5a, b). In the Taihu
Lake region, the total CH4 emissions from this subgroup
were equivalent to 2.5 Tg C, accounting for 44% of the to-tal CH4emissions from the region.
The degleyed and percogenic subgroups cover 18% and 16% of the total paddy soil area in the region, respectively. The modeled CH4 from the degleyed and percogenic
sub-groups were equivalent to 0.71 and 0.83 Tg C, and accounted for 12% and 15% of the regional CH4 emissions,
respec-tively. The CH4emission rate from the percogenic subgroup
was higher than the degleyed subgroup. The main reasons were that the pH value of the former was close to neutral (6.9), and the clay content was only 22%. The latter was weakly acidic (6.5), and had a clay content of 30%. Some studies show that the optimum pH range for CH4
produc-tion is 6.8–7.2 (Pacey et al., 1986), and soil texture has also been documented to affect CH4emissions from rice fields,
increasing emissions with decreasing clay content (Cai et al., 1999).
Table 2. Comparison between observed and DNDC-modeled CH4fluxes from rice fields in the Taihu Lake region, China.
Location Year Observed (kg C ha−1y−1) Simulated (kg C ha−1y−1) Relative deviation (%)
Nanjing 1994 24.0–55.5 (39.8) 35.3–51.8 (43.5) 9.4
Jiangning 1990–1992 47.3–195.0 (121.1) 75.0–144.8 (109.9) −9.3
Wu County 1992–1996 52.5–143.3 (97.9) 53.3–93.0 (73.1) −25.2
Hangzhou 1987–1989 120.0–240.0 (180.0) 148.5–246.8 (197.6) 9.8
Nanjing 1994 57.8 41.3 −28.6
Jurong 1995 14.3 14.7 3.2
Jurong 1997 49.5 55.0 11.1
Suzhou 1993 122.3 122.9 0.6
Suzhou 1993 143.3 151.8 9.8
704
705
706
707
708
709
710
711
712
713
714
715
716
717
718
719
720
721
0.0 0.5 1.0 1.5 2.0 2.5 3.0
Bleached Gleyed Percogenic Degleyed Submergenic Hydromorphic
CH
4
emi
s
s
ions
,
T
g
C
0 20 40 60 80 100 120 140
A
reas
(
1
0
4
ha)
CH4-C Areas
a
95
659
117
91 105 106
0 100 200 300 400 500 600 700
Bleached Gleyed Percogenic Degleyed Submergenic Hydromorphic
A
n
n
ual
C
H4
fl
u
x
,C
/ha
/y
e
a
r
b
722
723 Fig. 6.
31
Fig. 5. (a) Comparison between areas and total CH4emissions in
various paddy soil subgroups of the Taihu Lake region, China. (b) Comparison of the average CH4flux per year in various paddy soil subgroups of the Taihu Lake region, China.
In the Taihu Lake region, submergenic soils sup-port 0.0073 Mha of rice fields with an emission rate of 105 kg C ha−1y−1. Although this subgroup has a neutral pH
value (6.8) and a low clay content (15%), the organic car-bon content was only 10 g kg−1, leading to moderate CH4
emissions (Fig. 5a, b). The areas dominated by gleyed and bleached soil account for 4.4 and 8.8% of the re-gional paddy soil area, with average CH4fluxes of 660 and
95 kg C ha−1y−1, respectively. The CH4emission rate from
[image:6.595.311.544.244.425.2]the gleyed subgroup was much higher than other soil sub-groups due to continuous flooding and a high organic carbon
Fig. 6. The paddy soil region map of the Taihu Lake region, China.
content (25 g kg−1) (Yagi and Minami, 1990; Wang et al., 1993). The CH4emission rate from the bleached subgroup
was low due to low organic carbon content (10 g kg−1). 3.4 CH4emission patterns in different paddy soil
sub-regions in the Taihu Lake region
The Taihu Lake region can be divided into four sub-regions based on landscape characteristics: rolling hills, plains around the lake, plains along the river, and polders (Xu et al., 1980) (Fig. 6).
The rolling hills and low mountains sub-region was dis-tributed in the western and northern extents with paddy fields of 0.39 Mha. Soils in this sub-region are weakly acidic (6.0), have low soil organic carbon content (13 g kg−1) and are well drained (Ma et al., 1999; Rashid et al., 2008). The mod-eled average CH4flux rate for the region was equivalent to
68 kg C ha−1y−1.
[image:6.595.49.285.246.502.2]L. Zhang et al.: DNDC simulations of CH4 745 724 725 726 727 728 729 730 731 732 733 734 735 736 737 738 739 740 741 742 743 744 745 746 747 748 0 50 100 150 200 250 300 350
1 2 3 4 5 6 7 8 9 10 11 12 13 14 15 16 17 18 19 20 21 22 23 24 25 26 27 28 29 30 31 32 33 34 35 36 37
A nnual C H4 fl ux ,C /h a/ y e ar 0 50 100 150 200 250 300 350 A nnual C H
4 fl
ux
,C
/ha/y
ear
Polygon-baseed database of 1:50,000 Average value of county-baseed database Maximun value of county-baseed database Minimun value of county-baseed database
a -40 -20 0 20 40 60 80 100 120
2 3 4 5 6 7 8 9 10 11 12 13 14 15 16 17 18 19 20 21 22 23 24 25 26 27 28 29 30 31 32 33 34 35 36 37
R e la tiv e dev itat ion (% )
Average value of relative devitation (%)
b 32 724 725 726 727 728 729 730 731 732 733 734 735 736 737 738 739 740 741 742 743 744 745 746 747 748 0 50 100 150 200 250 300 350
1 2 3 4 5 6 7 8 9 10 11 12 13 14 15 16 17 18 19 20 21 22 23 24 25 26 27 28 29 30 31 32 33 34 35 36 37
A nnual C H4 fl ux ,C /h a/ y e ar 0 50 100 150 200 250 300 350 A nnual C H
4 fl
ux
,C
/ha/y
ear
Polygon-baseed database of 1:50,000 Average value of county-baseed database Maximun value of county-baseed database Minimun value of county-baseed database
[image:7.595.153.440.71.617.2]a Fig. 7a. -40 -20 0 20 40 60 80 100 120
2 3 4 5 6 7 8 9 10 11 12 13 14 15 16 17 18 19 20 21 22 23 24 25 26 27 28 29 30 31 32 33 34 35 36 37
R e la tiv e dev itat ion (% )
Average value of relative devitation (%)
b Fig. 7b. 32 749 750 751 752 753 754 755 756 757 758 759 760 761 762 763 764 765 766 767 768 769 770 771 772 773 -1000 0 1000 2000 3000 4000 5000 6000
2 3 4 5 6 7 8 9 10 11 12 13 14 15 16 17 18 19 20 21 22 23 24 25 26 27 28 29 30 31 32 33 34 35 36 37
R e la tiv e dev itati on ( % )
Maximum value of relative devitation (%)
c Fig. 7c. -100 -50 0 50 100 150 200
2 3 4 5 6 7 8 9 10 11 12 13 14 15 16 17 18 19 20 21 22 23 24 25 26 27 28 29 30 31 32 33 34 35 36 37
R e la tiv e dev itati on (% )
Maximum value of relative devitation (%)
d Fig. 7d. 33 749 750 751 752 753 754 755 756 757 758 759 760 761 762 763 764 765 766 767 768 769 770 771 772 773 -1000 0 1000 2000 3000 4000 5000 6000
2 3 4 5 6 7 8 9 10 11 12 13 14 15 16 17 18 19 20 21 22 23 24 25 26 27 28 29 30 31 32 33 34 35 36 37
R e la tiv e dev itati on ( % )
Maximum value of relative devitation (%)
c Fig. 7c. -100 -50 0 50 100 150 200
2 3 4 5 6 7 8 9 10 11 12 13 14 15 16 17 18 19 20 21 22 23 24 25 26 27 28 29 30 31 32 33 34 35 36 37
R e la tiv e dev itati on (% )
Minimum value of relative devitation (%)
d
Fig. 7d.
33
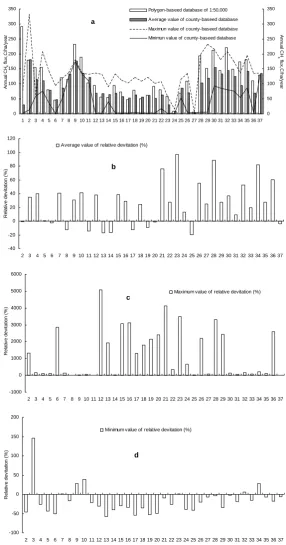
Fig. 7. (a) Comparison of the average CH4flux modeled with the county- and polygon-based database for the Taihu Lake region, China;
and (b, c and d) average (maximum or minimum) value of the relative deviation of the average CH4flux modeled with the polygon-based database by county level as a baseline for the Taihu Lake region, China. (1. Wu County; 2. Zhangjiagang; 3. Changshu; 4. Taicang; 5. Kunshan; 6. Wujiang; 7. Wuxi; 8. Jiangyin; 9. Wujin; 10. Jintan; 11. Liyang; 12. Yixing; 13. Dantu; 14. Jurong; 15. Danyang; 16. Jiaxing; 17. Jiashan; 18. Pinghu; 19. Haiyan; 20. Haining; 21. Tongxiang; 22. Huzhou; 23. Changxing; 24. Anji; 25. Deqing; 26. Yuhang; 27. Linan; 28. Minhang; 29. Jiading; 30. Chuansha; 31. Nanhui; 32. Qingpu; 33. Songjiang; 34. Jinshan; 35. Fengxian; 36. Baoshan; 37. Chongming.)
carbon (16 g kg−1) and large amounts of fertilizers applied
(302 N ha−1yr−1). Moreover, gleyed soils cover an
exten-sive area in this sub-region. So, the modeled average CH4
flux was equivalent to 173 kg C ha−1y−1.
The alluvia plains along the river sub-region contains about 0.64 M ha of rice fields. The soil organic carbon is 23 g kg−1 and the soil pH is 7.3. A reaction range of 6.8– 7.2 is favorable for methane production (Pacey et al., 1986). Moreover, fertilizer application (370 N ha−1yr−1) was high in this sub-region. The modeled average CH4flux was
equiv-alent to 133 kg C ha−1y−1.
The polder sub-region is low in elevation, and con-tains 0.69 Mha of rice fields. Soils in this sub-region were mostly weakly acidic (6.5), and clay contents reach
∼30%. The modeled average CH4 flux was equivalent to
118 kg C ha−1y−1.
3.5 Comparison of CH4 emissions modeled with
polygon- and county-based databases in the Taihu Lake region
According to the default method for regional simulations with the DNDC model, counties are used as the basic sim-ulation unit. The county-based database usually requires rel-atively less soil data. However, when the DNDC model is used for a region with high heterogeneity in soil properties, the method produces higher uncertainty due to limited spa-tially differentiated soil information (Pathak et al., 2005; Cai et al., 2003; Li et al., 2004; R¨uth et al., 2008). The study car-ried out for the Taihu Lake region has provided a chance to test the uncertainty as there is detailed soil information avail-able for the region. The polygon-based soil database contains 52 034 polygons. By contrast, only 37 counties are found in the county-based database. However, DNDC model runs with the polygon-based database produced a single CH4flux
for each polygon while runs with the county-based database produced a range of CH4fluxes to define the uncertainty. The
results simulated by DNDC with the two types of databases were compared to assess the advantages of using the detailed, polygon-based soil dataset.
Figure 7a shows the average CH4flux modeled with the
county- and polygon-based databases for the Taihu Lake re-gion. In the figure, the average CH4fluxes modeled with the
county-based database are expressed with ranges defined by the minimum and maximum CH4fluxes. The average CH4
flux modeled with the polygon-based database is expressed with single values. Results from the two methods demon-strate the spatial patterns of CH4 emissions across the 37
simulated counties. Most of the polygon-based CH4 fluxes
are located within the ranges produced by the county-based method. However, discrepancies exist between results from the two methods. For the Taihu Lake region, the total CH4
emissions modeled with the county-based database ranged from 2.2 to 5.8 Tg C; and the total CH4 emissions
mod-eled with the polygon-based database is equivalent to 5.7.
The total CH4emissions generated from the polygon-based
database are 2.6 times the minimum CH4 emissions
gen-erated from the county-based database, and 0.98 times the maximum CH4 emissions generated from the county-based
database. The relative deviation of maximum and minimum is 60% and−2.0% for the entire region, respectively.
For most of the simulated counties, there are large dif-ferences in the average CH4flux modeled with the
county-and polygon-based databases in the Taihu Lake region (Fig. 7). For example, in Wu County the CH4 flux
mod-eled with the polygon-based database database is equivalent to 290 kg C ha−1y−1. This is nearly 3.7 times the minimum CH4emissions generated from the county-based database,
and 130 times of the maximum CH4flux generated from the
county-based database due to gleyed soils covering an ex-tensive area in this county. Continuous flooding of gleyed soils can be set using the polygon-based database method, but the water management cannot be set using the county-based database method. This is because the simulation of county-based database cannot differentiate the difference of paddy soil type within a county, water management was usu-ally set according to the conventional practice for the en-tire region, although different soil type have different water management practices. However, the simulation of polygon-based database can differentiate different water management of paddy soil type respectively. In this study, the water man-agement of gleyed paddy soil, which is in a state of long-term waterflooding, is different from other paddy soil sub-region in the Taihu Lake region. All the gleyed paddy soil polygons were simulated separately by adopting water management of continuous flooding. The average value of the relative devia-tion for Wu County was as high as 880%. This also showed that smaller soil units or using different soil types would im-prove simulated CH4emissions from rice fields in the Taihu
Lake region using the DNDC model.
On the basis of the DNDC method, the fraction of clay content is the most sensitive parameter in DNDC affect-ing CH4 emissions (Li et al., 2004). The clay content in
the county-based database for Yixing (10%–53%), Danyang (16%–53%), Jiaxing (20%–56%), Tongxiang (20%–52%), and Minhang (17%–46%) vary widely. The CH4flux
mod-eled with the polygon-based database are nearly 0.7, 0.7, 0.7, 0.9 and 1.0 times that of the minimum, respectively, and are nearly 52, 32, 32, 42 and 34 times that of the max-imum CH4 flux generated with the county-based database,
respectively. With the county level average CH4flux as the
baseline, the average value of the relative deviation ranged from 30% to 89% for those counties. Only eight counties (Jiangyin, Wujin, Jintan, Liyang, Deqing, Linan, Chuansha, and Chongmig) had relatively low deviations. The CH4flux
modeled with the polygon-based database were between 0.5 to 2.0 times the minimum and maximum CH4flux generated
L. Zhang et al.: DNDC simulations of CH4 747
of the estimates of greenhouse gas emissions obtained with process-based models, such as the DNDC model, at regional scales.
4 Conclusions
Quantifying CH4 emissions from wetland ecosystems is
a relatively new issue in global climate change studies. Process-based models integrated with GIS databases can play an important role in the biogeochemical cycles based on spatially differentiated information, and either mitiga-tion efforts in the most beneficial regions or evaluate spatial variability of greenhouse gas impacts. The biogeochemical model, DeNitrification and DeComposition or DNDC, is a powerful tool for estimating CH4emissions from terrestrial
ecosystems and has been applied in rice paddies with various purposes. This study showed that by linking with a detailed soil database, the DNDC model estimated emissions equiva-lent to 5.7 Tg C from the 2.3 Mha of paddy rice fields in the Taihu Lake region of China for the period between 1982 and 2000. The modeled annual CH4emissions were highly
vari-able from year to year. The trend is mainly attributed to the increase or decrease of N-fertilizer and livestock manure ap-plication.
Annual CH4 emission rates in the Taihu Lake region are
highly differentiated based on paddy soil subgroups, sub-regions, and county levels due to heterogeneity in soil prop-erties. Therefore, uncertainty in soil properties introduces large uncertainty into CH4estimates. As such, using smaller
soil units is preferable for defining implementation of gov-ernment policies designed to reduce CH4 emissions in the
Taihu Lake region. Further, smaller soil units help to ensure that such policies can be implemented at the farm level suc-cessfully.
At the regional scale, total CH4 emissions were
esti-mated with the DNDC model by linking it to two differ-ent soil databases. The CH4 emissions modeled with the
two databases showed similar spatial patterns of CH4fluxes
across the counties. However, discrepancies existed between the results from the two methods due to heterogeneity in soil properties (e.g. clay content). In addition, the simulation of county-based database of the default method with the DNDC model cannot differentiate the difference of paddy soil type within a county, water management was usually set accord-ing to the conventional practice for the entire region. How-ever, polygon-based database can simulate different water management of paddy soil type respectively. Therefore, uti-lizing more precise soil databases will substantially improve the accuracy of the estimates of greenhouse gas emissions from process-based models.
Acknowledgements. We gratefully acknowledge support for this research from National Natural Science Foundation of China (No. 40621001), National Basic Research Program of China (2007CB407206) and The Frontier Project of the Chinese Academy
of Sciences (No. ISSASIP0715). The participation of Changsheng Li in the study was supported by NASA’s Interdisciplinary Sciences (IDS) program and NSF’s project “Understanding linkages between human and biogeochemical processes in agricultural landscapes”.
Edited by: K. K¨usel
References
Cai, Z., Xing. G., Shen, G., Xu, H., Yan, X., Yagi, K., and Minami, K.: Measurements of CH4and N2O emissions from rice paddies in Fengqiu, China, Soil Sci. Plant. Nutr., 45, 1–13, 1999. Cai, Z., Sawamoto, T., Li, C., Kang, G., Boonjawat, J., Mosier,
A., Tsuruta, H., and Wassmann, R.: Field validation of the DNDC model for greenhouse gas emissions in East Asian cropping systems, Global Biogeochem. Cy., 17(4), GB1107, doi:10.1029/2003 GB002046, 2003.
Cai, Z., Xu, H., Zhang, H., and Jin, J.: Estimate of methane emis-sion from rice paddy fields in Taihu Lake Region, China, Pedo-sphere, 4, 297–306, 1994.
Cai, Z., Yan, X., and Xu, H.: Impact of different types of nitrogen fertilizer on CH4emission from rice fields, Acta. Pedo. Sin (In Chinese), 32, 136–143, 1995.
Cao, M., Dent, J. B., and Heal, O. W.: Modeling of methane emis-sion from rice paddies, Global Biogeochem. Cy., 9, 183–195, 1995a.
Cao, M., Dent, J. B., and Heal, O. W.: Methane emissions from China’s rice paddies, Agric. Ecosyst. Environ., 55, 129–137, 1995b.
Cao, M., Gregson, K., Marshall, S. J., Dent, J. B., and Heal, O. W.: Global methane from rice paddies, Chemosphere, 33, 879–897, 1996.
Cao, M., Gregson, K., and Marshall, S.: Global methane emission from wetlands and its sensitivity to climate change, Atmos. Env-iron., 32, 3293–3299, 1998.
Cicerone, R. J. and Oremland, R. S.: Biogeochemical aspects of atmospheric methane, Global Biogeochem. Cycles, 2, 299–327, 1988.
Denier van der Gon, H. A. C. and Neue, H. U.: Impact of gypsum application on the methane emission from a wetland rice field, Global Biogeochem. Cy., 8, 127–134, 1994.
Dunfield, P. F., Topp, E., Archambault, C., and Knowles, R.: Effect of nitrogen fertilizers and moisture content on CH4 and N2O fluxes in a humisol: Measurements in the field and intact soil cores, Biogeochemistry, 29, 199–222, 1995.
Huang, Y., Sass, R. L., and Fisher, F. M.: A semi-empirical model of methane emission from flooded rice paddy soils, Global Change. Biol., 4, 247–268, 1998.
IPCC-Intergovemmental panel on climate change: Climate change 1995: The Science of Climate Change, Cambridge University Press, Cambridge, UK, 1996.
IPCC-Intergovemmental panel on climate change: Changes in At-mospheric Constituents and in Radiative Forcing, in: IPCC Fourthly Assessment Report, 141–142, 2007.
Jagadeesh Babu, Y., Li, C., Frolking, S., Nayak, D. R., and Ad-hya, T. K.: Field validation of DNDC model for methane and nitrous oxide emissions from rice-based production systems of India, Nutr. Cy. Agroecosyst., 74, 157–174, 2006.
Jiang, C., Wang, Y., Zheng, X., and Wang, M.: Advances in the research on methane emission from paddy fields and its affecting factors, Chin. J. Soil. Sci. (in Chinese), 35, 663–669, 2004. Lelieveld, J., Crutzen, P. J., and Br¨uhl, C.: Climate effects of
atmo-spheric methane, Chemosphere, 26, 739–768, 1993.
Li, C.: Modeling trace gas emissions from agricultural ecosystems, Nutr. Cy. Agroecosyst., 58, 259–276, 2000.
Li, C.: Quantifying greenhouse gas emissions from soils: Scientific basis and modeling approach, Soil Sci. Plant. Nutr., 53, 344–352, 2007.
Li, C., Mosier, A., Wassmann, R., Cai, Z., Zheng, X., Huang, Y., Tsuruta, H., Boonjawat, J., and Lantin, R.: Modeling green-house gas emissions from rice-based production systems: Sen-sitivity and upscaling, Global Biogeochem. Cy., 18(1), GB1043, doi:10.1029/2003GB002045, 2004.
Li, C., Frolking, S., and Frolking, T. A.: A model of nitrous oxide evolution from soil driven by rainfall events: I. Model structure and sensitivity, J. Geophys. Res., 97(D9), 9759–9776, 1992a. Li, C., Frolking, S., and Frolking, T. A.: A model of nitrous oxide
evolution from soil driven by rainfall events: II. Model applica-tions, J. Geophys. Res., 97(D9), 9777–9783, 1992b.
Li, C., Frolking, S., and Harriss, R.: Modeling carbon biogeochem-istry in agricultural soils, Global Biogeochem. Cy., 8, 237–254, 1994.
Li, C., Qiu, J., Frolking, S., Xiao, X., Salas, W., Moore III, B., Boles, S., Huang, Y., and Sass, R.: Reduced methane emis-sions from large-scale changes in water management in China’s rice paddies during 1980–2000, Geophys. Res. Lett., 29(20), GB1972, doi:10.1029/2002GL015370, 2002.
Li, C., Narayanan, V., and Harriss, R.: Model estimates of nitrous oxide emissions from agricultural lands in the United States, Global Biogeochem. Cy., 10, 297–306, 1996.
Li, C., Salas, W., DeAngelo, B., and Rose, S.: Assessing alterna-tives for mitigating net greenhouse gas emissions and increasing yields from rice production in China over the next twenty years. J. Environ. Qual., 35, 1554–1565, 2006.
Li, D., Zhang, J., Li, W., Yue, Z., Yu, F., and Gu, J.: Influence of different agricultural measure on CH4emissions, J. Ecol. Rural. Environ. (In Chinese), (S1), 13–27, 1993.
Li, Q., (ed.): Paddy soil in China, China Science Press (In Chinese), 72–80, 1992.
Lindau, C. W., DeLaune, R. D., Patrick Jr., W. H., and Bollich, P. K.: Fertilizer effects on dinitrogen, nitrous oxide and methane emission from lowland rice, Soil Sci. Soc. Am. J., 54, 1789– 1794, 1990.
Ma, Y. and Chen, J.: Change in Paddy soil Materials and Effect on Eco-environment, China Science Press (In Chinese), 123–129, 1999.
Matthews, R. B., Wassmann, R., and Arah, J.: Using a crop/soil simulation model and GIS techniques to assess methane emis-sions from rice fields in Asia: I. Model development, Nutr. Cy. Argoecosyst., 58, 141–159, 2000a.
Matthews, R. B., Wassmann, R., Knox, J. W., and Buendia, L. V.: Using a crop/soil simulation model and GIS techniques to assess methane emissions from rice fields in Asia: IV. Upscaling to na-tional levels, Nutr. Cy. Argoecosyst., 58, 201–217, 2000b. Pacey, J. G. and DeGier, J. P.: The factors influencing land fill gas
production. In: Energy from landfill gas, Proceeding of a con-ference jointly sponsored by the United Kingdom Department
of Energy and the United States Department of Energy (October 1986), 51–59, 1986.
Pathak, H., Li, C., and Wassmann, R.: Greenhouse gas emis-sions from Indian rice fields: calibration and upscaling using the DNDC model, Biogeosciences, 2, 113–123, 2005,
http://www.biogeosciences.net/2/113/2005/.
Qiu, J., Wang, L., Tang, H., Li, H., and Li, C.: Studies on the situ-ation of soil organic carbon storage in croplands in northeast of China, Chin. Agric. Sci. (in Chinese), 37 (8), 1166–1171, 2004. Rashid, A., Khan, R. U., and Ullah, H.: Influence of nitrogen levels
and application methods on yield and quality of sorghum, Pedo-sphere, 18(2), 236–241, 2008.
R¨uth, B. and Lennartz, B.: Spatial variability of soil properties and rice yield along two catenas in southeast China, Pedosphere, 18(4), 409–420, 2008.
Sass, R. L., Fisher, F. M., Wang, Y., Turner, F. T., and Jund, M. F.: Methane emission from rice fields as influenced by solar radia-tion, temperature, and straw incorporaradia-tion, Global Biogeochem. Cy., 5, 335–350, 1991.
Shi, X., Yu, D., Warner, E. D., Pan, X., Petersen, G. W., Gong, Z. G., and Weindorf, D. C.: Soil database of 1:1,000,000 digital soil survey and reference system of the Chinese Genetic Soil Classi-fication System, Soil Surv. Horizons., 45(4), 129–136, 2004. Shi, X., Yu, D., Warner, E. D., Sun, W., Petersen, G. W., Gong,
Z., and Lin, H.: Cross-reference system for translating between genetic soil classification of China and Soil Taxonomy, Soil Sci. Soc. Am. J., 70, 78–83, 2006.
Soil Survey Staff (Eds.).: Keys to soil taxonomy, US Gov. Print Office, Washington, DC, USA, 6th ed., 437 pp., 1994.
Sun, B., Shen, R., and Bouwman, A. F.: Surface N balances in agri-cultural crop production systems in China for the period 1980– 2015, Pedosphere, 18(3), 304–315, 2008.
Tang, H., Qiu, J., Ranst, E. V., and Li, C.: Estimations of soil organic carbon storage in cropland of China based on DNDC model, Geoderma, 134, 200–206, 2006.
Wang, M., Dai, A., Huang, J., Ren, L., Shen, R., Schutz, H., Ren-nenberg, H., Seiler, W., Rasmussen, R. A., and Khalil, M. A. K.: Sources of methane in China: rice fields, agricultural waste treatment, cattle, coal mines, and other minor sources, Sci. At-mos. Sin. (in Chinese), 17, 52–64, 1993.
Wang, X., Ouyang, Z., and Miao, H.: Application of DNDC Model in Estimation of CH4and N2O Emissions in Agricultural Ecosystems in Yangtze River Delta, Environ. Sci. (In Chinese), 22(3), 15–19, 2001.
Wang, Z., DeLaune, R. D., Patrick Jr., W. H., and Masscheleyn, P. H.: Soil redox and pH effects on methane production in a flooded rice soil, Soil Sci. Soc. Am. J., 57, 382–385, 1993.
Wassmann, R., Neue, H. U., Lantin, R. S., Aduna, J. B., Alberto, M. C. R., Andales, M. J., Tan, M. J., Denier van der Gon, H. A. C., Hoffmann, H., Papen, H., Rennenberg, H., and Seiler, W.: Temporal patterns of methane emissions from wetland rice fields treated by different modes of N application, J. Geophys. Res., 99(D8), 16 457–16 462, 1994.
Xiong, X., Shen, R., Wang, M., Zheng, X., Wang, Y., and Li, J.: Methane emission from rice paddy field of Ta-Lake area, Chin. J. Atmosc. Sci. (In Chinese), 23(1), 9–18, 1999.
L. Zhang et al.: DNDC simulations of CH4 749
methane emission from some Japanese paddy fields, Soil Sci. Plant Nutr., 36, 599–610, 1990.
Yao, H. and Chen, Z.: Effect of chemical fertilizer on methane emis-sion from rice paddies, J. Geophys. Res., 99(D8), 16 463–16 470, 1994.
Yao, H., Conrad, R., Wassmann, R., and Neue, H. U.: Effect of soil characteristics on sequential reduction and methane production in sixteen rice paddy soils from China, the Philippines, and Italy, Biogeochemistry, 47(3), 267–293, 1999.
Yu, K., William H., and Patrick Jr.: Redox window with minimum global warming potential contribution from rice soils, Soil Sci. Soc. Am. J., 68, 2086–2091, 2004.
Yu, K., Wang, Z., Vermoesen, A., Patrick Jr., W., and Van Cleemput, O.: Nitrous oxide and methane emissions from different soils suspensions: effect of soil redox status, Biol. Fertil. Soil., 34, 25–30, 2001.
Zheng, X., Wang, M., Wang, Y., Shen, R., Shangguan, X., Heyer, J., Kogge, M., Papen, H., Jin, J., and Li, L.: CH4and N2O emis-sions from rice paddies in southeast China, Chin. J. Atmos. Sci., 21, 167–174, 1997.
Zheng, X., Wang, M., Wang, Y., Shen, R., Shangguan, X., Heyer, J., K ¨Ogge, M., Papen, H., Jin, J., and Li, L.: Characters of green-house gas (CH4, N2O, NO) emissions from croplands of south-east China, World Resour. Review, 11(2), 229–246, 1999.