R E S E A R C H A R T I C L E
Open Access
Posterior capsular opacification comparison
between morphology and objective
visual function
Chengzhe Lu
1†, Shasha Yu
1†, Hui Song
1, Yun Zhao
1, Shiyong Xie
1, Xin Tang
1,2,3,4and Xiaoyong Yuan
1,2,3,4*Abstract
Background:To compare the influence of posterior capsule opacification (PCO) morphology and severity on intraocular stray light and visual function with different levels of contrast.
Methods:Forty-five patients diagnosed with PCO were included in this prospective consecutive case series. The Optical Quality Analysis System II (OQAS II) was adopted to assess the objective visual function including objective scatter index (OSI) and optical quality analysis system values (OVs) with 100, 20, and 9% contrast. RTVue-100 OCT was used to evaluate the PCO morphology and severity. Comparisons among visual function, morphology, and severity between pear type and fibrosis PCO were performed. The correlations among the PCO morphology, severity, OSI, and OVs were also determined.
Results:There was a significant correlation between increased OSI and decreased visual acuity in PCO patients before laser capsulotomy. The changes of OSI were also correlated with the PCO area for the 3 mm IOL optic region (r = 0.43, p= 0.02). The OSI was significantly higher in pear type PCO when compared with fibrosis PCO (Z =−4.06,p≤0.001). In addition, the increased OSI in pear type PCO was significantly correlated with the 100% OVs and the 20% OVs but not with the 9% OVs. In fibrosis PCO, OSI was only correlated with the 100% OVs and the 20% OVs pre-YAG.
Conclusions:OSI and OVs could objectively indicate the visual function impairment in PCO patients. Effects of PCO on light scattering and on objective visual function might be explained by the variations of morphology and severity.
Keywords:PCO morphology, Severity, Objective visual function, Objective scatter index (OSI), Optical quality analysis system values (OVs)
Background
Posterior capsule opacification is still the major compli-cation after cataract surgery, which impairs the visual function of 28% of patients 5 years after IOL
implant-ation [1]. Laser capsulotomy, the most common method,
has been used to remove the opacification of the poster-ior capsule. The decision to perform laser capsulotomy surgery commonly involves decreased visual acuity and visual disturbances. In detail, decreased visual function has two distinct functional domains: visual acuity (VA) and contrast sensitivity (CS) assessed by the small angle domain as well as stray light assessed by the large angle
domain [2]. It was reported that approximately 10% of
intraocular light is scattered in the young healthy eye, but the number increases considerably in those over 50
years old [3]. In PCO patients, it was proven that
for-ward light scatter was the most sensitive factor in PCO assessment; less than 1% of central PCO proved the in-crease in forward light scatter with the inin-crease in PCO percentage, followed by the ETDRS visual acuity (78%) and the contrast sensitivity (ranged from 38 to 51%) [4].
In previous studies, C-quant was used to assess the for-ward light scatter. However, this approach was based on
the subjective compensation comparison method [5–7]
and was patient-dependent and time consuming [8]. Until
now, the Optical Quality Analysis System II (OQAS II) based on the double-pass technique has enabled the ob-jective evaluation of the visual system, including the * Correspondence:[email protected]
†Chengzhe Lu and Shasha Yu contributed equally to this work.
1Tianjin Eye Hospital, No.4 Gansu Road, Heping District, Tianjin 300020, China 2Tianjin Eye Institute, Tianjin, China
Full list of author information is available at the end of the article
Since previous studies have emphasized the influence of PCO morphology and severity on visual function, pear type and fibrosis PCO affect visual function, including vis-ual acuity and contrast sensitivity, differently [8,11,15]. In vivo studies on the influence of PCO morphology and se-verity on objectively measured visual function are rare
[16]. Furthermore, OCT as the backward light scattering
method has been suggested as a method to evaluate the
morphology of PCO [17].
Therefore, we combined the forward scatter method, OQAS-II, to assess the objective visual function and the backward scatter method, OCT, to assess the morphology of PCO. We aimed to compare the influence of different kinds of PCO morphology and severity on intraocular stray light and on visual function with different levels of contrast. We believe that objective visual function evalu-ation combined with morphology assessment plays an im-portant role in PCO prevention and treatment.
Methods Patients
This prospective study recruited posterior capsule pa-tients in Tianjin Eye Hospital. The study was reviewed and approved by the Research Review Broad of Tianjin Eye Hospital. Informed consent from each patient was collected before the examination and surgery, and the study strictly adhered to the tenets of the Declaration of Helsinki (1989). Patients with corneal opacity, glaucoma, trauma, complicated ocular surgery, and severe systemic disease were excluded from the study. All the surgeries were performed by one expert doctor. Routine ocular ex-aminations including visual acuity VA (corrected visual acuity, CDVA), intraocular pressure, auto-refractometer examination, slip lamp examination and fundus examin-ation were done before surgery.
Examinations
VA measured with the logarithmic visual acuity chart and converted to the logarithm of the minimum angle of resolution (logMAR) values for analysis.
OQAS II (Visiomtrics. Inc., Spanish) was adopted to access the quality of the visual system, the measure-ments including objective scatter index (OSI) and the optical quality analysis system values (OVs). The pupil
diameter setting was 4 mm. Patients’ refractive errors
were corrected by setting the real refractive state in the equipment before measurement. Patients were told to blink before measurement to reduce the influence of tear film. OSI was an objective quantification of the intraocular
OSI for normal eyes is approximately 1, and values over 5 represent highly scattered systems [9]. OVs referred to the objective visual acuity, corresponded to the modulation transfer function (MTF) values, and described the optical quality of the eye in at three contrast conditions, including 100% OVs, 20% OVs and 9% OVs. In detail, the 100% OVs were related to the MTF cutoff frequency, which was the MTF cutoff frequency divided by 30 cycles/degree. There-fore, the 100% OVs reflected the visual acuity with 100% contrast without the influence of the retina and neurons. The 20% OVs and 100% OVs were calculated in the same way from smaller frequencies, which were related to the 0.05 and 0.1 MTF value [18].
RTVue-100 OCT (RTVue-100, Optovue Inc., Fremont, CA) was used to evaluate the area, thickness and density of PCO with cross sectional images on the horizontal and vertical meridian at 3 mm IOL optic region. After pupil dilation, the corneal anterior module long adaptor lens was installed to the detecting probe. Patients fixated on the front red indicator light using the other eye. The cornea cross line mode was used to take the images of the PCO on the vertical and horizontal meridians. The images were then transferred to a personal computer for further analysis using Image-Pro Plus software 6.0. The area, thickness and density of the opacification at the 3 mm optic zone were measured. Similar method was used to value opacification area, thickness and density at 5 mm optic zone. Values of the vertical and horizontal meridians were then averaged for further analysis (details in Fig.1a).
VA and OQASII were measured within 10 to 30 min after the laser capsulotomy.
Statistical analysis
All the data were recorded in Excel and were transferred to IBM SPSS Statistics 23.0 for analysis. The distribution of all the data was accessed using the Kolmogorov-Smirnov test before analysis. The CDVA and OSI before and after laser capsulotomy were compared using Wilcoxon matched paired test. The nonparametric Spearman correlation test was adopted to evaluate the relationship between variables. Comparisons of morphology, CDVA, OSI and OVs be-tween pear type and fibrosis PCO were analyzed using the
Mann-Whitney U test.P-values less than 0.05 were
consid-ered statistically significant.
Results
excluded from further analysis. All the patients included completed the pre-Yttrium Aluminum Garnet (YAG) OQASII measurement, and 34 eyes completed the post-YAG OQASII measurement (26 eyes with pear type PCO and 8 eyes with fibrosis PCO). The average age was 69.17 + 10.93 years. PCO time was 43.24 + 30.67
months (ranges: 10–132 months).
Comparison of VA and OSI before and after laser capsulotomy
The LogMAR VA and OSI of PCO patients before and
after laser capsulotomy are shown in Table 1. There
were significant differences between pre-YAG and post-YAG of LogMAR VA and OSI for all PCO eyes
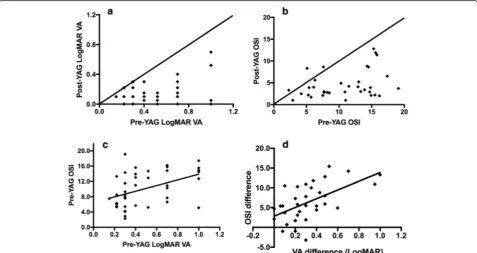
(Table1, Fig.2a, b). The pre-YAG LogMAR VA was
cor-related with the OSI as described in Fig.2c, and the
cor-relation coefficient was 0.49 (p= 0.001). The VA
improvement was also positively related to the OSI
de-crease, described in Fig. 2d, and the correlation
coeffi-cient was 0.67 (p≤0.001).
Comparison of morphology and severity between pear PCO and fibrosis PCO
The arc shaped PCO region ‘DFHIGE’, as described in
Fig.1a, was the central 3-mm PCO region. As shown in
Fig. 1b, the IOL outline and the IOL-posterior capsule
space of the pseudophakic eye were visualized in the RTVue-100 OCT cross-section images. Pear type PCO
(Fig. 3a) was described as the high-density deposition of
the proliferated LECs and the extracellular matrix be-tween the IOL and the posterior capsule, which were
unevenly distributed, and bladder cells were also
ob-served. Fibrosis PCO (Fig.3c) was described as the high
density of the posterior capsule.
The severity of PCO was evaluated with PCO area, thickness and density, which were 0.48 ± 0.24 (0.07–1.04)
mm2, 0.12 ± 0.06 (0.03–0.24) mm and 44.14 ± 11.09
(27.49–68.26) at 3 mm optic zone, respectively. At 5 mm
optic zone, PCO area was area, thickness and density were 0.59 ± 0.31 (0.08–1.23) mm2, 0.10 ± 0.05 (0.01–0.20) mm and 39.22 ± 10.61 (22.13–65.3), respectively. PCO area at 3 mm optic zone was significantly correlated with the OSI reduction after laser capsulotomy (r = 0.43,p= 0.02) as
de-scribed in Fig. 4d. While at the 5 mm optic zone, PCO
area was not correlated with the OSI decreasing (r = 0.06, p= 0.76). The density and thickness were not statistically correlated.
The differences between pear type PCO and fibrosis
PCO are shown in Fig. 4a, b, c. The pear type PCO
showed a larger opacification area in the IOL-posterior
capsule space (Z =−1.96, p= 0.05 at 3 mm optic zone;
Z =−3.14, p= 0.002 at 5 mm optic zone; Z =−2.71, p=
0.007 at 6 mm optic zone) and was thicker than the fibrosis PCO (Z =−3.05, p = 0.002 at 3 mm optic zone; Z =
−2.52,p= 0.01 at 5 mm optic zone; Z =−3.15, p = 0.002 at 6 mm optic zone). The density of these two kinds of PCO was not significantly different (Z =−0.65,p= 0.51 at 3 mm
optic zone; Z =−0.15, p= 0.88 at 5 mm optic zone; Z =
−1.00, p= 0.32 at 6 mm optic zone). In addition, the
area of pear type PCO at 3 mm optic region was correlated with the OSI reduction after laser
capsulot-omy (r = 0.36, p= 0.07); for fibrosis PCO, the
correl-ation decreased (r = 0.32, p= 0.6).
Visual function comparison between pear PCO and fibrosis PCO
Before laser capsulotomy, the pear type PCO showed poor
VA compared with fibrosis PCO (Z =−3.36, p= 0.001).
After laser capsulotomy, VA increased, and there was no significant difference between the fibrosis PCO and the pear type PCO (Z =−1.42,p= 0.16) (Table2),
Pear type PCO showed higher OSI compared with the
fi-brosis PCO both pre- and post-YAG (Z =−4.06,p≤0.001).
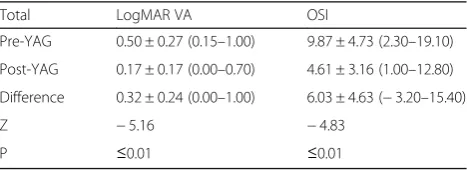
Fig. 1Illustration of PCO evaluation using RTVue-100 OCT.aAssessment of PCO with cross-sectional image. L refers to line. L1, L2, L3, and L4 represent the anterior surface of IOL, the horizontal diameter of the IOL optic region, the posterior surface of IOL, and the posterior capsule, respectively. Distance from point A to C refers to the 3-mm IOL optic region, and point B is the center. Distances from point D to E, H to I, and F to G are the PCO thickness at the 3-mm IOL optic region and the central optic region. The IOL-posterior capsular space is the region between line 3 and line 4. The region around point DFHIGE is the PCO area at the 3-mm IOL optic region.bPseudophakic eye with a clear posterior capsule
Table 1Comparison between LogMAR VA and OSI: Pre-YAG
and post-YAG
Total LogMAR VA OSI
Pre-YAG 0.50 ± 0.27 (0.15–1.00) 9.87 ± 4.73 (2.30–19.10)
Post-YAG 0.17 ± 0.17 (0.00–0.70) 4.61 ± 3.16 (1.00–12.80)
Difference 0.32 ± 0.24 (0.00–1.00) 6.03 ± 4.63 (−3.20–15.40)
Z −5.16 −4.83
P ≤0.01 ≤0.01
Laser capsulotomy significantly decreased the OSI of pear type PCO. The OSI of fibrosis PCO also decreased, though it was not statistically significant. After laser capsulotomy, there was no significant difference in OSI between fibrosis PCO and pear type PCO (Z =−0.71,p= 0.48) (Table2).
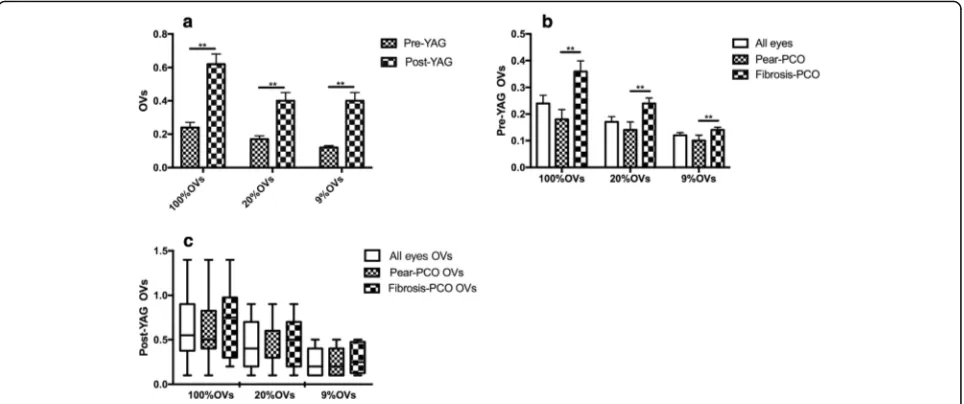
Before laser capsulotomy, the 100% OVs, 20% OVs and 9% OVs were 0.24 ± 0.20, 0.18 ± 0.13, and 0.12 ± 0.09, re-spectively, which significantly improved after laser capsulot-omy: 0.62 ± 0.36, 0.39 ± 0.28 and 0.25 ± 0.15, respectively
(Fig. 5a). The improvements were statistically significant
(Z =−4.31, p≤0.001; Z =−3.9, p≤0.001; Z =−3.96,
p≤0.001).
Comparing the OVs of fibrosis and pear type PCO,
similar improvements were observed (in Fig. 5b, c).
However, fibrosis PCO showed higher OVs than the pear type PCO both pre-YAG and post-YAG. In addition, there were significant differences in the 100% OVs, 20% OVs and 9% OVs between fibrosis and pear type PCO Fig. 2Relationship between VA and OSI.aCorrelation of VA pre-YAG & post-YAG,bcorrelation of OSI pre-YAG & post-YAG,ccorrelation of VA and OSI before laser capsulotomy,dcorrelation of OSI and VA changes after laser capsulotomy
Fig. 3Morphology of pear type and fibrosis PCO.aRepresents the pear-type PCO using RTVue-100 OCT, and the unevenly distributed
before laser capsulotomy (Z =−4.4, p≤0.001; Z =−4.34, p≤0.001; Z =−3.12, p= 0.002). After laser capsulotomy, the differences were not statistically significant.
The relationship between OSI and 100% OVs, 20% OVs and 9% OVs
The OVs evaluated the objective visual acuity under three contrast conditions, as described in Table3. Before laser capsulotomy, there were correlations between OVs and OSI both in pear type PCO and fibrosis PCO at 100 and 20% contrast levels, except for the low contrast level of 9%. After laser capsulotomy, OSI was significantly correlated with OVs at all the contrast levels in pear type
PCO but was not significantly correlated with that of fibrosis PCO.
Discussion
Visual function does not decline substantially until 50 years of age, but especially declines in the age range of 61–70 years [19]. Stray light increases strongly with age3 and doubles by the age of 65 years, tripling by the age of
77 years [20]. PCO is heterogeneous both in morphology
and severity, and stray light increases in PCO eyes, which is considered an early indicator [16].
In our study, OQAS-II was used to objectively evalu-ate the intraocular stay light. What we found was that Fig. 4Evaluation of PCO severity using RTVue-100 OCT.aComparison of opacification area between pear type and fibrosis PCO (Mann-Whitney U test, Z =−1.96,p= 0.05 at 3 mm optic zone;**Z =
−3.14,p= 0.002 at 5 mm optic zone;**Z =
−2.71,p= 0.007 at 6 mm optic zone).bComparison of PCO thickness between pear type and fibrosis PCO, the difference was statistically significant (Mann-Whitney U test, Z =−3.05, p = 0.002 at 3 mm optic zone; Z =−2.52,p= 0.01 at 5 mm optic zone; Z =−3.15, p = 0.002 at 6 mm optic zone).cComparison of PCO density between pear type and fibrosis PCO (Mann-Whitney U test, Z =−0.65,p= 0.51 at 3 mm optic zone; Z =−0.15,p= 0.88 at 5 mm optic zone; Z =−1.00,p= 0.32 at 6 mm optic zone).d
Correlation of OSI changes and PCO area at 3 mm IOL optic region before laser capsulotomy for all eyes (r = 0.43,p= 0.02)
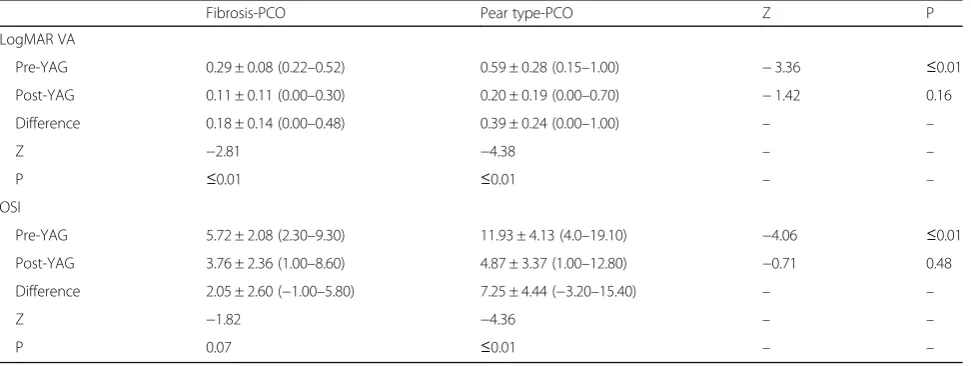
Table 2Comparison between fibrosis PCO and pear type PCO: Pre-YAG and post-YAG
Fibrosis-PCO Pear type-PCO Z P
LogMAR VA
Pre-YAG 0.29 ± 0.08 (0.22–0.52) 0.59 ± 0.28 (0.15–1.00) −3.36 ≤0.01
Post-YAG 0.11 ± 0.11 (0.00–0.30) 0.20 ± 0.19 (0.00–0.70) −1.42 0.16
Difference 0.18 ± 0.14 (0.00–0.48) 0.39 ± 0.24 (0.00–1.00) – –
Z −2.81 −4.38 – –
P ≤0.01 ≤0.01 – –
OSI
Pre-YAG 5.72 ± 2.08 (2.30–9.30) 11.93 ± 4.13 (4.0–19.10) −4.06 ≤0.01
Post-YAG 3.76 ± 2.36 (1.00–8.60) 4.87 ± 3.37 (1.00–12.80) −0.71 0.48
Difference 2.05 ± 2.60 (−1.00–5.80) 7.25 ± 4.44 (−3.20–15.40) – –
Z −1.82 −4.36 – –
P 0.07 ≤0.01 – –
pre-YAG OSI was 9.87 ± 4.73 and that LogMAR VA was 0.50 ± 0.27. It was reported that in the pseudophakic eye,
OSI was 1.06 ± 0.48 and LogMAR VA was−0.26 ± 0.06;
in normal eyes, OSI was 1.03 ± 0.65 and LogMAR VA
was −0.25 ± 0.06 [21]. Our finding supports the points
that PCO induced visual function deterioration,
includ-ing VA reduction and stray light increases [22–27]. In
addition, we found that increased OSI was correlated with decreased visual acuity. As previously reported, the more light that was scattered, the more VA and CS de-creased in PCO eyes [24]. Zhang’s study [11] also proved the close relationship between OSI and BCVA in PCO eyes, and their correlation coefficient was higher than ours. This discrepancy may be explained by the uneven distribution and severity of different kinds of PCO, and the visual acuity and stray light of PCO eyes did not cor-respond [22].
After laser capsulotomy, OSI decreased obviously, ac-companied by significant VA improvement. The changes
in OSI were well correlated with those of VA. These findings are supported by previous studies showing that laser capsulotomy removed the opacified posterior
cap-sule and increased VA, CS [24–27] and intraocular stay
light values [8, 26]. Yotsukura found that the log(s) of the stray light values significantly decreased after capsu-lotomy (pre-YAG 1.59 ± 0.20 log(s) & post-YAG 1.43 ± 0.14 log(s)) [26]. Nino reported that the OSI of regenera-tive PCO pre-YAG was 8.0 ± 4.6 and was 3.6 ± 2.2 post-YAG; meanwhile, the stray light measured with C-quant was 1.8 ± 0.6 log (s) pre-YAG and 1.6 ± 0.3 log(s) post-YAG. The log(s) of stray light was correlated
with OSI (r = 0.32, p= 0.07) [8]. Similar changes
oc-curred in cataract eyes. OSI was 11.5 ± 3.6 pre-surgery, which significantly decreased (3.2 ± 0.8) with OSI 2 months after cataract surgery, accompanied by the
im-provement of BCVA [28].
To assess the effect of PCO morphology and severity on visual function, we classified the fibrosis and pear Fig. 5Comparison of OVs values between pear type and fibrosis PCO.a100% OVs, 20% OVs, 9% OVs comparison between pre-YAG and post-YAG, OVs at the three contrast were significantly improved after laser capsulotomy (Mann-Whitney U test,**Z =−4.31,p≤0.001;**Z =−3.9, p≤0.001;**Z =−3.96, p≤0.001),b 100% OVs, 20% OVs, 9% OVs comparison between pear type PCO and fibrosis PCO before laser capsulotomy, OVs in fibrosis PCO was significantly higher than pear type PCO (Mann-Whitney U test, **Z =−4.4, p≤0.001;**Z =−4.34, p≤0.001;**Z =−3.12, p = 0.002),c100% OVs, 20% OVs, 9% OVs comparison between pear type PCO and fibrosis PCO after laser capsulotomy, there was no significant difference here
Table 3Relationship between OSI and 100% OVs, 20% OVs and 9% OVs
OSI & 100% OVs OSI & 20% OVs OSI & 9% OVs
correlation coefficient Pvalue correlation coefficient Pvalue correlation coefficient Pvalue
Fibrosis-PCO
Pre-YAG −0.64 0.02 −0.61 0.02 −0.36 0.21
Post-YAG −0.67 0.07 −0.69 0.06 −0.52 0.19
Pear type-PCO
Pre-YAG −0.67 0.00 −0.62 0.00 −0.07 0.74
Post-YAG −0.42 0.03 −0.45 0.02 −0.48 0.01
type PCO and analyzed the area, thickness and density
[16] of these two kinds of PCO using RTVue-100 OCT.
We found a positive correlation between the 3-mm PCO area and the OSI difference, which suggests that the larger opacification area might be paralleled by higher scatter light. We define PCO severity by multiply-ing the PCO area by density and found that it was also related with the OSI but not with the VA. This finding agreed with the previous finding that in PCO patients,
stray light increased with good visual acuity [26]. PCO
severity evaluated with the EPCO score had a liner rela-tionship with the log of the stray light parameters s (log(s)) and a curvilinear relationship with log MAR VA. VA and stray light were two independent factors, and the increase in stray light was much more sensitive than
the decrease in VA [16]. Furthermore, PCO’s effect on
the small angle or large angle domain visual function may depend on the ratio of small particles and the re-fractile structures of PCO [23].
When comparing the pear type PCO with fibrosis PCO, we found a larger area and a thicker sub-capsular opacifica-tion but a higher density of fibrosis PCO than pear type PCO. As reported, fibrosis PCO originated from cuboidal epithelial cells that lined the anterior capsule and resulted in wrinkling and thickening of the adjacent posterior cap-sule. It was reported that EPCO scores and PCO refractions evaluated with retro-illuminations in pear type PCO were significantly higher than those of the fibrosis PCO [16]. Pear type PCO primarily originated from the actively mi-totic epithelial cells located at the lens equator, which was the origin from which the bladder cells tended to migrate to form posterior sup-capsule opacification. Different ori-gins and pathological processes may explain the different characteristics of fibrosis and pear type PCO [24].
In addition, Romina et al correlated the PCO severity with visual function and suggested that clinically consid-ered high density fibrosis PCO might have a less deleteri-ous effect on visual function compared with less severe pear PCO because light may be attenuated by the dense fi-brosis PCO but may be scattered more in the pear PCO [29]. Our result agreed with the above study that the stra-ticulate and high-density fibrosis PCO showed lower OSI (5.72 ± 2.08 &11.93 ± 4.13) and higher VA (0.29 ± 0.08 & 0.59 ± 0.28) compared with pear type PCO. Maartje also reported higher log(s) in pear type PCO than fibrosis PCO
[16]. After laser capsulotomy, there were no significant
differences between fibrosis and pear type PCO both in VA and stray light. Previous in vitro studies supported the varied visual function in pear type PCO and fibrosis PCO, and the author analyzed the forward light scatter using different kinds of posterior capsule opacification and sug-gested that small particles, rod-like fibers in fibrosis PCO, and pear-like structures in regenerative PCO were related to the decrease in VA and the increase in stray light [22].
Since the daily optical environment varied in the light contrast, VA did not reflect visual function comprehen-sively. We evaluated the VA under three contrast condi-tions, 100, 20, and 9%. The OVs in our study were lower than those of the pseudophakic eyes [10, 12], and the au-thor suggested that OVs in pseudophakic eyes were similar or superior to those in normal eyes [12]. PCO deteriorated visual function at all the contrast levels, and OVs decreased when the contrast level was reduced. Similar results were reported using OQAS II that simulated CS were 35.5 + 27.8 at 100%, 32.9+ 24.2 at 20%, and 32.4+ 21.3 at 9% pre-laser capsulotomy and that they improved to 62.7 + 33.4 at 100%, 57.6 + 29.2 at 20%, and 55.0 + 24.2 at 9% post-laser capsulotomy. Fibrosis PCO showed significantly higher OVs than pear type PCO at all the contrast levels, which was in line with the report that pear type PCO lost CS at all frequencies, which was significantly worse than that of fi-brosis PCO [30]. In addition, the decreased OVs were cor-related with the increase in OSI both in the fibrosis PCO and pear type PCO with the 100 and 20% contrast levels but not with the low contrast level of 9%.
Our study has some limitations. The number of fibrosis PCOs was small, which may have limited the fibrosis PCO results. However, the results of fibrosis PCO in our study were consistent with previous results as we discussed above. Another limitation was that we used RTVue-100 OCT to assess the PCO severity on two cross-sectional images of the anterior segment using the opacification area, thickness and density. We found differences between fibrosis PCO and pear type PCO, and the correlation be-tween PCO area with OSI changed, but we could not ig-nore the fact that cross-sectional images cannot represent the complete opacification. Therefore, further study with a more comprehensive method may be needed.
In summary, PCO caused visual function impairments including increased scattered light and decreased VA. The increased intraocular scattered light was signifi-cantly correlated with the decrease in VA and the de-crease in OVs. Pear type PCO tended to result in more serious visual impairment compared with fibrosis PCO, such as the lower VA and OVs with the 100, 20, and 9% contrast levels, as well as the higher OSI. This result agreed with the morphology and severity of pear type PCO, which tended to show a thicker and wider opacifi-cation compared with the fibrosis type.
Conclusion
Acknowledgements
All the kindly help from all the doctors in Cataract Center should be acknowledged.
Funding
The study was financially supported by Science & Technology Foundation for Selected Overseas Chinese Scholar, Bureau of Personnel of Chian, Tianjin, and Talent Innovation Group of 131, Bereau of Personnel, Tianjin.
Availability of data and materials
The datasets analyzed during the current study are available from the corresponding author on reasonable request.
Authors’contributions
CZL and XYY designed this study. SYX and YZ collected and analyzed all the data. CZL and SYX drafted and revised the work. SX gave lots of technique supporting during work. XT give suggestion and direction during all the study. CZL and XYY, HS, SYX and XT substantively revised the manuscript. All authors read and approved the final manuscript.
Ethics approval and consent to participate
The study was reviewed and approved by the Research Review Broad of Tianjin Eye Hospital. Informed consent of paper edition from each patient was collected before the examination and surgery.
Consent for publication
Not Applicable.
Competing interests
The authors declare that they have no competing interests.
Publisher’s Note
Springer Nature remains neutral with regard to jurisdictional claims in published maps and institutional affiliations.
Author details 1
Tianjin Eye Hospital, No.4 Gansu Road, Heping District, Tianjin 300020, China.
2Tianjin Eye Institute, Tianjin, China.3Tianjin Key Laboratory of
Ophthalmology and Visual Science, Tianjin, China.4Clinical College of
Ophthalmology, Tianjin Medical University, Tianjin 300020, China.
Received: 27 November 2018 Accepted: 29 January 2019
References
1. Zhao Y, Yang K, Li J, Huang Y, Zhu S. Comparison of hydrophobic and hydrophilic intraocular lens in preventing posterior capsule opacification after cataract surgery: an updated meta-analysis. Medicine. 2017;96(44). 2. Van den Berg TJ, Franssen L, Coppens JE. Straylight in the human eye:
testing objectivity and optical character of the psychophysical measurement. Ophthalmic Physiol Opt. 2009;29(3):345–50.
3. Gholami S, Reus NJ, van den Berg T. Changes in intraocular Straylight and visual acuity with age in cataracts of different morphologies. J Ophthalmol. 2017:5649532.
4. Meacock, W. R.; Spalton, D. J.; Boyce, J.; Marshall, J. The effect of posterior capsule opacification on visual function, Invest Ophthalmol Vis Sci 2003, 44, (11).4665–9.
5. Guber I, Bachmann LM, Guber J, Bochmann F, Lange AP. Et. al. reproducibility of straylight measurement by C-quant for assessment of retinal straylight using the compensation comparison method. Graefes Arch Clin Exp Ophthalmol. 2011;249(9):1367–71.
6. Koh S, Maeda N, Ikeda C, Asonuma S, Ogawa M. Et. al. the effect of ocular surface regularity on contrast sensitivity and Straylight in dry eye. Invest Ophthalmol Vis Sci. 2017;58(5):2647–51.
9. Paz FC, Sanchez RF, Issolio LA, Colombo EM. Straylight and visual quality on early nuclear and posterior subcapsular cataracts. Curr Eye Res. 2016;41(9):1209–15. 10. Xiao XW, Hao J, Zhang H, Tian F. Optical quality of toric intraocular lens
implantation in cataract surgery. Int J Ophthalmol. 2015;8(1):66–71. 11. Zhang H, Wang J. Visual quality assessment of posterior capsule
opacification using optical quality analysis system (OQAS). J Ophthalmol. 2017;2017:524–9.
12. Park CW, Kim H, Joo CK. Assessment of optical quality at different contrast levels in Pseudophakic eyes. J Ophthalmol. 2016;2016:4247973. 13. Vilaseca M, Romero MJ, Arjona M, Luque SO, Ondategui JC. Et. al. grading
nuclear, cortical and posterior subcapsular cataracts using an objective scatter index measured with a double-pass system. Br J Ophthalmol. 2012; 96(9):1204–10.
14. Xu CC, Xue T, Wang QM, Zhou YN, Huang JH. et. al.Repeatability and reproducibility of a double-pass optical quality analysis device. PLoS One. 2015;10(2):e0117587.
15. Montenegro GA, Marvan P, Dexl A, Pico A, Canut MI. Et. al. posterior capsule opacification assessment and factors that influence visual quality after posterior capsulotomy. Am J Ophthalmol. 2010;150(2):248–53.
16. Van Bree MC, van den Berg TJ, Zijlmans BL. Posterior capsule opacification severity, assessed with straylight measurement, as main indicator of early visual function deterioration. Ophthalmology. 2013;120(1):20–33. 17. Moreno-Montanes J, Alvarez A, Bes-Rastrollo M, Garcia-Layana A. Optical
coherence tomography evaluation of posterior capsule opacification related to intraocular lens design. J Cataract Refract Surg. 2008;34(4):643–50. 18. Liao X , Lin J , Tian J , Wen B, Tan Q, Lan C. Evaluation of Optical Quality:
Ocular Scattering and Aberrations in Eyes Implanted with Diffractive Multifocal or Monofocal Intraocular Lenses[J]. Curr Eye Res. 2018;43(1):1–6. 19. Martinez-Roda JA, Vilaseca M, Ondategui JC, Aguirre M, Pujol J. Effects of aging
on optical quality and visual function. Clin Exp Optom. 2016;99(6):518–25. 20. Van Den Berg TJ, Van Rijn LJ, Michael R, Heine C, Coeckelbergh T, al e. Straylight effects with aging and lens extraction. Am J Ophthalmol. 2007; 144(3):358–63.
21. Kamiya K, Shimizu K, Igarashi A, Kobashi H, Ishii R, et al. Clinical evaluation of optical quality and intraocular scattering after posterior chamber phakic intraocular lens implantation. Invest Ophthalmol Vis Sci. 2012;53(6):3161–6. 22. Van Bree MC, van der Meulen IJ, Franssen L, Coppens JE, Zijlmans BL. Et. al.
in-vitro recording of forward light-scatter by human lens capsules and different types of posterior capsule opacification. Exp Eye Res. 2012;96(1):138–46. 23. van Bree MC, van der Meulen IJ, Franssen L, Coppens JE, Reus NJ, Zijlmans
BL, van den Berg TJ. Imaging of forward light-scatter by opacified posterior capsules isolated from pseudophakic donor eyes. Invest Ophthalmol Vis Sci. 2011;52(8):5587–97.
24. Cheng CY, Yen MY, Chen SJ, Kao SC, Hsu WM, et al. Visual acuity and contrast sensitivity in different types of posterior capsule opacification. J Cataract Refract Surg. 2001;27(7):1055–60.
25. Aslam TM, Aspinall P, Dhillon B. Posterior capsule morphology determinants of visual function. Graefes Arch Clin Exp Ophthalmol. 2003;241(3):208–12. 26. Yotsukura E, Torii H, Saiki M, Negishi K, Tsubota K. Effect of neodymium: YAG laser
capsulotomy on visual function in patients with posterior capsule opacification and good visual acuity. J Cataract Refract Surg. 2016;42(3):399–404.
27. Sundelin K, Lundstrom M. Outcome of capsulotomy in patients with low vision and posterior capsule opacification. Acta Ophthalmol. 2012;90(3):221–5. 28. Chen Y, Wang X, Zhou CD, Wu Q. Evaluation of visual quality of spherical
and aspherical intraocular lenses by optical quality analysis system. Int J Ophthalmol. 2017;10(6):914–8.
29. Jose RM, Bender LE, Boyce JF, Heatley C. Correlation between the measurement of posterior capsule opacification severity and visual function testing. J Cataract Refract Surg. 2005;31(3):534–42.