R E S E A R C H A R T I C L E
Open Access
Multistate recursively imputed survival
trees for time-to-event data analysis: an
application to AIDS and mortality post-HIV
infection data
Leili Tapak
1*, Michael R. Kosorok
2, Majid Sadeghifar
3and Omid Hamidi
4Abstracts
Background:This study aimed to introduce recursively imputed survival trees into multistate survival models (MSRIST) to analyze these types of data and to identify the prognostic factors influencing the disease progression in patients with intermediate events. The proposed method is fully nonparametric and can be used for estimating transition probabilities.
Methods:A general algorithm was provided for analyzing multi-state data with a focus on the illness-death and progressive multi-state models. The model considered both beyond Markov and Non-Markov settings. We also proposed a multi-state random survival method (MSRSF) and compared their performance with the classical multi-state Cox model. We applied the proposed method to a dataset related to HIV/AIDS patients based on a retrospective cohort study extracted in Tehran from April 2004 to March 2014 consist of 2473 HIV-infected patients.
Results:The results showed that MSRIST outperformed the classical multistate method using Cox Model and MSRSF in terms of integrated Brier score and concordance index over 500 repetitions. We also identified a set of important risk factors as well as their interactions on different states of HIV and AIDS progression.
Conclusions:There are different strategies for modelling the intermediate event. We adapted two newly developed data mining technique (RSF and RIST) for multistate models (MSRSF and MSRIST) to identify important risk factors in different stages of the diseases. The methods can capture any complex relationship between variables and can be used as a useful tool for identifying important risk factors in different states of this disease.
Keywords:HIV/AIDS, Highly active antiretroviral therapy, Random forest, Survival analysis, Recursively imputed survival trees, Cohort studies
Background
There are many biomedical and epidemiological follow-up studies where the subjects may experience events of multiple types. For example, when studying the time to death process in human immunodeficiency virus (HIV)-positive patients, the patients can either ex-perience acquired immunodeficiency syndrome (AIDS) or not before death. One of the main challenges in this
research is the need to better understand the prognostic factors affecting the long-term survival in patients to im-prove their life expectancy. This is usually carried out by fitting separate analyses for each end point as well as for the intermediate events but this is not satisfying because it does not account for the relations between these events [1]. In this regard, using multistate models (MSM), is a natural way to model this kind of complex processes [2].
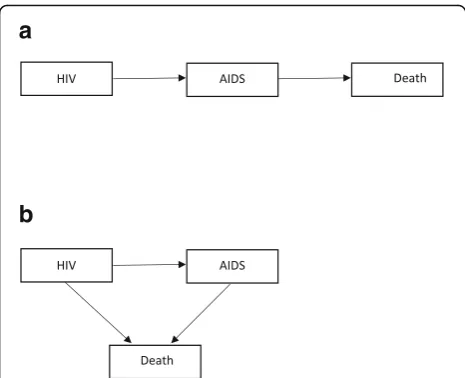
The MSM framework provides a very useful tool to an-swer a wide range of questions in survival analysis that cannot be answered by classical models [3]. Figure 1 shows two simple but most commonly used cases * Correspondence:[email protected]
1Department of Biostatistics, School of Public Health, Modeling of
Noncommunicable Diseases Research Center, Hamadan University of Medical Sciences, Hamadan 65175-4171, Iran
Full list of author information is available at the end of the article
(progressive and illness-death) of multistate diagrams (for the HIV/AIDS example). Competing risks are another special case of MSMs in which one event precludes the event of interest. In these models, the occurrence of events of interest are considered as transitions from one state to another and where the Markov assumption re-quires that the transition rates depend only on the current state of the patient and not on the patient’s history [2]. The interest then focuses on predicting the probability that a patient will be in one of the states at some time point after being HIV-infected.
Aalen and Johansen used counting process methods to estimate transition probabilities when there are no covariates [4]. However, in many applications, mea-sured covariates on each individual under study are also available. Therefore, it is often necessary to ac-commodate the influence of these covariates on tran-sition intensities through a regression model. In this regard, there are a number of models for transition intensities that have been proposed in the literature including parametric models [5–9], semiparametric Markov regression models where transition intensities are modeled by the Cox [10] proportional hazards re-gression model [11–15], or the Aalen additive hazards re-gression model [2, 13, 16]. However, most of the time, there are large correlations between covariates as well as non-linear or multivariable relations especially in high di-mension settings. This can make the Cox traditional models inefficient and unattractive for variable selection and variable effect estimation [17].
Recently, machine learning techniques have gained in-creasing attention in many research areas including time-to-event data analysis. Among them, the use of data-driven ensemble methods for covariate selection and prediction in right censored survival data have been
suggested by several authors [17–20]. These methods focus on learning a predictive rule which is well-generalized to unobserved data [21]. One of the most popular ensemble learning methods with a broad application in data mining and machine learning techniques is random forests (RF); with, random survival forests (RSF) as its extension to sur-vival data analysis [22]. RSF can automatically handle the is-sues of traditional methods by combining the ideas of adaptive nearest neighbors and bagging as well as select and rank variables by taking advantage of variable import-ance measures [22, 23]. Motivated by improving some is-sues of the Ishwaran’s suggested RSF model such as its requirement of having a minimum predetermined number of (observed failure) events in terminal nodes that conse-quently makes censored observations hard to use, Zhu and Kosorok [24] developed a procedure to extrapolate as much as possible information contained in censored observations by nonparametric imputation. They proposed to recursively update the censored observations by imputation to the current model-based conditional failure times and to refit the model to these updated data. The final model is then built by repeating this procedure several times. In this method, referred to as recursively imputed survival trees (RIST), the conditional failure times of the censored obser-vations are incorporated into the model fitting procedure. This in turn reduces the prediction error and improves the accuracy of the model [24]. Ensemble learning methods have been used to identify important risk factors in many clinical research settings, with survival outcome, such as time until death, as an endpoint for studying disease pro-cesses [25–28]. However, no attempt has been made to ex-ploit them under the multistate models context. In this article, we propose a method which combines RIST [17] with the multistate method, which we call multistate RIST (MSRIST), in the hope of relieving the restrictive assump-tions in traditional survival models and improving the pre-dictive power of the resulting model as well as accounting for correlation and interactions among features. We also compare the MSRIST with a multistate version of RSF (MSRSF) as well as with the Cox proportional hazard model in terms of prediction power.
Methods
The statistical model
Multistate models and terminal node estimators
In this section we give a brief description of multistate models. A multistate model can be described by a sto-chastic process (X(t),t∈T)with a finite state space S = {1, 2,…,N}, where T= [0,τ] is a time interval (τis the time of the end of the study). The variable t denotes the time since a special event like first diagnosis (for ex-ample in HIV patients, it is time from HIV infection), d denotes the time of the intermediate event (in HIV posi-tive patients, it is time of developing AIDS). LetHt−be a
a
b
history (aσ-algebra) generated over the interval [0, t). A history for example consists of information about the patients including transition times from one state to an-other state. In a multistate framework, the interest is to predict events as well as to discover risk factors for each transition (h→j). Transition probabilities
Phjð Þ ¼s;t P X tð ð Þ ¼ jjX sð Þ ¼h;Hs−Þ; ð1Þ
for h, j∈S, t∈T, s≤t, or transition intensities
αhjð Þ ¼t Δlim t→0
Phjðt;tþΔtÞ
Δt ; ð2Þ
(the instantaneous hazard of progression to state j given current state h) can characterize the multistate process completely.
Two commonly used approaches for multistate models are available: (a) the clock forward (in which time t is considered since the entrance of the patient to the initial state for all states even for an intermediate event); and (b) the clock reset (in which time t in αhj(t), is consid-ered since the entrance of the patient to state h) [29]. There are several model assumptions about the depend-ency of the transition intensities on time, including be-ing independent of time (constant intensities over time called a time-homogeneous models), depending only on the history of the process via the present state (a Markov model) and depending on the present state (h) as well as on the time Th (the entry time into state h) (a
Semi-Markov model) [30].
Regarding two of the approaches, clock forward models can be considered as Markov models and, for clock reset model, the Markov assumption does not hold (because of dependency of the time scale itself on the history through the time since entering to the current state). Nevertheless, by assuming the dependency of the sojourn times on the history of the process only through the present state and the time since entry of that state, a sequence of embedded Markov models can be formu-lated by the subsequent multistate models (a semi-Mar-kovmodel) [29].
Markov models are commonly used due to their sim-plicity. In a multistate model, the Markov assumption implies that
P X tð ð Þ ¼ jjX sð Þ ¼h;Hs−Þ ¼P X tð ð Þ ¼jjX sð Þ ¼hÞ;
ð3Þ
and the transition probabilities are calculated from the intensities by solving the so-called forward Kol-mogorov differential equation [31]. Therefore, for the illness-death model, the transition probabilities are explicitly expressed as follows in terms of cumulative intensities between s and t (i.e.Ahjðs;tÞ ¼RstαhjðuÞdu):
P11ð Þ ¼s;t e−ðA12ð Þþs;t A13ð Þs;tÞ; ð4Þ
p22ð Þ ¼s;t e−A23ð Þs;t; ð5Þ
P12ð Þ ¼s;t
Z t
s P
11ð Þs;t α12ð Þu P22ðu;tÞdu: ð6Þ
These probabilities can be estimated through the non-parametric model (e.g. the Aalen-Johansen estima-tor) [32]. For example the Nelson-Aalen estimator of cu-mulative hazard for h→j transition attis
^
Ahjð Þ ¼s;t
X
s≤t
ΔNhjð Þs Yhð Þs ;h≠j;
ð7Þ
where ΔNhj(s)≔Nhj(s)−Nhj(s−) is the number of h→j
transitions observed exactly at time s and Yh(s)is the
number of individuals at risk in statehjust prior to time s. Moreover, the elements of the transition probability matrix can be estimated as follows [2]:
^
P sð Þ ¼;t Y s;t
ð g
IþdA u^ð Þ
: ð8Þ
On the other hand, in a semi-Markov model, transi-tion probabilities and intensities are as follows
Phjðs;t;ThÞ ¼P X tð ð Þ ¼jjX sð Þ ¼h;ThÞ ð9Þ
and
αhjðt;ThÞ ¼Δlim t→0
Phjðt;tþΔt;ThÞ
Δt ; ð10Þ
which are not fixed (because they depend on the random quantity ofTh), and there are no Kolmogorov equations
for them. However, in general it is still possible to derive transition probabilities from transition intensities even though the theory is more complex [33].
There are different approaches for the estimation of the transition hazards for censored data based on com-mon regression models. For example, in a so-called sep-arate approach, all transition hazards are modeled separately. Here, we use the separate approach to build our multistate trees.
Recursively imputed survival trees for multistate model MSRIST consists of the following steps as suggested by [24] in a single point survival analysis setting:
(1)Multistate tree model fitting:fit the number ofM extremely randomized multistate trees (ERMTs) to the initial training set (instead of bootstrapped
samples). To this endMextremely randomized
multistate trees (one tree for each transition) for the raw training dataset are generated under the
transition,Kcandidate covariates (along with random split points for each) are randomly selected
from (p)covariates. Then the best split (that leads
to the most distinct daughter nodes) will be determined for each transition using the log-rank test; and for each transition the splitting process will be continued until a terminal node contains less than nmin > 0 observed events.
(2)Conditional transition distribution:A conditional survival distribution is calculated for each censored observation.
(3)One-step imputation for censored observations: All censored data in the raw training dataset will be replaced (with a correctly estimated probability) by one of two types of observations: either an observed
failure event with Y <τ, or a censored observation
with Y =τ.
(4)Refit imputed dataset and further calculation:
Mindependent imputed datasets are generated
according to 3, and one multistate tree is fitted for each of them using 1(a) and 1(b).
(5)Final prediction:Steps 2–4 are recursively repeated a specified number of times before final predictions are calculated.
Random survival forests algorithm for multistate models We will focus on models that satisfy the Markov as-sumption, but results are applicable to non-Markov models as well by considering dandt-d as covariates in the forests as suggested by [22]. The details of the algo-rithm are as follows:
1) DrawBbootstrap samples from the original data
while excluding about 37% of the data in each bootstrap sample (out-of-bag or OOB data); 2) Grow a multistate survival tree for each bootstrap
sample based on randomly selectedK≤pcandidate
variables at each node of the tree. The candidate
variable, used to split each node for the h→j
transition, is the one that maximizes a splitting rule (e.g. using a log-rank test);
3) Grow the trees to full size under the constraint that
a terminal node should have no less than n0 > 0
unique cases for each transition; 4) CalculateðP^hj;b;A^hj;bÞh;j∈S for each tree,b; 5) Take average of each estimator over the B trees.
Prediction performance
To evaluate prediction performance of the model, the prediction error can be estimated through the integrated Brier score (BS), the squared difference between actual and predicted outcome. The Brier prediction error for statehis given by [34]:
PEBhð Þ ¼s E I X sðf ð Þ ¼hg−π^hð Þsjz Þ2
; ð11Þ
which is estimated by
PE^hBð Þ ¼s 1 n
Xn
i−l
I x ið Þ ¼s h−π^ð Þhn sjzi
2
ð12Þ
in the case of a complete observation, where xi(s) for any time point can be computed by xiðsÞ ¼PM−1
m¼0Iftim≤ s<ti
mþ1gxiðtimÞ, ti0¼0;ti1;…;tiMare the transition times for each individual,xiðti
mÞ;m¼0;…;M;are the state oc-cupied at these times and ^πhis a prediction for the tran-sition probability. For the case of right censoring, the
sample containsfð~tim;~xið~timÞÞgMm¼1,ð~t
i;~
xið~timÞÞ,δiand zifor each individual. Then, using the inverse probability of censoring weights (IPCW) technique, the estimator be-comes as
PE^hBð Þ ¼s
1 n
Xn
i¼1
w s;~ti;~xið Þs;G^ð Þn;zi
I~xið Þ ¼s h−^πð Þhn sjzi
2
;
ð13Þ
where
w s;~ti;~xið Þ;s G^ð Þn;zi
¼I ~t
i≤
s;~xið Þ≠s 0
n o
^
Gð Þn~ti−jzi þ
I ~ti>s
n o
^
Gð ÞnðsjziÞ:
ð14Þ
The BS measures the mean squared difference be-tween the predicted probabilities for a possible outcomes for a subject and the observed outcome. So, it is the mean square error for a prediction and has been widely used in survival data context. The smaller the IBS, the better the predictions is returned by a model.
Cindex
Another criteria that was used in this study was con-cordance index (Cindex) for survival data. Cindex is a measure of the discriminative power of a model. In each state, two patients (a pair) in survival analysis are con-cordant if the predicted risk of the interesting event based on the model is greater for the patient who expe-riences the event at an earlier time point. TheCindexis then calculated by using the frequency of concordant pairs among all pairs of subjects.Cindex takes its values between 0 and 1 and the greater the values the better the discriminative power [35].
Variable importance
following the structure proposed by Ishwaran et al. [22] the VIMP was calculated as follows: a) the data was ran-domly divided into train and test sets; b) a MSRIST was created using the data in the training set; c) for a vari-able say x, new cases (in the test set) were dropped down the tree and they were assigned randomly to a daughter node whenever a split for x is encountered for each state; d) for each state the cumulative hazard func-tion is calculated from all trees and averaged; e) the VIMP for x is calculated by subtracting the prediction error of the original ensemble and the new ensemble that is obtained by random allocation forx.
Application Data source
This study utilized a data set corresponding to a registry-based retrospective cohort study conducted in Tehran, Iran, from April 2004 to March 2014. The population in the present study involved people who were HIV-infected and who had a medical record in ei-ther Behavioral Diseases Counseling Centers in Tehran (Imam Khomeini or Zamzam Centers). A person who had been infected with HIV was regarded as an HIV-positive case, regardless of the clinical stage con-firmed by laboratory criteria according to the country definitions and requirements [36]. An HIV case, in the Islamic Republic of Iran, was an individual who had two positive sequential enzyme-linked immunosorbent assay (ELISA) tests for HIV antibody followed and confirmed by a western blot test [37] and an AIDS case was defined as a presumptive (definitive) diagnosis of stage 4 condi-tions and/or CD4 count less than 200 per mm3of blood in an HIV-infected subject [36].
Study variables and outcomes
The following variables were assessed for prognostic value using a checklist of items, developed according to the information documented in the medical records such as: demographic information (age, sex, marital status, and educational level), behavioral information (drug abuse, smoking, and being in prison), baseline CD4 cell count (cells/mm3), highly active antiretroviral therapy (HAART or ART, a combination of several antiretroviral medicines (which is believed to be more effective than using just one medicine (monotherapy)) used to sup-press HIV viral replication and to slow down the pro-gression of HIV disease [38, 39]. The combination usually includes several drugs such as two nucleoside re-verse transcriptase inhibitors (NRTIs) (e.g., Abacavir, Emtricitabine, and Tenofovir), a protease inhibitor (PI) (e.g., Atazanavir, Darunavir, and Ritonavir)), co-infection with TB, and causes of death (according to the informa-tion documented in the medical records).
There were two primary endpoints: 1) AIDS develop-ment; and 2) AIDS-related death. So, the outcomes of interest was the duration of time from the HIV diagnosis date to AIDS progression (HIV→AIDS transition) and from AIDS to AIDS-related death (AIDS→Death transi-tion). Censoring included those patients who were lost to follow up and those who were alive at the end of the study period.
Data description
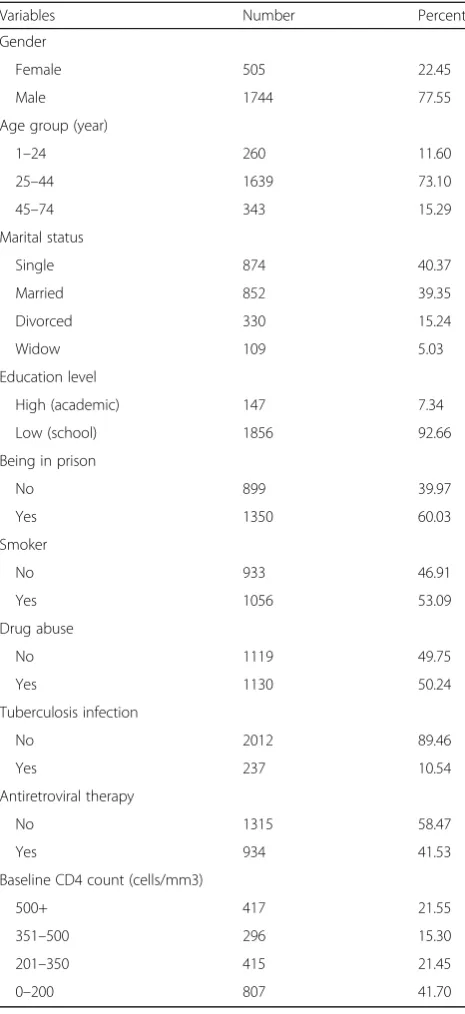
There were 25 ineligible patients and 21 patients with a medical record in both centers among 2519 identified patients in the present study. We considered the data from the 2473 patients (1937 men and 536 women) whose information was appropriate for the analysis. The mean (standard deviation) age of the patients was 34.01 (10.43) years, ranged from infancy to 74 years. Table1 il-lustrates the characteristics of the study population. There were 1249 patients who developed AIDS, where 292 out of them died from AIDS-related causes (Fig. 2). Other patients, who were alive or lost to follow up at the end of the study, were considered to be censored.
The majority of the HIV-positive patients were male (77.55%) and aged 25–44 years (73.1%), single (40.37%), less-educated (92.66%). In addition, 53.09% of them were smokers, 50.24% were drug abusers and about 60% of them had a history of being in prison. Also, about 10.54% of the patients co-infected with TB and 41.53% of them had used antiretroviral therapy.
Implementation
To implement the two tree-based methods of MSRSF and MSRIST, the shared tuning parameters like the minimum number of events in terminal nodes were fixed (to make fair comparisons). Therefore, as suggested by [22], the integer part of the square root of the num-ber of covariates was used forK(the number of variables at each splitting). Moreover, the minimal number of events in each terminal node for all transitions was set to 6. For MSRSF, the forest consisted of 1000 trees. The log-rank splitting rule was used for MSRSF. For the MSRIST model, 50 trees (M) were used in each of five imputation cycles. We also fitted the Cox proportional hazards (PH) model with the Lasso penalty where the tuning parameter was determined using 10-fold cross-validation using the“Penalized”package in R [40]. We randomly divided the data set into training and test-ing data sets and repeated the methods 500 times. The models were fitted to the training sets and evaluation criteria were calculated over the test sets.
Results
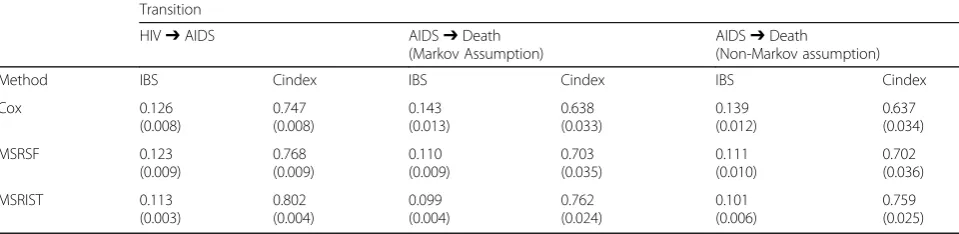
and AIDS →Death in Table 2. As there was no deaths from causes not related to AIDS, the structure of the data was considered as a progressive multistate model.
As shown, the MSRIST outperformed both MSRSF and the Cox models in terms of both criteria (IBS and Cindex). So for the HIV→AIDS transition, the mean (standard deviation) of IBS and Cindex related to MSRIST were 0.113 (0.003) and 0.802 (0.004) respect-ively. In addition for AIDS→Death transition, the mean (standard deviation) of IBS and Cindex related to MSRIST were 0.099 (0.004) and 0.762 (0.004) respect-ively. As suggested by [1], we considered an add-itional situation where sojourn times were considered as covariates to investigate their effect on the survival. However, there was no meaningful change in evalu-ation criteria.
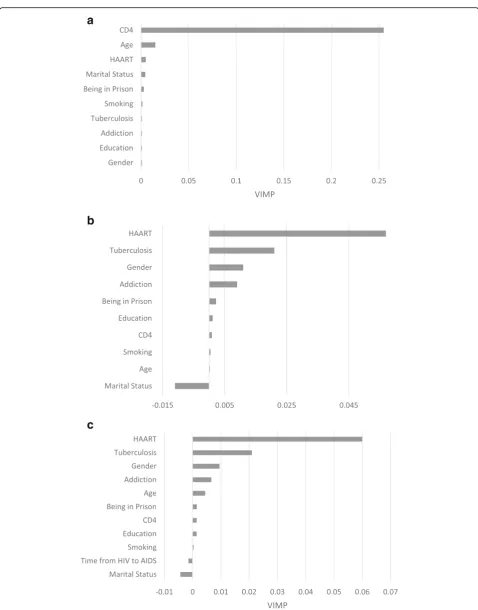
The values of the VIMP were calculated. The most predictive variables for the present study were defined as those whose VIMP (averaged over the forest) were greater. As the MSRIST led to better predictive power, we only calculated the VIMP for this model. Figure 3(a) and (b), depicts all variables and plots their VIMP for HIV→AIDS and AIDS →Death tran-sitions, respectively. According to the figure the three top most important variables for time from HIV in-fection to AIDS progression which were baseline CD4 cells count, age and antiretroviral therapy respectively. In addition, for the transition from AIDS to death the three top most important variables were antiretroviral therapy, TB and Gender, respectively. The VIMP of the variables for the setting in which sojourn times were considered as covariates were shown in Fig. 3(c). As seen, the time since HIV→AIDS did not play an important role as a covariate in modeling AIDS →Death transition.
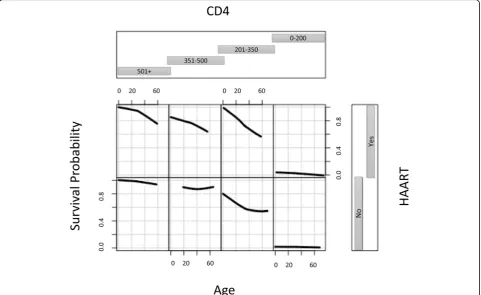
Figures 4 and 5 display the interaction between the three most important variables for both transitions using the MSRIST model and 3 year predicted survival. For the HIV→AIDS transition, patients with the CD4 count smaller than 200 and not using HAART have the worst survival. Survival did not change much for those with CD4 count > 500. According to Fig.5, the worst survival (for AIDS →Death) is related to men who have TB and are not using HAART.
Discussion
There are so many diseases which include intermediate events. Multistate models provide an evolving method in survival analyses. In this study, a new multistate survival data analysis was proposed by introducing RSF and RIST methods into the multistate modeling framework. Appli-cation of the MSRIST approach provides an alternative way to build a risk prediction model while preventing Fig. 2The structure of the application and corresponding
sample sizes
Table 1Characteristics of the study population infected with the HIV virus
Variables Number Percent
Gender
Female 505 22.45
Male 1744 77.55
Age group (year)
1–24 260 11.60
25–44 1639 73.10
45–74 343 15.29
Marital status
Single 874 40.37
Married 852 39.35
Divorced 330 15.24
Widow 109 5.03
Education level
High (academic) 147 7.34
Low (school) 1856 92.66
Being in prison
No 899 39.97
Yes 1350 60.03
Smoker
No 933 46.91
Yes 1056 53.09
Drug abuse
No 1119 49.75
Yes 1130 50.24
Tuberculosis infection
No 2012 89.46
Yes 237 10.54
Antiretroviral therapy
No 1315 58.47
Yes 934 41.53
Baseline CD4 count (cells/mm3)
500+ 417 21.55
351–500 296 15.30
201–350 415 21.45
the imposition of parametric or semi-parametric con-straints on the underlying distributions. Moreover, this method provides a way to automatically address high-level interactions and higher-order terms in vari-ables for different transitions of the disease process while allowing accurate prediction [41].
We applied MSRIST to identify important prognostic factors affecting duration of time to two states in HIV-infected patients (HIV→AIDS and AIDS→Death; a progressive multistate model). Several risk factors strongly associated with survival time of transitions to both states (AIDS and Death) were identified (HIV→ AIDS and AIDS→Death). Among them, MSRIST identi-fied baseline CD4 count, age and antiretroviral therapy as the top three most important predictors of survival for the duration of time from HIV diagnosis to AIDS progression and antiretroviral therapy, TB and gender for the duration of time from AIDS diagnosis to death.
It was shown that the baseline CD4 count is the top first important predictor of progression to AIDS. The results suggest that predicted 3-year survival was dramatically diminished for the patients who had a CD4 cell count less than 200 cells/mm3 compared to other levels. Several epidemiological studies have shown an increase in the risk of HIV/TB coinfection as the CD4 cell count decreases [39, 42, 43]. High levels of CD4 cell count (over 500 cells/mm3) re-duces TB-related mortality among HIV-positive people as well as those not co-infected with TB and therefore it plays an important role in the incidence of HIV/TB co-infection [44]. Age was the second most important variable for the HIV→AIDS transi-tion. According to epidemiological studies, patients aged 50 years or over are at a higher risk of progres-sion to AIDS compared to younger patients (based on the Cox model) [39, 45–47].
A leading preventable cause of death among people living with HIV is TB [48]. According to our find-ings, time to transitions from AIDS to death for an HIV-infected patient was highly associated with TB co-infection and the results showed that it plays an
important role in AIDS-related deaths. This prognos-tic factor was the second top most important variable for progression from AIDS to AIDS-related deaths. The epidemiological studies confirmed this finding [38, 39, 49]. Therefore, the importance of treatment of TB in HIV infected people is revealed by this evi-dence. It was also shown that HAART plays an im-portant role in survival of HIV-infected patients in both transitions. This effect was not shown in the traditional Cox model in the previously published paper on this dataset [39]. According to the results, using antiretroviral therapy increases 3-year survival
of the patients for AIDS progression and
AIDS-related deaths considerably. It was the third top most important variable for AIDS progression and the top most important variable for progression from AIDS to death. This finding is in agreement with several studies [41, 50, 51].
The present study was conducted based on a large data-set and the results can be generalized to the Iranian HIV-infected population. The effect of several predictors on AIDS progression and AIDS-related deaths, in a high-middle-income country, was evident [39]. This kind of information may help establish intervention measures to suppress the progression of HIV to AIDS and to reduce the risk of death among HIV-positive patients [39].
We adapted two newly developed data mining tech-nique (RSF and RIST) for multistate models (MSRSF and MSRIST) to identify important risk factors in two different stages of the disease. Several studies con-firmed RSF’s promising performance in survival ana-lysis compared with traditional Cox proportional hazards model [26, 27, 41]. Zhu and Kosorok [24] also showed that RIST outperforms RSF and the Cox model in classical survival data settings (with just one event of interest), and they have provided a detailed discussion about why RIST works. In the present study, it was also shown that the proposed method based on RIST works in multistate data analysis as well. The usual multistate regression methods are Table 2Integrated Brier score (IBS) and Cindex values for three methods (Cox, MSRIST and MSRSF) over 500 repetitions
Transition
HIV➔AIDS AIDS➔Death
(Markov Assumption)
AIDS➔Death
(Non-Markov assumption)
Method IBS Cindex IBS Cindex IBS Cindex
a
b
c
dependent on the Markov assumption which can be restrictive. In the proposed methodology, handling the non-Markov setting is straightforward. To this end, one should consider transition times as covariates which provide researchers with the ability to account for time-varying effects of other covariates. Taking into account the transition times may also provide a test to check the Markov assumption. If the value of the variable importance is large, it could be con-cluded that the Markov assumption does not hold. The other advantage of the proposed method is that it can take into account nonlinear effects of the co-variates in each state as well as high order interaction between them. Therefore, a flexible functional form for the covariates is considered which can be easily uncover highly complex interrelationships between variables [23, 52]. The proposed method can be easily used in complex multistate data settings. MSRIST preserves information of the censored observations through computing the conditional survival function and improves the model prediction by using the up-dated conditional failure information. The main ad-vantage of the MSRIST model is its tree-based model building. This is because of the fact that larger trees
are grown by using the whole training data instead of using bootstrapped samples and there are more observed events (by imputing the survival time of censored observations) to create deeper trees. The overfitting issue is also avoided by the diversity estab-lished through randomness in imputation steps [24]. Moreover, the MSRIST is more nonparametric, re-quiring weaker model assumptions. In spite of these benefits for the MSRIST model, there are some draw-backs for the presented model. For example, it is more variable than parametric approaches and inter-pretation of the model can be challenging. It is sug-gested that the performance of the proposed method is investigated in other datasets.
Future Research
Recently, joint modeling of a longitudinal response process and a time-to-event outcome has gained consid-erable attention and it is an open research area. A com-mon objective in these studies is to characterize the relationship between two outcomes simultaneously. A potential promising extension of the model proposed here is to introduce the RIST/MSRIST into joint modeling.
Conclusions
We proposed a new strategy for multi-state frame work modelling and investigated the performance of the method for modeling the intermediate event. We showed that this new method outperformed the classical Cox regression model as well as our other proposed method based on random survival forest. Data mining techniques can be used as a useful tool in the multi-state modeling context. Further investigations are needed with other data sets.
Abbreviations
AIDS:Acquired immunodeficiency syndrome; Cindex: Concordance index; ERMT: Extremely randomized multistate trees; HAART/ART: Highly active antiretroviral therapy;HIV: Human immunodeficiency virus; MSRIST: Multistate recursively imputed survival trees; MSRSF: Multi-state random survival Forest;
NRTIs: Nucleoside reverse transcriptase inhibitors; OOB: Out-of-bag; RIST: Recursively imputed survival trees; RSF: Random survival Forest; TB: Tubercolosis
Acknowledgements
We would like to appreciate the Vice-chancellor of Education for technical support and the Vice-chancellor of Research and Technology of Hamadan University of Medical Sciences for their approval and support of this work. The first author also would like to thank Dr. Jalal Poorolajal for providing the data set used.
Funding
This study was partially founded by Hamadan University of medical Science.
Availability of data and materials
The datasets used and/or analyzed during the current study are available from the corresponding author on reasonable request.
Authors’contributions
MK and LT conceived the research topic. LT, OH, MK and MS explored that idea, performed the statistical analysis and drafted the manuscript. All authors read and approved the final manuscript.
Ethics approval and consent to participate
This study was approved by the Ethics committee of Hamadan University of Medical Science. The data were extracted innocently from an HIV data registry.
Consent for publication
Not applicable.
Competing interests
The authors declare that they have no competing interests.
Publisher’s Note
Springer Nature remains neutral with regard to jurisdictional claims in published maps and institutional affiliations.
Author details
1Department of Biostatistics, School of Public Health, Modeling of
Noncommunicable Diseases Research Center, Hamadan University of Medical Sciences, Hamadan 65175-4171, Iran.2Department of Biostatistics,
Department of Statistics and Operations Research, University of North Carolina at Chapel Hill, Chapel Hill, USA.3Department of Statistics, Bu-Ali Sina
University, Hamadan, Iran.4Department of Science, Hamedan University of
Technology, Hamedan 65156, Iran.
Received: 5 May 2018 Accepted: 30 October 2018
References
1. Meier-Hirmer C, Schumacher M. Multi-state model for studying an intermediate event using time-dependent covariates: application to breast cancer. BMC Med Res Methodol. 2013;13(1):80.
2. Shu Y, Klein JP. Additive hazards Markov regression models illustrated with bone marrow transplant data. Biometrika. 2005;92(2):283–301.
3. de Wreede LC, Fiocco M, Putter H. Mstate: an R package for the analysis of competing risks and multi-state models. J Stat Softw. 2011;38(7):1–30. 4. Aalen OO, Johansen S. An empirical transition matrix for non-homogeneous
Markov chains based on censored observations. Scand J Stat. 1978;5(3):141– 50.
5. Alioum A, Commenges D. MKVPCI: a computer program for Markov models with piecewise constant intensities and covariates. Comput Methods Prog Biomed. 2001;64(2):109–19.
6. Begg CB, Larson M. A study of the use of the probability-of-being-in-response function as a summary of tumor probability-of-being-in-response data. Biometrics. 1982; 38(1):59–66.
7. Kalbfleisch J, Lawless JF. The analysis of panel data under a Markov assumption. J Am Stat Assoc. 1985;80(392):863–71.
8. Marshall G, Jones RH. Multi-state models and diabetic retinopathy. Stat Med. 1995;14(18):1975–83.
9. Pérez-Ocón R, Ruiz-Castro JE, Gámiz-Pérez ML. Non-homogeneous Markov models in the analysis of survival after breast cancer. J R Stat Soc: Ser C: Appl Stat. 2001;50(1):111–24.
10. Сox D. Regression models and life-tables (with discussion). J R Stat Soc Ser B. 1972;34:187–220.
11. Andersen PK. Multistate models in survival analysis: a study of nephropathy and mortality in diabetes. Stat Med. 1988;7(6):661–70.
12. Andersen PK, Esbjerg S, Sørensen TI. Multi-state models for bleeding episodes and mortality in liver cirrhosis. Stat Med. 2000;19(4):587–99. 13. Andersen PK, Hansen LS, Keiding N. Non-and semi-parametric estimation of
transition probabilities from censored observation of a non-homogeneous Markov process. Scand J Stat. 1991;18(2):153–67.
14. Klein JP, Keiding N, Copelan EA. Plotting summary predictions in multistate survival models: probabilities of relapse and death in remission for bone marrow transplantation patients. Stat Med. 2008;2(3):841–60.
15. Klein JP, Qian C. Modeling multistate survival illustrated in bone marrow transplantation. Division of Biostatistics, University of Wisconsin; 1996. Available athttp://citeseerx.ist.psu.edu/viewdoc/download?doi=10.1.1.554. 2907&rep=rep1&type=pdf. Accessed 9 Sept 2004.
16. Aalen OO, Borgan Ø, Fekjær H. Covariate adjustment of event histories estimated from Markov chains: the additive approach. Biometrics. 2001;57(4):993–1001. 17. Ishwaran H, Kogalur UB. Consistency of random survival forests. Statistics &
probability letters. 2010;80(13):1056–64.
18. Hothorn T, Lausen B, Benner A, Radespiel-Tröger M. Bagging survival trees. Stat Med. 2004;23(1):77–91.
19. Hothorn T, Bühlmann P, Dudoit S, Molinaro A, Van Der Laan MJ. Survival ensembles. Biostatistics. 2005;7(3):355–73.
20. Schmid M, Küchenhoff H, Hoerauf A, Tutz G. A survival tree method for the analysis of discrete event times in clinical and epidemiological studies. Stat Med. 2016;35(5):734–51.
21. Van Belle V, Pelckmans K, Suykens JA, Van Huffel S. In: SVM S, editor. a practical scalable algorithm. Belgium: ESANN; 2008 23-25 April 2008. 22. Ishwaran H, Kogalur UB, Blackstone EH, Lauer MS. Random survival forests.
The annals of applied statistics. 2008;2(3):841–60.
23. Ishwaran H, Kogalur UB, Blackstone EH, Lauer MS. Random survival forests. The annals of applied statistics. 2008:841–60.
24. Zhu R, Kosorok MR. Recursively imputed survival trees. J Am Stat Assoc. 2012;107(497):331–40.
25. Dietrich S. Investigation of the machine learning method random survival Forest as an exploratory analysis tool for the identification of variables associated with disease risks in complex survival data: Berlin; 2016. 26. Hamidi O, Poorolajal J, Farhadian M, Tapak L. Identifying important risk
factors for survival in kidney graft failure patients using random survival forests. Iran J Public Health. 2016;45(1):27.
27. Hsich E, Gorodeski EZ, Blackstone EH, Ishwaran H, Lauer MS. Identifying important risk factors for survival in patient with systolic heart failure using random survival forests. Circulation: Cardiovascular Quality and Outcomes. 2011;4(1):39–45.
28. Marino SR, Lin S, Maiers M, Haagenson M, Spellman S, Klein JP, et al. Identification by random forest method of HLA class I amino acid substitutions associated with lower survival at day 100 in unrelated donor hematopoietic cell transplantation. Bone Marrow Transplant. 2012;47(2):217–26.
29. Putter H, Fiocco M, Geskus R. Tutorial in biostatistics: competing risks and multi-state models. Stat Med. 2007;26(11):2389–430.
30. Meira-Machado L, de Uña-Álvarez J, Cadarso-Suárez C, Andersen PK. Multi-state models for the analysis of time-to-event data. Stat Methods Med Res. 2009;18(2):195–222.
31. Cox DR, Miller HD. The theory of stochastic processes: CRC press; 1977. 32. Andersen PK, Keiding N. Multi-state models for event history analysis. Stat
Methods Med Res. 2002;11(2):91–115.
33. Beyersmann J, Allignol A. Schumacher M. Springer Science & Business Media: Competing risks and multistate models with R. Boca Raton: CRC Press LLC; 2011.
34. Lammens V. Estimating the prediction error in multistate models; 2014. 35. Harrell FE, Lee KL, Mark DB. Multivariable prognostic models: issues in developing models, evaluating assumptions and adequacy, and measuring and reducing errors. Stat Med. 1996;15(4):361–87.
36. World Health Organization. WHO case definitions of HIV for surveillance and revised clinical staging and immunological classification of HIV-related disease in adults and children. 2007.
37. Radfar S, Tayeri K, Namdari TH. Practical guidelines on how to provide consulting services in behavioral disorders centers. Tehran: Ministry of Health and Medical Education; 2009.
38. Mirzaei M, Poorolajal J, Khazaei S, Saatchi M. Survival rate of AIDS disease and mortality in HIV-infected patients in Hamadan, Iran: a registry-based retrospective cohort study (1997–2011). Int J STD AIDS. 2013;24(11):859–66.
39. Hamidi O, Poorolajal J, Sadeghifar M, Abbasi H, Maryanaji Z, Faridi HR, et al. A comparative study of support vector machines and artificial neural networks for predicting precipitation in Iran. Theor Appl Climatol. 2015; 119(3–4):723–31.
40. Goeman JJ, Goeman MJ. penalized R package. R package version 09– 41; 2012.
41. Blanc F-X, Sok T, Laureillard D, Borand L, Rekacewicz C, Nerrienet E, et al. Earlier versus later start of antiretroviral therapy in HIV-infected adults with tuberculosis. N Engl J Med. 2011;365(16):1471–81.
43. Molaeipoor L, Poorolajal J, Mohraz M, Esmailnasab N. Predictors of tuberculosis and human immunodeficiency virus co-infection: a case-control study. Epidemiology and health. 2014;36:e2014024.
44. EuroCoord OIPTotCoOHERiEi. CD4 cell count and the risk of AIDS or death in HIV-infected adults on combination antiretroviral therapy with a suppressed viral load: a longitudinal cohort study from COHERE. PLoS Med. 2012;9(3):e1001194.
45. Bajpai RC, Raj P, Jha UM, Chaturvedi HK, Pandey A. Demographic correlates of survival in adult HIV patients registered at ART centers in Andhra Pradesh, India: a retrospective cohort study. Public Health Research. 2014; 4(1):31–8.
46. Tancredi MV, Waldman EA. Predictors of progression to AIDS after HIV infection diagnosis in the pre-and post-HAART eras in a Brazilian AIDS-free cohort. Trans R Soc Trop Med Hyg. 2014;108(7):408–14.
47. Walsh N, Mijch A, Watson K, Wand H, Fairley CK, McNeil J, et al. HIV treatment outcomes among people who inject drugs in Victoria, Australia. BMC Infect Dis. 2014;14(1):1.
48. WHO policy on collaborative TB/HIV activities. Guidelines for national programmes and other stakeholders. Geneva, Switzerland: WHO/HTM/TB; 2012. p. 2012.
49. Lopez-Gatell H, Cole SR, Margolick JB, Witt MD, Martinson J, Phair JP, et al. Effect of tuberculosis on the survival of HIV-infected men in a country with low TB incidence. AIDS (London, England). 2008;22(14): 1869.
50. Lawn SD, Kranzer K, Wood R. Antiretroviral therapy for control of the HIV-associated tuberculosis epidemic in resource-limited settings. Clin Chest Med. 2009;30(4):685–99.
51. Abdool Karim SS, Naidoo K, Grobler A, Padayatchi N, Baxter C, Gray AL, et al. Integration of antiretroviral therapy with tuberculosis treatment. N Engl J Med. 2011;365(16):1492–501.