Open Access
Research
Quantifying geocode location error using GIS methods
Matthew J Strickland*
†1,2, Csaba Siffel
†1,3, Bennett R Gardner
†1,
Alissa K Berzen
†4and Adolfo Correa
†1Address: 1National Center on Birth Defects and Developmental Disabilities, Centers for Disease Control and Prevention, Atlanta, Georgia, USA, 2Battelle Centers for Public Health Research and Evaluation, Atlanta, Georgia, USA, 3Computer Sciences Corporation, Atlanta, Georgia, USA and 4Agency for Toxic Substances and Disease Registry, Centers for Disease Control and Prevention, Atlanta, Georgia, USA
Email: Matthew J Strickland* - [email protected]; Csaba Siffel - [email protected]; Bennett R Gardner - [email protected]; Alissa K Berzen - [email protected]; Adolfo Correa - [email protected]
* Corresponding author †Equal contributors
Abstract
Background: The Metropolitan Atlanta Congenital Defects Program (MACDP) collects maternal address information at the time of delivery for infants and fetuses with birth defects. These addresses have been geocoded by two independent agencies: (1) the Georgia Division of Public Health Office of Health Information and Policy (OHIP) and (2) a commercial vendor. Geographic information system (GIS) methods were used to quantify uncertainty in the two sets of geocodes using orthoimagery and tax parcel datasets.
Methods: We sampled 599 infants and fetuses with birth defects delivered during 1994–2002 with maternal residence in either Fulton or Gwinnett County. Tax parcel datasets were obtained from the tax assessor's offices of Fulton and Gwinnett County. High-resolution orthoimagery for these counties was acquired from the U.S. Geological Survey. For each of the 599 addresses we attempted to locate the tax parcel corresponding to the maternal address. If the tax parcel was identified the distance and the angle between the geocode and the residence were calculated. We used simulated data to characterize the impact of geocode location error. In each county 5,000 geocodes were generated and assigned their corresponding Census 2000 tract. Each geocode was then displaced at a random angle by a random distance drawn from the distribution of observed geocode location errors. The census tract of the displaced geocode was determined. We repeated this process 5,000 times and report the percentage of geocodes that resolved into incorrect census tracts.
Results: Median location error was less than 100 meters for both OHIP and commercial vendor geocodes; the distribution of angles appeared uniform. Median location error was approximately 35% larger in Gwinnett (a suburban county) relative to Fulton (a county with urban and suburban areas). Location error occasionally caused the simulated geocodes to be displaced into incorrect census tracts; the median percentage of geocodes resolving into incorrect census tracts ranged between 4.5% and 5.3%, depending upon the county and geocoding agency.
Conclusion: Geocode location uncertainty can be estimated using tax parcel databases in a GIS. This approach is a viable alternative to global positioning system field validation of geocodes. Published: 4 April 2007
Environmental Health 2007, 6:10 doi:10.1186/1476-069X-6-10
Received: 17 May 2006 Accepted: 4 April 2007
This article is available from: http://www.ehjournal.net/content/6/1/10
© 2007 Strickland et al; licensee BioMed Central Ltd.
Background
Federal, state, and local public health surveillance systems often collect residential address information as part of their surveillance activities. Prior to spatial statistical anal-yses, residential address information must be geocoded (e.g., latitude and longitude coordinates), a process typi-cally accomplished through the use of electronic street databases [1,2]. Public health applications of geocoded data include defining a study population, linking health outcomes with environmental hazards, and investigating disease clusters. Although the hope is that all geocodes correctly reflect the true geographic location of the addresses, some geocodes are likely inaccurate due to errors in street databases, errors in residential address information, algorithms that permit imperfect address matches (i.e., the "match rate," or how similar the submit-ted address must be to the address in the database), and the distance geocodes are placed from the street centerline [2-5]. There is generally a trade-off between the propor-tion of missing geocodes and geocode accuracy; lenient match rates tend to increase the proportion of successfully geocoded addresses at the expense of geocode accuracy [6]. In addition to carefully collected residential address information, street databases that are current, free of errors, and spatially accurate should help reduce location error [2].
Because geocode inaccuracies can affect spatial analyses, [7] understanding the magnitude of location error in geocoded data is desirable. One approach is to travel to the address location and verify coordinates using a global positioning system (GPS) [1,2,8-10]. Although this approach is accurate it is also resource-intensive, particu-larly when the geographic area of interest is large. Whereas a GPS may be the only viable option for geocoding in remote settings [e.g., [11]], in the U.S. alternative options for geocode validation are generally available, and those overseeing surveillance systems may not wish to, or have the resources to, verify large numbers of addresses using a GPS. In this paper we describe an alternative computer-based method [5] to verify address locations for a sample of birth defect records in metropolitan Atlanta.
Methods
Population and sample
The Metropolitan Atlanta Congenital Defects Program (MACDP) is a population-based birth defects surveillance system operated by Centers for Disease Control and Pre-vention since 1968 [12]. MACDP actively ascertains infants and fetuses with birth defects born to mothers residing in one of five metropolitan Atlanta counties at delivery (Clayton, Cobb, DeKalb, Fulton, and Gwinnett). The address of the maternal residence is recorded for each case and is subsequently sent to a commercial vendor for geocoding. Independent of MACDP geocoding efforts, the
Office of Health Information and Policy (OHIP), Georgia Division of Public Health, has geocoded the live birth cohort in Georgia since 1994.
The initial phase of geocoding is similar for both the com-mercial vendor and OHIP. Although the tolerance for accepting imperfect matches may differ, both agencies begin by comparing (in batch mode) submitted addresses with addresses in a street database. The commercial ven-dor uses street databases distributed by Geographic Data Technology (now Tele Atlas), whereas OHIP uses street databases distributed by Group 1 software. Street data-bases contain many road segments; each segment has two address ranges (one side of the road has an even bered address range and the other side has an odd num-bered address range). If the submitted address falls within a range then a geocode is generated by interpolating between the two known addresses at opposite ends of the road segment. When a street-level match cannot be achieved the software assigns a geocode corresponding to a polygon centroid. The commercial vendor accepts cen-troid matches up to the 5-digit ZIP code level and OHIP accepts centroid matches up to the census tract level. After batch geocoding, the commercial vendor manually com-pares each address not successfully geocoded to a list of potential addresses. If a potential address is judged to be a reasonable match the record is manually geocoded. OHIP performs a spatial imputation on addresses that are not geocoded successfully [13]. Imputation begins by esti-mating the county for all remaining addresses. Using vital records data, the expected number of births by race and census tract is calculated for each county. Addresses are imputed into census tracts that have less than the expected number of geocoded records and are assigned the corre-sponding centroid.
Geographic data
A "shapefile" is a set of computer files used to store geo-graphic information (e.g., census tract boundaries) and tables of attributes associated with the geographic infor-mation (e.g., census tract housing and demographic char-acteristics) [14]. Shapefiles can be manipulated using a geographic information system (GIS); ArcView 8.3 (ESRI, Redlands, CA) was used in this project. Tax parcel shape-files were obtained from the Fulton and Gwinnett County tax assessor's offices. These shapefiles contain polygons corresponding to the location and dimensions of each tax-able land parcel in the county. The address of each parcel is stored in its attribute table.
We also obtained high-resolution (0.3 meter resolution per pixel) digital orthoimages from the U.S. Geological Survey (USGS). An orthoimage is a remotely sensed dig-ital photograph of the earth's surface that has been math-ematically manipulated to minimize distortion due to terrain relief and sensor orientation [15]. USGS estimates that the design accuracy of its orthoimages does not exceed a root mean squared error of 3-meters in diagonal [15].
Location error assessment
For each of the 665 records we attempted to identify the tax parcel corresponding to the maternal address. When the parcel was identified, a point was placed on the resi-dence located within the parcel. We elected not to place points when tax parcels contained many buildings (i.e., large apartment complexes) because there was no obvious location for point placement. During validation, we iden-tified a subset of records that presumably had the incor-rect county recorded in the MACDP database. We examined these addresses further using the U.S. Postal Service online lookup database to infer the correct county. After excluding records with incorrect county codes (n = 66), the final sample consisted of 599 records.
The geographic coordinates of the placed points were determined using ArcView and represent the "gold stand-ard." For each validated address, we calculated both the distance and the angle between the gold standard and each of the two geocodes applying a spherical earth model [16]. We assumed a constant elevation of 300 meters above sea level. Figure 1 displays tax parcel data overlain on orthoimagery; we define location error as the distance between the geocode and the gold standard (residence). We report the empirical cumulative distribution of loca-tion errors for both the OHIP and commercial vendor geocodes. Rose plots were generated to inspect whether the distribution of angles appeared uniform, and Rayleigh tests were performed to evaluate the null hypothesis of a uniform circular distribution of angles. We created rose plots by stratifying addresses according to the angle of the
location error. Each stratum, or "bin," correspond to a 15° increment (i.e., 0°-15°, 15°-30°, etc.). Each bin has its own "petal," which varies in size according to the number of addresses within the bin.
Census tract point-in-polygon simulations
To characterize the impact of geocode location error on census tract assignment we generated 5,000 random geoc-odes within each county and used a point-in-polygon rou-tine to determine the Census 2000 tract for each geocode. Each geocode was then displaced at a random angle from a uniform (0, 2π) distribution by a random distance drawn from an empirical distribution of geocode location errors (as reported in the Results). We then determined the census tract for each displaced geocode. We conducted 5,000 such simulations for each geocoding agency within each county and we report the percentage of geocodes that resolved into the incorrect census tract (median, 2.5%, and 97.5% of the 5,000 simulations). All simulations were performed using the Universal Transverse Mercator (UTM) Zone 16 North map projection with the software package R 2.4.0 (R Core Development Team).
Results
The commercial vendor and OHIP created address-level geocodes for 96.0% and 91.7% of the sample, respectively (Table 1). Although 435 addresses included in the sample were located (72.6%), gold standard points were placed for only 376 addresses (62.8%). Points were not placed for 59 addresses (9.8%) because the parcels contained large, multi-unit housing complexes.
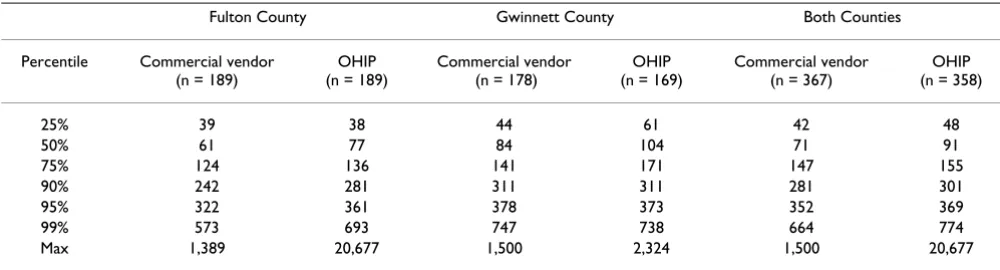
Selected percentiles from the empirical cumulative distri-butions of location error, stratified by county, are pre-sented for both OHIP and commercial vendor geocodes in Table 2. Median location error was 71 meters for the commercial vendor and 91 meters for OHIP geocodes. Median location error was approximately 35% greater in Gwinnett County than in Fulton County. This finding was anticipated, as Gwinnett County is predominantly subur-ban whereas Fulton County has a mix of ursubur-ban and sub-urban areas. Rose plots (Figure 2) were constructed by placing each record into one of 24 15° bins according to the angle of the location error. Inspection of the rose plots did not suggest systematic bias in the direction of the geocode relative to the gold standard. There was no strong evidence to reject the null hypothesis of a uniform circular distribution. Rayleigh tests, which were performed for each geocoding agency (data pooled over counties) as well as for each combination of county and geocoding agency, were not significant (all p-values > 0.2).
Tax Parcel Data Overlain on Orthoimagery
Figure 1
County using the commercial vendor location error caused 4.5% (4.0%, 5.0%) of the randomly generated geocodes to be placed into incorrect census tracts. OHIP location error caused incorrect census tract assignment for 5.3% (4.8%, 5.9%) of the geocodes in Fulton County. Results were similar for Gwinnett County; 4.8% (4.3%, 5.4%) of geocodes were placed into incorrect census tracts because of commercial vendor location error, and OHIP location error caused 5.2% (4.7%, 5.8%) of geocodes to be assigned the incorrect census tract.
Discussion
Location error is intrinsic to both the OHIP and commer-cial vendor geocodes. Interpolation is likely a major com-ponent of this error, as interpolation is necessary whenever the submitted address is not demarcated on the street map. Because only a small proportion of addresses are demarcated, interpolation occurs frequently. Observed differences in geocoding success and in location error magnitude between the commercial vendor and OHIP geocodes may be due to a number of factors, including the quality of the street database, the correct-ness of the submitted addresses, the ability of the software to match submitted addresses with addresses in the data-base (e.g., recognize that "Cir" is short for "Circle"), the tolerance for geocoding imperfect matches (i.e., the match rate), and the methodology used to geocode addresses that were not geocoded in batch mode. Although we were unable to quantify the relative contribution of each of these factors, it is likely that much of the difference in the percentage of addresses successfully geocoded is attributa-ble to the manual address matching performed by the commercial vendor.
Although the aim of our study was to estimate the distri-butions of geocode location error, there are additional errors to consider when analyzing geocoded address data. The addresses unsuccessfully geocoded by the commercial vendor and/or OHIP (and therefore excluded from analy-ses) may result in selection bias. If the probability that a geocode is missing is differential across space then this can bias the relationship between spatially-varying
covari-ates and disease incidence [17,18]. Furthermore, a high proportion of successfully geocoded addresses, although reassuring, does not preclude this selection bias. An addi-tional source of error arises when spurious geocodes are created from fictitious addresses. This can occur when an imperfectly recorded address happens to fall within a range of viable addresses.
Our study design excluded discordant addresses in the linked MACDP and OHIP database. This approach ensured that comparisons between the two sets of geoco-des were fair and presumably reduced the number of low quality addresses that were validated (an address that is identical in both the MACDP and OHIP databases is likely to be correct). This design, however, may have underesti-mated the true distribution of geocode location error for both commercial vendor and OHIP geocodes. Many imperfect addresses, which were excluded from our study (because the MACDP and OHIP addresses were discord-ant), were nevertheless geocoded to the address-level by both agencies. The distribution of geocode location error for these addresses may be large relative to the distribu-tion for the set of addresses selected for validadistribu-tion. Addi-tionally, the 164 addresses selected for validation that we were unable to locate in the tax parcels (Table 1) fre-quently had address-level geocodes. Although it is proba-ble that many of these addresses correspond to apartment complex roads not delineated in the shapefile, the true distribution of geocode location error for these geocodes may be larger than the distributions presented in Table 2. We used a simulation-based approach to evaluate the potential impact of location error on census tract assign-ment. The percentage of geocodes displaced into incorrect census tracts was similar for Fulton County and Gwinnett County, even though median location error was approxi-mately 35% larger in Gwinnett County (Table 2). This finding is likely due to census tract size (tracts tend to be larger in the predominantly suburban Gwinnett County). A larger location error is needed to displace a geocode out-side of its original census tract in Gwinnett.
Table 1: Frequencies of Geocoding Success and Geocode Validation Outcomes for 599 Selected Addresses, by County.
Fulton County (n = 339) Gwinnett County (n = 260) Both Counties (n = 599)
n % n % n %
Address-level geocodes
OHIP 321 94.7 228 87.7 549 91.7
Commercial vendor 324 95.6 251 96.5 575 96.0
Addresses located using GIS
House/small multi-unit complex 194 57.2 182 70.0 376 62.8 Moderate/large multi-unit complex 41 12.1 18 6.9 59 9.8
Presumably, the ramifications of geocode location error will vary depending upon the study design. For example, in air pollution epidemiology, designs using ambient air quality monitors to assign pollution levels to cohort members [e.g., [19]] may not be strongly impacted by the
magnitude of geocode location error reported in Table 2, whereas fine-scale studies of traffic proximity [e.g., [20]] may be strongly impacted by this magnitude of location error. In both of these settings, however, an empirical esti-mate of geocode location error, specific to the local setting in which the study was conducted, can be used to formally evaluate the consequences of this source of measurement error on epidemiologic results. Tenuous speculations about measurement error can be replaced with inferences from more rigorous statistical approaches.
Relative to street databases, tax parcel shapefiles offer two main advantages: 1) fictitious addresses that happen to fall within ranges of legitimate addresses are not geoco-ded, and 2) there is no need to interpolate between address ranges. Tax parcels, however, have certain disad-vantages as well. They are created to assist the county tax assessor rather than to geocode addresses. Accordingly, an apartment complex encompassing numerous roads appears as one polygon because this is the taxable parcel. We were unable to locate 164 addresses (Table 1), and it is probable that many of these addresses correspond to apartment complex roads not delineated in the shapefile. An additional disadvantage is the limited availability of tax parcel shapefiles (as of June 2005 only two of the five counties covered by MACDP had tax parcel shapefiles). Some GIS software packages offer capabilities for batch parcel geocoding (e.g., the "One Field" style of locator in ArcGIS); as tax parcel shapefiles become increasingly available parcel-based geocoding may become more feasi-ble. Building "footprints," where polygons in the shape-file correspond to building dimensions, also offer possibilities for geocoding and geocode validation. Cost is also an important consideration – whereas 25–30 addresses per hour can be validated using tax parcels, online commercial geocoding services offer near real-time geocoding for less than two cents per address. Tax parcels are therefore not a viable alternative to batch street data-base geocoding. Tax parcel validation, however, is more efficient than GPS field validation. Although the number of addresses per hour that can be field validated will vary greatly depending upon address proximity, it would be nearly impossible to field validate 25 addresses per hour in Atlanta. Past experiences at MACDP suggest rates of 5– 10 addresses per hour are more typical.
Applications of tax parcel datasets in environmental health extend beyond geocode generation and validation. For example, tax parcel datasets and housing characteris-tics have been combined to identify high priority regions of lead poisoning risk [21]. The 2004 Olympic and Para Olympic environmental health inspection program [22] utilized tax parcel data in their GIS applications. Tax par-cel datasets are also routinely used in urban planning, and
Distributions of Geocode Location Error Angles
Figure 2
some investigators have used tax parcels to model the environmental impact of urban development [23].
Conclusion
Geocode uncertainty can be quantified using tax parcel datasets, high resolution orthoimagery, and GIS. In met-ropolitan Atlanta, the median geocode location error was less than 100 meters for both the OHIP and commercial vendor geocodes, and there was no evidence of systematic bias in the angle of the location error. Geocode location error caused approximately 5% of the randomly generated geocodes to be placed into the incorrect census tract. We contend that the motivation for understanding the distri-bution of geocode location error parallels the motivation for assessing disease misclassification or exposure meas-urement error in epidemiological studies. Geocodes have an important role in environmental health research and surveillance, as they are frequently used to define the study population and to link health data with environ-mental hazards. Furthermore, many spatial statistical methods use geocodes, and the validity of these approaches may be compromised by location error. Fur-ther work is needed to evaluate the impact of location error on statistical methods and surveillance applications.
Competing interests
The author(s) declare that they have no competing inter-ests.
Authors' contributions
MJS conducted the addresses validation and drafted the manuscript. CS helped design the study, draft the manu-script, and is responsible for the maintenance of MACDP geocoded data. BRG examined a subset of records to verify whether the addresses fell within the counties and assisted with the creation of Figures. AKB was responsible for obtaining the tax parcel datasets, working with the dataset owners to ensure appropriate use of the datasets, and assisting MJS and CS with GIS activities. AC helped design the study and participated in its coordination. All authors read and approved the final manuscript.
Acknowledgements
We thank Don Gambrell of NCBDDD, CDC, for his assistance in linking the OHIP and commercial vendor databases. Thanks to Andy Dent and Steve Bullard of ATSDR, CDC, for their assistance in managing and access-ing the orthoimagery and tax parcel datasets. We also thank Elaine Hallisey of OHIP for her helpful comments on this manuscript.
This project received financial support from the Environmental Health Tracking Branch, NCEH, CDC.
The findings and conclusions in this report have not been formally dissem-inated by CDC and should not be construed to represent any agency determination or policy.
References
1. Ward MH, Nuckols JR, Giglierano J, Bonner MR, Wolter C, Airola M, Mix W, Colt J, Hartge P: Positional accuracy of two methods of geocoding. Epidemiology 2005, 16:542-547.
2. Karimi HA, Durcik M, Rasdorf W: Evaluation of uncertainties associated with geocoding techniques. Comput-Aided Civ Inf
2004, 19:170-185.
3. Gilboa SM, Mendola P, Olshan AF, Harness C, Loomis D, Langlois PH, Savitz DA, Herring AH: Comparison of residential geocoding methods in population-based study of air quality and birth defects. Environ Res 2006, 101:256-262.
4. McElroy JA, Remington PL, Trentham-Dietz A, Robert SA, Newcomb PA: Geocoding addresses from a large population-based study: lessons learned. Epidemiology 2003, 14:399-407.
5. Cayo MR, Talbot TO: Positional error in automated geocoding of residential addresses. Int J Health Geogr 2003, 2:10.
6. Whitsel EA, Quibrera PM, Smith RL, Catellier DJ, Liao D, Henley AC, Heiss G: Accuracy of commercial geocoding: assessment and implications. Epidemiol Perspect Innov 2006, 3:8.
7. Burra T, Jerrett M, Burnett RT, Anderson M: Conceptual and prac-tical issues in the detection of local disease clusters: a study of mortality in Hamilton, Ontario. Can Geogr 2002, 46:160-171. 8. Bonner MR, Han D, Nie J, Rogerson P, Vena JE, Freudenheim JL: Posi-tional accuracy of geocoded addresses in epidemiologic research. Epidemiology 2003, 14:408-412.
9. Troped PJ, Saunders RP, Pate RR, Reininger B, Ureda JR, Thompson SJ: Associations between self-reported and objective physical environmental factors and use of a community rail-trail. Prev Med 2001, 32:191-200.
10. Krieger N, Waterman P, Lemieux K, Zierler S, Hogan JW: On the wrong side of the tracts? Evaluating the accuracy of geocod-ing in public health research. Am J Public Health 2001,
91:1114-1116.
11. Boyd HA, Waller LA, Flanders WD, Beach MJ, Sivilus JS, Lovince R, Lammie PJ, Addiss DG: Community- and individual-level deter-minants of Wuchereria Bancrofti infection in Leogane Com-mune, Hati. Am J Trop Med Hyg 2004, 70:266-272.
12. Correa-Villasenor A, Cragan J, Kucik J, O'Leary L, Siffel C, Williams L:
The Metropolitan Atlanta Congenital Defects Program: 35 Table 2: Selected Percentiles From the Empirical Cumulative Distributions of Location Error. All distances reported in meters.
Fulton County Gwinnett County Both Counties
Percentile Commercial vendor (n = 189)
OHIP (n = 189)
Commercial vendor (n = 178)
OHIP (n = 169)
Commercial vendor (n = 367)
OHIP (n = 358)
25% 39 38 44 61 42 48
50% 61 77 84 104 71 91
75% 124 136 141 171 147 155
90% 242 281 311 311 281 301
95% 322 361 378 373 352 369
99% 573 693 747 738 664 774
Publish with BioMed Central and every scientist can read your work free of charge "BioMed Central will be the most significant development for disseminating the results of biomedical researc h in our lifetime."
Sir Paul Nurse, Cancer Research UK
Your research papers will be:
available free of charge to the entire biomedical community
peer reviewed and published immediately upon acceptance
cited in PubMed and archived on PubMed Central
yours — you keep the copyright
Submit your manuscript here:
http://www.biomedcentral.com/info/publishing_adv.asp
BioMedcentral
years of birth defects surveillance at the Centers for Disease Control and Prevention. Birth Defects Res A 2003, 67:617-624. 13. Office of Health Information and Policy, Georgia Division of
Public Health, Spatial Imputation Algorithm [http:// health.state.ga.us/pdfs/ohip/adgsi.60101.pdf]
14. ESRI Shapefile Technical Description [http://www.esri.com/ library/whitepapers/pdfs/shapefile.pdf]
15. USGS. U.S. Geographic Survey High Resolution Orthoim-agery metadata Atlanta, GA. 2003.
16. Sinnott R: Virtues of the Haversine. Sky Telescope 1984, 68:159. 17. Krieger N, Waterman P, Chen JT, Soobader MJ, Subramanian SV,
Carson R: Zip code caveat: bias due to spatiotemporal mis-matches between zip codes and US census-defined geo-graphic areas – the Public Health Disparities Geocoding Project. Am J Public Health 2002, 92:1100-1102.
18. Oliver MN, Matthews KA, Siadaty M, Hauck FR, Pickle LW: Geo-graphic bias related to geocoding in epidemiologic studies.
Int J Health Geogr 2005, 4:29.
19. Gilboa SM, Mendola P, Olshan AF, Langlois PH, Savitz DA, Loomis D, Herring AH, Fixler DE: Relation between ambient air quality and selected birth defects, Seven County Study, Texas, 1997–2000. Am J Epidemiol 2005, 162:238-252.
20. English P, Neutra R, Scalf R, Sullivan M, Waller L, Zhu L: Examining associations between childhood asthma and traffic flow using a geographic information system. Environ Health Perspect 1999,
107:761-767.
21. Miranda ML, Dolinoy DC, Overstreet MA: Mapping for preven-tion: GIS models for directing childhood lead poisoning pre-vention programs. Environ Health Perspect 2002, 110:947-953. 22. Hadjichristodoulou C, Soteriades ES, Kolonia V, Falagas ME,
Pantelo-poulos E, Panagakos G, Mouchtouri V, Kremastinou J: Methodolog-ical aspects of a GIS-based environmental health inspection program used in the Athens 2004 Olympic and Para Olympic Games. BMC Public Health 2005, 5:93.