Open Access
Methodology
A rapid biosensor-based method for quantification of free and
glucose-conjugated salicylic acid
Christopher T DeFraia
1, Eric A Schmelz
2and Zhonglin Mou*
1Address: 1Department of Microbiology and Cell Science, University of Florida, P.O. Box 110700, Gainesville, FL, 32611, USA and 2Center for Medical, Agricultural and Veterinary Entomology, United States Department of Agriculture, Agricultural Research Service, 1700 SW 23rd Drive, Gainesville, FL 32608, USA
Email: Christopher T DeFraia - [email protected]; Eric A Schmelz - [email protected]; Zhonglin Mou* - [email protected] * Corresponding author
Abstract
Background: Salicylic acid (SA) is an important signalling molecule in plant defenses against biotrophic pathogens. It is also involved in several other processes such as heat production, flowering, and germination. SA exists in the plant as free SA and as an inert glucose conjugate (salicylic acid 2-O-β-D-glucoside or SAG). Recently, Huang et al. developed a bacterial biosensor that responds to free SA but not SAG, designated as Acinetobacter sp. ADPWH_lux. In this paper we describe an improved methodology for Acinetobacter sp. ADPWH_lux-based free SA quantification, enabling high-throughput analysis, and present an approach for the quantification of SAG from crude plant extracts.
Results: On the basis of the original biosensor-based method, we optimized extraction and quantification. SAG content was determined by treating crude extracts with β-glucosidase, then measuring the released free SA with the biosensor. β-glucosidase treatment released more SA in acetate buffer extract than in Luria-Bertani (LB) extract, while enzymatic hydrolysis in either solution released more free SA than acid hydrolysis. The biosensor-based method detected higher amounts of SA in pathogen-infected plants than did a GC/MS-based method. SA quantification of control and pathogen-treated wild-type and sid2 (SA induction-deficient) plants demonstrated the efficacy of the method described. Using the methods detailed here, we were able to detect as little as 0.28 μg SA/g FW. Samples typically had a standard deviation of up to 25% of the mean.
Conclusion: The ability of Acinetobacter sp. ADPWH_lux to detect SA in a complex mixture, combined with the enzymatic hydrolysis of SAG in crude extract, allowed the development of a simple, rapid, and inexpensive method to simultaneously measure free and glucose-conjugated SA. This approach is amenable to a high-throughput format, which would further reduce the cost and time required for biosensor-based SA quantification. Possible applications of this approach include characterization of enzymes involved in SA metabolism, analysis of temporal changes in SA levels, and isolation of mutants with aberrant SA accumulation.
Published: 31 December 2008
Plant Methods 2008, 4:28 doi:10.1186/1746-4811-4-28
Received: 21 July 2008 Accepted: 31 December 2008
This article is available from: http://www.plantmethods.com/content/4/1/28
© 2008 DeFraia et al; licensee BioMed Central Ltd.
Background
The plant signal molecule salicylic acid (SA) has been shown to play a role in several physiological processes, including heat production, flowering, germination and pathogen resistance [1-5]. In the last two decades, its role in pathogen resistance has been studied extensively [6,7]. Treatment with SA confers resistance to a variety of bio-trophic pathogens [5,8], and pathogen infection causes the accumulation of SA [9,10]. SA can be glucosylated to form SAG (2-O-β-D-glucosylsalicylic acid), which serves as a biologically inert reservoir of SA [11]. SA is also present in plants as methyl-salicylate, which can also be conjugated to glucose [12]. Generally, mutants with con-stitutively high SA levels are resistant to biotrophic patho-gens, while those unable to accumulate SA are susceptible [13-24]. Thus, quantification of SA is routine in the study of plant immunity.
The most commonly used methods for measuring SA from plant tissue employ HPLC or GC/MS [25-27]. These techniques both involve extraction of SA in organic sol-vents and subsequent evaporation. SA is then purified chromatographically, and detected by fluorescence spec-troscopy or mass spectrometry. However, during extrac-tion some of the SA is lost, and an internal control must be included to correct for SA recovery.
Recently, Huang et al. developed a biosensor for SA, named Acinetobacter sp. ADPWH_lux [28]. This strain is derived from Acinetobacter sp. ADP1, and contains a chro-mosomal integration of a salicylate-inducible luxCDABE
operon, providing the substrate and catalyst for SA-responsive luminescence. The Acinetobacter sp. ADPWH_lux response appears to be limited to SA, methyl-SA, and the synthetic SA derivative acetylsalicylic acid [28]. Measurement of SA from TMV-infected tobacco leaves with the biosensor and GC/MS yielded similar results [29], demonstrating that this strain is suitable for the quantification of SA from plant tissue.
Herein, we present an improved approach for the quanti-fication of free SA from Arabidopsis leaf extracts using
Aci-netobacter sp. ADPWH_lux. We have also developed a
method for Acinetobacter sp. ADPWH_lux-based SAG measurement.
Results
Standard Curve Generation
Briefly, the method described by Huang et al. comprises tissue grinding, extraction in LB, sonication, and centrifu-gation, resulting in a crude plant extract containing SA. The crude extract is then mixed with a culture of the bio-sensor in a 96-well cell culture plate, and incubated at 37°C for one hour. The luminescence is then determined. In order to convert SA-induced luminescence into units of
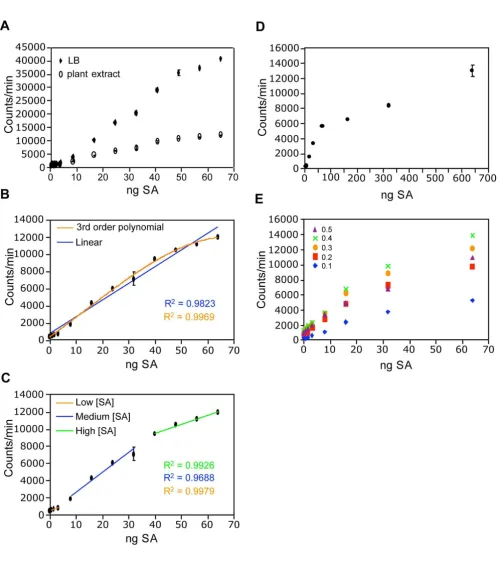
SA concentration, several standards with known amounts of SA are included to generate a standard curve [28]. We found that standards made with crude extract had signifi-cantly lower luminescence than those made with LB (Fig-ure 1A), suggesting that the plant extract decreases induction of the biosensor by SA. Since our aim was to determine SA concentrations in plant extract, the stand-ards must also have plant extract as a solvent. The ideal plant extract for making SA standards would initially con-tain no SA. In order to minimize the SA content of the extract used to make the standards, we used extract from
sid2-2 plants, which fail to accumulate significant
amounts of SA during pathogen infection. However, we and others [24] were unable to consistently detect a differ-ence in constitutive SA levels between sid2-2 and wild type (data not shown). Therefore, untreated wild type plants may also be used for making the SA standards. Lack of a standard with no SA precludes the determination of abso-lute SA concentrations from plant extracts. Thus, the bio-sensor may only be used to determine relative SA levels between samples rather than absolute concentrations. When SA standards were made with plant extract, the rela-tionship between luminescence and SA concentration was non-linear (Figure 1B). To simplify data analysis, instead of using all standards to construct the standard curve, only the standards with luminescence similar to that of the experimental sample were used. A best-fit linear line with a high R-squared value could then be derived and used as the standard curve (Figure 1C). Alternatively, a non-linear best-fit line can be used, although we found higher R-squared values for standards with low SA content, using the former method. Conversion from luminescence to SA concentration was carried out using the following equa-tion:
[SA] = [(luminesence - y-interceptstandard curve)/slopestandard
curve]/tissue mass
where known luminescence of a sample and tissue mass are used to calculate unknown SA concentration. In some cases, two or more standard curves were needed to deter-mine the SA concentration of samples with largely differ-ent luminescence values. We found this approach to be useful in determining SA content between 1.6 and 64 ng SA (0.28 and 11 μg SA/g FW). At higher concentrations, induction of the biosensor by SA was diminished (Figure 1D). If sample SA concentrations exceeded 11 μg SA/g FW, the sample extract was diluted in untreated plant extract so that it fell within the useful range of the assay.
To determine if the culture density of the biosensor affected the useful range of the assay, we tested cultures of various optical densities (ODs) for SA-induced lumines-cence. The responsiveness of Acinetobacter sp. ADPWH_lux
OD600 = 0.4. Cultures with ODs higher than 0.4 were less responsive (Figure 1E), indicating that this is the opti-mum density for the assay. SA-induced luminescence var-ied somewhat between experiments (data not shown), so new SA standards were prepared for each experiment.
Optimization of Acinetobacter sp. ADPWH_lux-based SA Measurement
In order to further examine the specificity of the biosen-sor, we tested 12 substances similar in structure to SA, but not examined in [28] for their ability to induce lumines-cence in ADPWH_lux. These compounds are known to be present in plants, and/or accumulate during pathogen infection. None of the tested substances induced lumines-cence, even at high concentrations (Additional file 1). To improve upon the method of Huang et al. [28], a more rapid extraction protocol was tested. To extract many sam-ples at once, we used a Genogrinder 2000 homogenizer to grind tissue that had been frozen in liquid nitrogen and to extract the samples in LB. Samples were centrifuged and the crude extract collected, omitting sonication. As described previously, the extract was mixed with biosen-sor culture and luminescence was measured [28]. SA con-tent of wild-type plants infected with Pseudomonas syringae
pv. maculicola (Psm) ES4326 measured by the modified
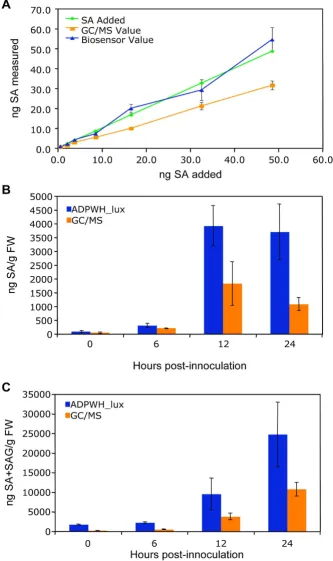
method (described here) was similar to that obtained with the original method (3.50 ± 0.89 and 3.1 ± 0.73 μg SA/g FW, respectively), indicating that these changes did not significantly affect accuracy. To further confirm the accuracy of the assay, we measured SA from varying quan-tities of Psm ES4326-infected tissue. SA content increased linearly with tissue mass (R2 = 0.9777, Figure 2A),
con-firming accuracy and suggesting little tissue (as few as 2– 3 leaves) is needed to obtain reproducible results, allow-ing SA to be measured from sallow-ingle Arabidopsis plants without a completely destructive harvest. However, we typically used 5–6 leaves from different plants for each sample to minimize plant-to-plant variation.
SAG Measurement
Although free SA is the biologically active form of SA, ele-vation of SAG concentration accompanies actiele-vation of
plant defenses [30]. Consequently, measurement of SAG has been used for detecting alterations in SA metabolism [21]. Therefore, we developed a method for measuring SAG using the biosensor. SAG has previously been meas-ured by treating a dried extract of SAG with β-glucosidase, releasing SA and glucose. The free SA is then analyzed by HPLC [15]. This involves several extraction steps, resulting in significant loss of SA. Since the biosensor detects SA in a complex mixture, we added β-glucosidase directly to the crude extract in order to avoid purification. Inclusion of β -glucosidase did not affect luminescence induced by free SA in a cell-free solution (Additional file 2). In the original biosensor-based protocol, SA was extracted in LB (pH 7.0). However, the optimum pH for β-glucosidase is 5.6 [31]. Enzymatic hydrolysis of purified SAG has been pre-viously carried out in acetate buffer (0.1 M, pH 5.6) [30]. To determine whether LB or acetate buffer was better for
β-glucosidase hydrolysis of SAG, we added β-glucosidase to crude extracts prepared with these two solutions. Addi-tionally, we carried out acid hydrolysis of SAG [31]. Enzy-matic hydrolysis of SAG in the acetate buffer extract released significantly more SA than in the LB extract (Fig-ure 2B). An enzyme concentration of 0.03 U/ul crude extract was sufficient for maximum SAG hydrolysis for
Psm ES4326-treated leaves (Additional file 3). Acid hydrolysis of SAG resulted in ~2-fold lower SA detection than enzymatic hydrolysis (Figure 2B); so acid hydrolysis was no longer employed. Free SA content from tissue extracted with acetate buffer did not differ significantly from tissue extracted with LB (data not shown). Thereaf-ter, all crude extracts were prepared with acetate buffer, allowing the quantification of free and conjugated SA from a single sample. When SAG was measured in this way from varying quantities of Psm ES4326-infected tis-sue, SA+SAG content increased linearly with tissue mass (R2 = 0.9926, Figure 2C).
Comparison of ADPWH_lux and GC/MS Salicylic Acid Quantification
In order to compare our method of SA and SAG quantifi-cation with existing methods, we added known amounts of SA to plant extracts and analyzed them with
Standard curve optimization Figure 1 (see previous page)
ADPWH_lux and a previously established GC/MS method [27]. As shown in Figure 3A, the ADPWH_lux-based method detected higher levels of SA than did the GC/MS method, and the values reported by ADPWH_lux were closer to the amount of SA added. Both methods esti-mated values that increased linearly with increasing SA content. When the SA and SA+SAG content of Psm
ES4326-infected wild type tissue was analyzed over time, the biosensor again reported higher concentrations than the GC/MS method. Both methods reported the highest concentration of free SA at 12 hpi, and the highest concen-tration of SA+SAG at 24 hpi (Figures 3A and 3B respec-tively).
SA Accumulation in Wild Type and sid2
To demonstrate the efficacy of ADPWH_lux, we measured SA and SAG in untreated and Psm ES4326-infected sid2-2
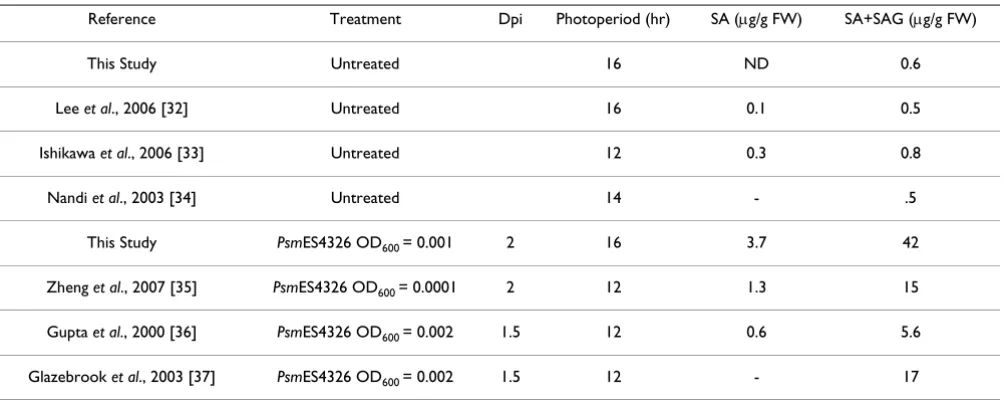
and wild-type plants. Psm ES4326 infection induced less SA and SAG accumulation in sid2-2 than in wild type (Fig-ures 4A and 4B). After Psm ES4326 infection, in wild type, SA+SAG content was approximately 10-fold higher than SA content. This ratio is similar to those obtained in pre-vious studies that used similar pathogen treatments [32-37] (Table 1). Wild type accumulated approximately six-fold more SA, and approximately 40-six-fold more SA+SAG than sid2. However, in wild type we obtained values for SA and SA+SAG that were significantly higher than those of previous studies (Table 1).
Evaluation of ADPWH_lux-based SA Quantification
The data presented in Figures 3 and 4 and in Table 1 sug-gest more SA may be detected using ADPWH_lux than with previous methods. One explanation is that the bio-sensor is responding to something other than SA that is present in the crude extract, resulting in artificially high values. Although several compounds that are structurally similar to SA and/or accumulate during the defense response do not induce luminescence in ADPWH_lux [28] (Additional file 1), we cannot exclude this possibility. Additionally, little luminescence was induced by patho-gen-treated sid2 extracts, suggesting that if there is a com-pound other than SA that induces ADPWH_lux, it is not present in sid2, and may be derived from isochorismate. Another possibility is that recovery of SA using HPLC- and GC/MS-based methods which include organic solvent extraction and evaporation steps result in partial recovery of SA [38], despite inclusion of internal standards to account for the loss of SA. Although these internal stand-ards have been shown to have similar recovery rates to SA [38], a difference in SA recovery between methods cannot be ruled out. Additionally, differences in photoperiod, pathogen inoculum, and the time after inoculation when SA content is measured, may also contribute to differences in SA measurements across different studies. Another pos-sible cause of differing results across methodologies is
Accuracy of ADPWH_lux-based SA and SAG quantification Figure 2
Comparison of ADPWH_lux- and GC/MS-based methods for SA quantification Figure 3
methyl-SA accumulation, which induces luminescence in the biosensor [29]. However, in Psm ES4326-infected wild type, methyl-SA reached a maximum concentration of only 65 ng/g FW during pathogen infection (data not shown). Given this low value, it appears that methyl-SA accumulation contributes minimally to estimates of SA accumulation, and was therefore not included in the anal-ysis.
Despite differences with existing methods in terms of absolute SA concentration, the ADPWH_lux-based SA quantification is useful for comparing SA content in response to mutation and pathogen treatment. The values obtained for SA and SA+SAG was also highly reproduci-ble. Consistently, free SA accumulation at 48 hpi was ~3.5
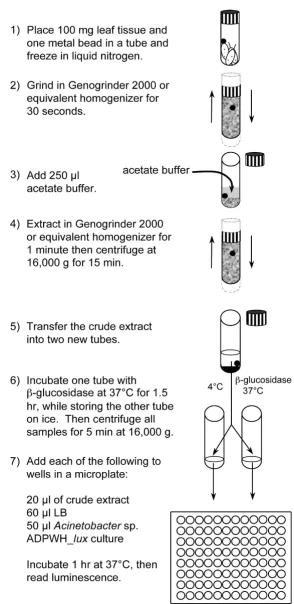
μg SA/g FW and SA + SAG was ~40 μg SA/g FW. The bio-sensor-based method routinely produced standard devia-tions between 15% and 25% of the mean and had a minimum detection limit of about 0.28 μg SA/g FW (data not shown). HPLC-based methods report standard devia-tions which are ~12% of the mean, and can vary in detec-tion limit, depending on the protocol and instrumentation used [38,39]. A schematic of the biosen-sor-based methodology and a detailed protocol are pre-sented in Figure 5 and Additional file 4, respectively. In our laboratory, free and conjugated SA was routinely quantified from ~50 samples in ~5.0 hr.
Conclusion
In this study we present an improved method for the quantification of SA from plant tissue using the SA biosen-sor Acinetobacter sp. ADPWH_lux. The modified method is as accurate and more rapid than the previous Acinetobacter
sp. ADPWH_lux -based approach [28]. We also developed
a biosensor-based method for measuring SA + SAG using enzymatic hydrolysis. Free and conjugated SA can be measured simultaneously from hundreds of samples per day, providing an alternative to HPLC and GC/MS, with significant reductions in cost and processing time. Adop-tion of 96-well formats for tissue grinding, SA extracAdop-tion, and SAG hydrolysis will further decrease the cost and time involved. It is our hope that this methodology will encourage investigators to include SA quantification in their experiments, facilitating a more thorough under-standing of this intriguing molecule.
Methods
Preparation of crude extract
This procedure was adapted from Huang et al. [28]. SA measurements were carried out as follows unless other-wise indicated. On the day of SA measurement, samples were frozen in liquid nitrogen and ground at 1500 strokes/min for 30 sec in a Genogrinder 2000 (BT&C/OPS Diagnostics, Bridgewater, NJ). Tissue was ground three times while refreezing in liquid nitrogen each time. After the third round of grinding, samples were left at room temperature for 5 minutes, and 2.5 μl/mg tissue of room temperature acetate buffer (0.1 M, pH 5.6) was added. Samples were then mixed for 1 min at 1000 strokes/min and centrifuged for 15 min at 16,000 g. Half (100 μl) of the supernatant was stored on ice for free SA measurement and half was incubated at 37°C for 90 min with 4 U of β -glucosidase (3.2.1.21, Sigma-Aldrich, St. Louis, MO) for SAG measurement.
Table 1: Comparison of SA quantification results
Reference Treatment Dpi Photoperiod (hr) SA (μg/g FW) SA+SAG (μg/g FW)
This Study Untreated 16 ND 0.6
Lee et al., 2006 [32] Untreated 16 0.1 0.5
Ishikawa et al., 2006 [33] Untreated 12 0.3 0.8
Nandi et al., 2003 [34] Untreated 14 - .5
This Study PsmES4326 OD600 = 0.001 2 16 3.7 42
Zheng et al., 2007 [35] PsmES4326 OD600 = 0.0001 2 12 1.3 15
Gupta et al., 2000 [36] PsmES4326 OD600 = 0.002 1.5 12 0.6 5.6
Glazebrook et al., 2003 [37] PsmES4326 OD600 = 0.002 1.5 12 - 17
Detection of salicylic acid using Acinetobacter sp. ADPWH_lux and GC/MS
An overnight culture of Acinetobacter sp. ADPWH_lux was diluted in 37°C LB (1:20) and grown for ~3 hrs at 200 rpm to an OD600 of 0.4. Twenty μl of room temperature crude extract was added to 60 μl room temperature LB in a black 96-well black cell culture plate. Using a multipi-pet, 50 μl of biosensor culture was added to each well and mixed by pipet action. The plate was incubated at 37°C for 1 hr without shaking before luminescence was read
using a Victor3 Perkin Ellmer Multi-Detection Microplate Reader (PerkinElmer, Waltham, Massachusetts). Each sample was measured in triplicate. GC/MS based analysis of SA follows from Schmelz et al. [27]. Briefly, aliquots of crude extracts described above where spiked with 100 ng of 2H
6-SA as an internal standard and mixed with 300 μl
of H2O:1-propanol: HCl (1:2:0.005) followed by 1 ml of
dichloromethane (MeCl2). The MeCl2:1-propanol layer containing SA was then transferred to a glass vial and 2 μl of 2.0 M trimethylsilyldiazomethane solution was added to form methyl esters. Residual derivatization agent was neutralized with excess acetic acid. Vapor phase extraction at 200°C was used to recover the MeSA on filters contain-ing 30 mg Super Q (Alltech Associates, Inc., Deerfield, IL, USA) followed by elution with MeCl2. Samples were then
analyzed with an established isobutane chemical ioniza-tion-GC/MS profiling method [27]. Estimates of salicylic acid (SA) represent combined pools of endogenous free acids and methyl esters.
Standard curve
Known amounts of SA were dissolved in either LB or ace-tate buffer, then diluted 10-fold in plant extract. SA stand-ards were read in parallel with the experimental samples. Conversion of luminescence to SA concentration was done as discussed in Results.
Competing interests
The authors declare that they have no competing interests.
Authors' contributions
CTD contributed to the conception and design of the project, collected, analyzed, and interpreted the data for all biosensor-based SA measurements, and prepared the manuscript. EAS collected, analyzed, and interpreted the data for all GC/MS-based SA measurements, and revised and edited the manuscript. ZM was involved in the con-ception and design of the project, revised and edited the manuscript, and is the PI of the laboratory. All authors read and approved the final manuscript.
SA measurement of untreated and Psm ES4326-infected wild-type and sid2-2 plants
Figure 4
Schematic of Acinetobacter sp. ADPWH_lux-based SA and SAG quantification Figure 5
Additional material
Acknowledgements
We thank Dr. Ian Blaby (University of Florida, FL) for critical reading of the manuscript, Dr. Hui Wang (NERC/Centre for Ecology and Hydrology-Oxford, Hydrology-Oxford, UK) for the SA biosensor strain Acinetobacter sp. ADPWH_lux and technical assistance with the SA measurement, and Drs. Max Teplitski (University of Florida, FL) for access to the Victor3 Perkin Ellmer Multi-Detection Microplate Reader and critical reading of the man-uscript. This work was supported by a grant from the Herman Frasch Foun-dation for Chemical Research and a research innovation grant from the Institute of Food and Agricultural Sciences, University of Florida awarded to ZM. CD was supported by an Alumni Fellowship from the University of Florida.
References
1. Cleand CF, Ajami A: Identification of a flower-inducing factor, isolated aphid honeydew as being salicylic acid. Plant Physiol
1974, 54:904-906.
2. Shakirova FM, Sakhabutdinova AR, Bezrukova MV, Fatkhutdinova RA, Fatkhutdinova DR: Changes in the hormonal status of wheat seedlings induced by salicylic acid and salinity. Plant Sci 2003,
164:317-322.
3. Raskin I, Ehmann A, Melander WR, Meeuse BJD: Salicylic acid: a natural induced of heat production in Arum lilies. Science 1987,
237:1601-1602.
4. Rhoads DM, McIntosh L: Salicylic acid regulation of respiration in higher plants: alternative oxidase expression. Plant Cell
1992, 4:1131-1139.
5. White RF: Acetylsalicylic acid (aspirin) induces resistance to tobacco mosaic virus in tobacco. Virology 1979, 99:410-412. 6. Durrant WE, Dong X: Systemic acquired resistance. Annu Rev
Phytopathol 2004, 42:185-209.
7. Raskin I: Role of salicylic acid in plants. Annu Rev Plant Physiol Plant Mol Biol 1992, 43:439-463.
8. Ryals JA, Neuenschwander UH, Willits MG, Molina A, Steiner H-Y, Hunt MD: Systemic acquired resistance. Plant Cell 1996,
8:1809-1819.
9. Malamy J, Carr JP, Klessig DF, Raskin I: Salicylic acid: a likely endogenous signal in the resistance response of tobacco to viral infection. Science 1990, 250:1002-1004.
10. Métraux JP, Signer H, Ryals J, Ward E, Wyss-Benz M, Gaudin J, Ras-chdorf K, Schmid E, Blum W, Inverardi B: Increase in salicylic acid at the onset of systemic acquired resistance in cucumber.
Science 1990, 250:1004-1006.
11. Enyedi AJ, Raskin I: Induction of UDP-glucose: salicylic acid glu-cosyltransferase activity in tobacco mosaic virus-inoculated tobacco (Nicotiana tabacum) leaves. Plant Physiol 1993,
101:1375-1380.
12. Lee H-I, León J, Raskin I: Biosynthesis and metabolism of sali-cylic acid. Proc Natl Acad Sci USA 1995, 92:4076-4079.
13. Zhang X, Dai Y, Xiong Y, Defraia C, Li J, Dong X, Mou Z: Overex-pression of Arabidopsis MAP Kinase Kinase 7 leads to activa-tion of plant basal and systemic acquired resistance. Plant J
2007, 52:1066-1079.
14. Petersen M, Brodersen P, Naested H, Andreasson E, Lindhart U, Johansen B, Nielsen HB, Lacy M, Austin MJ, Parker JE, et al.: Arabi-dopsis MAP kinase 4 negatively regulates systemic acquired resistance. Cell 2000, 103:1111-1120.
15. Bowling SA, Guo A, Cao H, Gordon AS, Klessig DF, Dong X: A mutation in Arabidopsis that leads to constitutive expres-sion of systemic acquired resistance. Plant Cell 1994,
6:1845-1857.
16. Clarke JD, Liu Y, Klessig DF, Dong X: Uncoupling PR gene expression from NPR1 and bacterial resistance: Characteri-zation of the dominant Arabidopsis cpr6-1 mutant. Plant Cell
1998, 10:557-569.
17. Shah J, Kachroo P, Nandi A, Klessig DF: A recessive mutation in the Arabidopsis SSI2 gene confers SA- and NPR1-independent expression of PR genes and resistance against bacterial and oomycete pathogens. Plant J 2001, 25:563-574.
18. Zhang Y, Goritschnig S, Dong X, Li X: A gain-of-function muta-tion in a plant disease resistance gene leads to constitutive activation of downstream signal transduction pathways in
suppressor of npr1-1, constitutive 1. Plant Cell 2003, 15:2636-2646. 19. Shirano Y, Kachroo P, Shah J, Klessig DF: A gain-of-function muta-tion in an Arabidopsis toll interleukin1 receptor-nucleotide binding site-leucine-rich repeat type R gene triggers defence responses and results in enhanced disease resistance. Plant Cell 2002, 14:3149-3162.
20. Heidel AJ, Clarke JD, Antonovics J, Dong X: Fitness costs of muta-tions affecting the systemic acquired resistance pathway in
Arabidopsis thaliana. Genetics 2004, 168:2197-2206.
21. Nawrath C, Métraux J-P: Salicylic acid induction-deficient mutants of Arabidopsis express PR-2 and PR-5 and accumu-late high levels of camalexin after pathogen inoculation. Plant Cell 1999, 11:1393-1404.
22. Dewdney J, Reuber TL, Wildermuth MC, Devoto A, Cui J, Stutius LM, Drummond EP, Ausubel FM: Three unique mutants of Arabidop-sis identify eds loci required for limiting growth of a bio-trophic fungal pathogen. Plant J 2000, 24:205-218.
23. Nawrath C, Heck S, Parinthawong N, Métraux J-P: EDS5, an essen-tial component of salicylic acid-dependent signaling for dis-ease resistance in Arabidopsis, is a member of the MATE transporter family. Plant Cell 2002, 14:275-286.
24. Wildermuth MC, Dewdney J, Wu G, Ausubel FM: Isochorismate synthase is required to synthesize salicylic acid for plant defence. Nature 2001, 414:562-565.
Additional file 1
Specificity of ADPWH_lux. The indicated compounds were added to ADPWH_lux and luminescence determined as described in Methods. Values are the mean of 4 samples read in triplicate with standard devia-tion. This experiment was done twice with similar results.
Click here for file
[http://www.biomedcentral.com/content/supplementary/1746-4811-4-28-S1.jpeg]
Additional file 2
Effect of β-glucosidase on free SA detection by ADPWH_lux.β -glucosi-dase was added to plant extract containing known amounts of SA, and luminescence was determined with ADPWH_lux as described in Meth-ods. Values are the mean of 4 samples read in triplicate with standard deviation. This experiment was done twice with similar results.
Click here for file
[http://www.biomedcentral.com/content/supplementary/1746-4811-4-28-S2.jpeg]
Additional file 3
Determination of the minimum effective quantity of β-glucosidase for the determination of SA+SAG.β-glucosidase was added to Psm
ES4326-treated plant extract in increasing amounts and SA+SAG was determined as described in Methods.
Click here for file
[http://www.biomedcentral.com/content/supplementary/1746-4811-4-28-S3.jpeg]
Additional file 4
Protocol. Detailed protocol for Acinetobacter sp. ADPWH_lux-based SA measurement.
Click here for file
Publish with BioMed Central and every scientist can read your work free of charge "BioMed Central will be the most significant development for disseminating the results of biomedical researc h in our lifetime."
Sir Paul Nurse, Cancer Research UK
Your research papers will be:
available free of charge to the entire biomedical community
peer reviewed and published immediately upon acceptance
cited in PubMed and archived on PubMed Central
yours — you keep the copyright
Submit your manuscript here:
http://www.biomedcentral.com/info/publishing_adv.asp
BioMedcentral 25. Aboul-Soud MAM, Cook K, Loake GJ: Measurement of salicylic
acid by a high-performance liquid chromatography proce-dure based on ion-exchange. Chromatographia 2004, 59:129-133. 26. Malamy J, Klessig DF: Salicylic acid and plant disease resistance.
Plant J 1992, 2:643-654.
27. Schmelz EA, Engelberth J, Alborn HT, O'Donnell P, Sammons M, Toshima H, Tumlinson JH 3rd: Simultaneous analysis of phyto-hormones, phytotoxins, and volatile organic compounds in plants. Proc Natl Acad Sci USA 2003, 100:10552-10557.
28. Huang WE, Wang H, Zheng H, Huang L, Singer AC, Thompson I, Whiteley AS: Chromosomally located gene fusions con-structed in Acinetobacter sp. ADP1 for the detection of sal-icylate. Environ Microbiol 2005, 7:1339-1348.
29. Huang WE, Huang L, Preston GM, Martin N, Carr JP, Yanhong L, Singer AC, Whiteley AS, Hui W: Quantitative in situ assay of sal-icylic acid in tobacco leaves using a genetically modified bio-sensor strain of Acinetobacter sp. ADP1. Plant J 2006,
46:1073-1083.
30. Enyedi AJ, Yalpani N, Silverman P, Raskin I: Localization, conjuga-tion, and function of salicylic acid in tobacco during the hypersensitive reaction to tobacco mosaic virus. Proc Natl Acad Sci USA 1992, 89:2480-2484.
31. Wiseman A: Fungal and other beta-D-glucosidases – their properties and applications. Enzyme Microb Technol 1982,
4:73-78.
32. Lee J, Nam J, Park HC, Na G, Miura K, Jin JB, Yoo CY, Baek D, Kim DH, Jeong JC, et al.: Salicylic acid-mediated innate immunity in Arabidopsis is regulated by SIZ1 SUMO E3 ligase. Plant J 2007,
49:79-90.
33. Ishikawa A, Kimura Y, Yasuda M, Nakashita H, Yoshida S: Salicylic acid-mediated cell death in the Arabidopsis len3 mutant. Bio-sci Biotechnol Biochem 2006, 70:1447-1453.
34. Nandi A, Krothapalli K, Buseman CM, Li M, Welti R, Enyedi A, Shah J: Arabidopsis sfd mutants affect plastidic lipid composition and suppress dwarfing, cell death, and the enhanced disease resistance phenotypes resulting from the deficiency of a fatty acid desaturase. Plant Cell 2003, 15:2383-2398.
35. Zheng Z, Mosher SL, Fan B, Klessig DF, Chen Z: Functional analy-sis of Arabidopanaly-sis WRKY25 transcription factor in plant defense against Pseudomonas syringae. BMC Plant Biology 2007,
7:2.
36. Gupta V, Willits MG, Glazebrook J: Arabidopsis thaliana EDS4 contributes to salicylic acid (SA)-dependent expression of defense responses: evidence for inhibition of jasmonic acid signaling by SA. Mol Plant Microbe Interact 2000, 13:503-511. 37. Glazebrook J, Chen W, Estes B, Chang H-S, Nawrath C, Métraux J-P,
Zhu T, Katagiri F: Topology of the network integrating sali-cylate and jasmonate signal transduction derived from glo-bal expression phenotyping. Plant J 2003, 34:217-228.
38. Eshita SM: 3-Hydroxybenzoic acid as an internal standard for the high-pressure liquid chromatography quantitation of sal-icylic acid in plants. Anal Biochem 2001, 289:99-102.
39. Meuwly P, Metraux JP: Ortho-anisic acid as internal standard for the simultaneous quantitation of salicylic acid and its puta-tive biosynthetic precursors in cucumber leaves. Anal Biochem