(will be inserted by the editor)
A Self-Organized Grouping (SOG) Framework for Efficient
Grid Resource Discovery
Anand Padmanabhan · Sukumar Ghosh · Shaowen Wang
Received: date / Accepted: date
Abstract Dynamic and heterogeneous characteristics of large-scale Grids make the fundamental problem of resource discovery a great challenge. This paper presents a self-organized grouping (SOG) framework that achieves efficient Grid resource discovery by form-ing and maintainform-ing autonomous resource groups. Each group dynamically aggregates a set of resources together with respect to similarity metrics of resource characteristics. The SOG framework takes advantage of the strengths of both centralized and decentralized ap-proaches that were previously developed for Grid/P2P resource discovery. The design of SOG minimizes the overhead incurred by the process of group formation and maximizes the performance of resource discovery. The way SOG approach handles resource discovery queries is metaphorically similar to searching for a word in an English dictionary, by identifying its alpha-betical group at the first place, and then performing a lexical search within the group.
Because multi-attribute range queries represent an important aspect of resource discovery, we devise a generalized approach using a space-filling curve in conjunction with the SOG framework. We exploit the Hilbert space-filling curve’s locality preserving and dimension reducing mapping. This mapping provides
A. Padmanabhan, S. Wang
CyberInfrastructure and Geospatial Information Lab and National Center for Supercomputing Application (NCSA) University of Illinois at Urbana Champaign
Urbana, IL 61801
E-mail: [email protected], [email protected] S. Ghosh
Department of Computer Science The University of Iowa
Iowa City, IA 52242 E-mail: [email protected]
a 1-dimensional grouping attribute to be used by the SOG framework. Experiments show that the SOG framework achieves superior look-up performance that is more scalable, stable and efficient than other exist-ing approaches. Furthermore, our experimental results indicate that the SOG framework has little dependence on factors such as resource density, query type, and Grid size.
Keywords Grid computing· peer-to-peer systems·
resource discovery · multi-attribute range queries ·
self-organization·space filling curve
1 Introduction
Grids [13] and peer-to-peer systems are increasingly being used as large-scale resource sharing environ-ments. Scientists use these distributed computing environments to conduct knowledge discovery in their specific domains. Key services like resource reservation and task scheduling can be built only when resources can be located. Grid resource discovery service helps locate resources to meet user requirements.
Current Grids provide a distributed infrastructure that enables the assembly of numerous resources across multiple administrative domains, to create a virtual supercomputer that can be used to accomplish a spe-cific task. This assemblage of distributed resources is dynamically orchestrated to support coordinated resource sharing through Grid middleware. The coor-dinated sharing of resources takes place within formal or informal consortia of individuals and/or institutions that are often referred to as Virtual Organizations (VO) [14]. Individual resource providers manage the infrastructure at their sites, making the Grid highly
heterogeneous and without central authority. Further-more, Grid resources can be either static or dynamic. Static resources have attributes that are relatively stable (e.g. OS version), while dynamic resources represent more volatile attributes (e.g. free memory, available disk space). These properties suggest that any successful resource discovery approach should be suffi-ciently nimble to adapt to its environment. This paper presents an approach to handle these challenges effec-tively by developing a self-organizing process. While we concentrate on developing a solution for discovering dynamic resources, the solution is trivially suitable for static resources too. A typical Grid node is composed of multiple resources, both static and dynamic (e.g. a node has a CPU type, an OS installation, memory and disk-space available, wallclock time) and a typical job places multiple constraints on resource availability. A Grid resource discovery system is required to handle complex multi-attribute range queries (constraints) within dynamically changing environments.
Developing an efficient and scalable solution for Grid resource discovery poses a challenge because of the:
1. dynamic nature of Grid resources; 2. absence of central authority;
3. heterogeneous and large scale nature of Grid envi-ronments;
4. unpredictability of faults; and
5. difficulty in handling complex multi-attribute range queries.
To address these challenges, a resource discovery solu-tion must exhibit the following important characteris-tics:
1. support for intermittent resource availability; 2. independence from any centralized/global control
and global knowledge;
3. support for attribute-based discovery; 4. support for multi-attribute range queries;
5. scalability in terms of number of users and re-sources, and type of resources; and,
6. provide excellent query performance.
The framework presented in this paper is designed to espouse each of these characteristics. In particu-lar, our research aims to addresses the challenges of dynamic resource discovery and multi-attribute range query. The Self-Organized Grouping (SOG) frame-work [28] is designed to enable discovery of dynamic Grid resources and to handle multi-attribute range queries using space-filling curves (SFC). This frame-work provides a scalable mechanism to support efficient Grid resource discovery.
In the SOG framework, resources get self-organized into groups according to similarity of statistical charac-teristic. Previous research in small-world and unstruc-tured P2P network shows that performance can be im-proved by exploiting common interest shared by users [7], and by clustering peers together [20]. In the SOG framework, we introduce the concept of grouping from a different angle – instead of grouping users with simi-lar interests, we organize simisimi-lar resources into groups. Each group is managed by a leader, which is the group representative and consists of members that serve as workers. This approach provides the framework with a unique capability to exploit the strengths of both struc-tured and unstrucstruc-tured P2P networks. This along with self-organizing design of the framework achieves scal-ability, intermittent participation, local control, there by being resilient in complex Grid environments. Sec-tion 2 relates this work to earlier research in the field of resource discovery in distributed environments. Section 3 presents the architectural design of this SOG frame-work . Section 4 discusses the algorithms that imple-ment the SOG framework, and explains how to couple SFCs and SOG framework to address the problem of multi-attribute range queries and to achieve efficient Grid resource discovery. Section 5 analyzes the SOG framework and together with a suite of experiments in section 6, we demonstrate that SOG provides a scal-able and efficient solution for problems associated with Grid resource discovery. We conclude this paper with a discussion and pointers to future work.
2 Resource Discovery Approaches for Distributed Environments
Current solutions to Grid resource discovery fall broadly into two broad categories, centralized and de-centralized. Centralized approaches have good lookup performance, but they scale poorly in size. Decen-tralized approaches are generally scalable in terms of the number of nodes that can be handled, but suf-fer from a significant deterioration in average lookup performance.
In peer-to-peer (P2P) systems, decentralized meth-ods can be divided into two major categories: unstruc-tured and strucunstruc-tured. Unstrucunstruc-tured P2P network (e.g., Gnutella [32]) generally communicates using broadcast (e.g. flooding), and consequently incur significant com-munication overhead while finding existing resources cannot be guaranteed. Distributed hash tables (DHT) based structured P2P networks (e.g., CHORD [36], CAN [31]), are often suitable for looking up existing data items and guarantee query responses within a small number of hops. However, a dynamic resource
environment results in a substantial number of up-dates, which likely causes dramatical increase in the overhead of maintaining the DHT. Furthermore, DHT requires every resource-value pair to have a unique key, which may limit its scalability if used for Grid resource discovery. SOG captures the strengths of both structured and unstructured approaches while avoiding their limitations by espousing the self-organization ca-pability of fully unstructured architecture and adding a lightweight structure to obtain efficient query per-formance. The SOG approach has some similarities with the super-peer network [38], in that both ap-proaches form a cluster of peer nodes. But unlike super-peer networks SOG leaders do not have to store an up-to-minute status about client resources.
In Grid resource discovery research, various ap-proaches have been studied as well. Condor Match-maker [30] follows a centralized approach and maintains a central server responsible for matching the adver-tisements between resource consumers and resource providers. A fully-decentralized approach based on different request forwarding schemes have been studied by Iamnitchi et al [15], while a DHT based structured decentralized approach was adopted by Zhu et al [39]. A hierarchical structure, formed by GIIS (Grid Index Information Service) and GRIS (Grid Resource Infor-mation Service), is employed by the Monitoring and Discovery Services (MDS) [8] from the Globus Toolkit. We believe that the architecture and technique devel-oped in SOG is orthogonal to MDS efforts, and could be integrated into the MDS infrastructure. Mastroianni et al. [21] adapted the super-peer network to perform resource discovery. A bio-inspired approach relying on swarm intelligence using self-organizing agents with an ant-based replication and mapping protocol was studied by Forestiero et al. [10] for So-Grid [11]. Foster et al [12], forecast the convergence of of strengths of Grid and P2P technologies, which has spurred the development of many P2P inspired algorithms for handing challenging Grid research issues including information systems [34], service [6] and resource [22] discovery.
Multi-attribute range queries for dynamic resources have been addressed in Mercury [4], SWORD [27], XenoSearch [35]. All these methods are based on DHTs. Mercury creates a hub for each attribute con-sidered and replicates data items on each hub. A query is forwarded to one of the hubs based on the selectivity of the query. XenoSearch creates a separate DHT instance for each attribute, while creating its query routing structure explicitly rather than using built-in DHT successor pointers. In addition, XenoSearch pro-vides approximate answers using Bloom Filters [18]
and supports DHT-based multi-attribute range queries by directing them to each separate dimension and aggregating results. SWORD’s multi-query approach is similar to XenoSearch, while their single-query ap-proach is similar to Mercury. SWORD also allows users to define inter-node or edge attributes that are absent in other approaches. Prefix hash table (PHT) [29] and other a trie-like data structure [6], offers an alternative range search strategy based on tries built on DHTs. In contrast to these methods, the SOG method does not replicate either queries (as in XenoSearch) or data elements/updates (as in Mercury).
Space-filling curves have been used in a variety of domains to handle the mapping between multi-dimensional space and one-multi-dimensional curves. [37] uses SFCs to effectively locate services on a mobile self-organizing network. In particular [33] and [1] used SFCs to address multi-attribute queries. However, unlike the SOG framework, [1] uses an inverse SFC mapping (1-dimension to d-dimension) to map a re-source to peers in the CAN overlay based on a single resource attribute. [33] uses a Hilbert SFC mapping from d-dimension space to 1-D index space to form a Chord overlay network. Also, the work in both [33] and [1], primarily deal with keyword search. Unlike these, SOG is not based on DHTs, and thus avoids the problems of costly updates involved in the publication of dynamic resource information.
3 Self-Organized Grouping (SOG) Framework
In this section we present the basic building blocks of the SOG architecture. We explain how the self-organized grouping approach handles dynamically changing Grid resources; and how space-filling curves are used in SOG to address multi-attribute resource discovery requests.
The SOG framework 1) supports intermittent re-source participation, 2) works exclusively with local knowledge, and 3) functions based on complete local control. The application of a space-filling curve to han-dle multi-attribute range queries coupled within SOG 1) exploits locality preserving mapping to facilitate multi-attribute range queries, 2) assembles resources into a limited number of dynamic groups using dif-ferent order SFC mappings, and 3) handles resource heterogeneity by grouping resources with equivalent SFC mappings.
3.1 Overlay Network
In the SOG architecture, a two-layer overlay network is formed to maintain groups and process queries. The lower layer is constructed using a lightweight gossip pro-tocol [3]. This layer, each node of which has O(logn) neighbors [17], is primarily used to forward gossip mes-sages (for leader election).
Workers Leaders
Groups
Fig. 1 The upper level graph maintained by SOG (from [28])
The upper layer (figure 1) is primarily used for query handling. It represents the interconnection among lead-ers and worklead-ers and is designed as follows: 1) each node has a link to all leader nodes; 2) each leader node has a link to all of its own worker nodes. The resulting graphs can range from a star graph on one extreme to a fully connected graph at the other. Neither of these extreme cases is desirable in practice. The star graph results when there is a single group (this is equivalent to a single/centralized server architecture), while the fully connected graph occurs when every node is a group in itself. Graph connectivity increases as the number of groups (and consequently the number of leaders) in-creases. Graph diameter is kept as two, thereby helping achieve excellent performance for query processing.
A typical upper layer graph maintained by SOG lies between the two extremes described above. The SOG overlay is initialized by specifying a similarity threshold that controls the number of groups. The trade-off that guides the threshold specification is determined by the balance number of groups and the size of each group. If the number of groups is too small, then the leader nodes of these groups might be forced to handle an excessive amount of loads, since the group sizes tend to be large, and this will lead to performance bottlenecks. On the other hand if there are too many groups, the storage cost increases since each node store pointers to all the leader nodes and so does the cost of communication required to form and maintain the groups. By striving to balance the trade-off between group sizes and the number of groups, we ensure the grouping approach deployed by SOG remains scalable.
3.2 The SOG Architecture
The SOG architecture is based on the principle that nodes in the Grid are organized automatically into groups according to their resource’s statistical charac-teristic that facilitates the organization and usage of this framework.
Self-organized groups are formed in a bottom-up fashion. Each node starts as a group by itself. Through the execution of SOG components, groups merge into larger groups guided by the similarity threshold of sta-tistical characteristic. This SOG architecture focus on the development and evaluation of self-organized group-ing capability. This capability is implemented by the SOG components (algorithm 1) that are executed on each node in a non-deterministic fashion.
Algorithm 1SOG Components
1: Publish resource information to leader periodically if leader exists;
2: Handle group forming and maintenance;
3: Receive and process system messages (likesubscribe, proclaim
leader, conflict);
4: Receive and process query messages;
An important strategy of SOG is to manage resource dynamics through grouping, and thereby to limit the amount of dynamic information being published. The only active dynamic information being published to en-able SOG framework originates from a worker and is directed to its leader. This helps limit the communi-cation overhead incurred by the SOG framework. This scheme enhances SOG scalability by limiting the vol-ume of dynamic information being published without any negative impact on query performance.
Another task handled by the SOG framework is the creation and maintenance of groups. Group checking takes place periodically to ensure that each node be-longs to an appropriate group as resource status dy-namically changes. When a new node joins the Grid, it begins collecting temporal samples of resource values. Once it has sufficient temporal samples, it searches for and if successful, joins an existing group, the statistical characteristic of which is similar to itself. A group’s sta-tistical characteristic is the same as its leader’s charac-teristic that was gossiped when the leader was elected. If such a search fails, the newly joining node creates a new group with itself as the group leader. This new group evolves with other existing groups. The group-ing of statistically-similar nodes increases query perfor-mance of resource discovery by decreasing the number of nodes that need to be visited by a query.
Using the overlay network, SOG implements a com-munication framework that provides all nodes with the capability to receive, process, and send messages and forms a backbone on which query processing is han-dled. This availability of information on group leaders and their characteristic allows the SOG framework to direct a query to an appropriate leader i.e. a leader in charge of a group with resources similar to the ones re-quested by the query. The leader, in turn, can direct the query to one of its workers that is able to satisfy the query.
The SOG querying mechanism limits a query’s search space from the entire Grid to a group through a single step and resource location inside the group in the next step. This process is metaphorically similar to searching for a word in an English dictionary by identifying its alphabetical groups at the first place. If the querying mechanism is unable to identify an ideal group or if such a group does not exist, it becomes necessary to forward the query to another group leader that may satisfy the query. This forwarding mechanism between group leaders achieves high resource discovery efficiency by keeping resource discovery scope at the group leader level. In case no leader can be identified, queries are randomly forwarded to a gossip neighbor.
Gossip messaging is expensive, therefore, to keep the number of gossip messages to a minimum while effi-ciently handling resource discovery queries, SOG treats group leaders differently than other resources. More specifically, new replacement group leaders are intro-duced to maintain major information for the existing groups, as the current group leaders leave. This strat-egy avoids dissolution of a group and thus saves gossip messages that would be required without the applica-tion of the strategy. In addiapplica-tion, leader elecapplica-tion is based on the evaluation of group local information. Multiple nodes may contend to become leaders even though they should belong to a single group. This case is defined as a conflict condition and only one leader is allowed in the current SOG design.
In essence, self-organized groups are designed to have the following three properties.
1. Each group is dynamically formed and maintained and includes a collection of nodes with a single rep-resentative node elected as its leader.
2. The nodes within each group are statistically simi-lar based on a specified resource characteristic. The selection of specific resource characteristic is guided by the understanding of common resource require-ments from applications that issue resource discov-ery queries.
3. The size of each group is indirectly determined by a similarity threshold. This threshold is chosen based
on the number of Grid resources, resource density, query load, and specifies a maximum range within which resource characteristic are deemed similar. Generally, the larger the threshold, the larger group sizes tend to become.
These properties lead a query to find the appropriate group leader as the first step, and then searching within the group as the next step.
3.3 Using Space-Filling Curves to Handle Multi-Attribute Range Queries
While describing the SOG architecture we mentioned that groups are formed by a collection of nodes with similar resource characteristics. For simplicity, this could be thought of as based on a single attribute from resources. However, there is no constraint placed by the SOG framework that limits the statistical charac-teristic to be derived from a single attribute. In fact the statistical characteristic, may be a function based on some or all of the attributes involved. Though it is possible to handle a multi-attribute range query by just using a resource characteristic from a single at-tribute, selecting a suitable attribute can be extremely challenging. This is because the selection needs to be based on the characteristics of Grid environments and application requirements, both of which are expected to be dynamic. Empirical evidence confirm a perfor-mance deterioration when resource discovery query is not against the grouping attribute [28]. This suggests a need to use multiple-attributes for evaluating the resource characteristic. One such possible function can be based on space-filling curves [2], which maps an n-dimensional space into a 1-dimensional curve. Here we consider the Hilbert space-filling curve to illustrate how space filling curves are used to evaluate the statistical characteristic.
3.3.1 Hilbert Space-Filling Curve
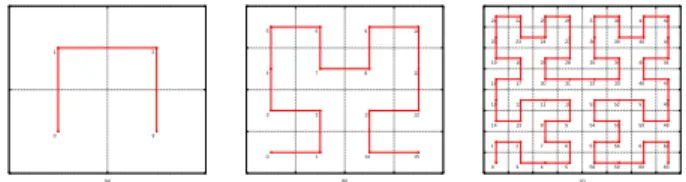
A space-filling curve provides a mapping between 1-D andd-dimensional space. This mapping can be thought of geometrically, dividing d-dimensional space into d -dimension hypercubes, with a line passing exactly once through each hypercube. This line transforms coordi-nates from a d-dimension space to the corresponding 1-D space that define their relative ordering (figure 2 illustrates first, second and third order Hilbert curves in the 2-D space). The Hilbert space-filling curve [23] is one of space-filling curves the is most widely used.
The locality preserving property of Hilbert SFC results in coordinates that have close mapping in 1-D
space are guaranteed to be close in d-dimensional space. However, this property does not hold in reverse mapping, because two coordinates that are close in
d-dimensional space might not be close in its corre-sponding 1-D space. So if the 1-D Hilbert SFC mapping is used to form SOG groups, two resources that could have been otherwise grouped together are in separate groups. However, SOG is designed to overcome this drawback and nd a small increase in the number of groups should not have a noticeable effect on query performance. (a) 0 1 3 2 (b) 0 3 4 5 1 2 7 6 14 13 8 9 15 12 11 10 (c) 0 1 14 15 16 19 20 21 3 2 13 12 17 18 23 22 4 7 8 11 30 29 24 25 5 6 9 10 31 28 27 26 58 57 54 53 32 35 36 37 59 56 55 52 33 34 39 38 60 61 50 51 46 45 40 41 63 62 49 48 47 44 43 42
Fig. 2 2-D Hilbert space-filling curve (a) first-order; (b) second-order; (c) third-order.
In this work, an iterative implementation is used to construct Hilbert SFC based on Butz’s algorithm [5], along with the improvements presented in [19]. The use of a faster implementation [16] is planned for fu-ture work, which should not affect the research find-ings being presented in this paper. Using Hilbert SFC also allows our approach to flexibly control the num-ber and size of groups. The numnum-ber of iterations in this algorithm is equal to the order of the Hilbert curve being constructed. The order of the curve represents the granularity of the curve. A d-dimension order ‘k’ Hilbert SFC, will partition thed-dimensional cube into 2kd
sub-cubes. We choose the 1-D index mapping from the Hilbert SFC to measure resource similarity. The SOG framework groups resources autonomously by tak-ing advantage of the clustertak-ing property [23] of Hilbert SFC. We exploit the locality preserving mapping to per-form grouping around a 1-D index space.
3.3.2 Motivation for using Hilbert Space-Filling Curve
In this section we try to motivate the reason for our choice of Hilbert SFC and address concerns a reader may have about the wisdom of using Hilbert SFC for determining SOG Groups. Instead of using SFCs, one might believe measuring similarity directly on the d-D Euclidean space, or for that matter using any function that maps the resource space to a group index, would be a easier option. In fact, as we have stated earlier, the SOG approach is agnostic with respect to the met-ric used to measure similarity. This, we argue, is one of the advantages of the SOG approach and makes it
adaptable to different scenarios. Even though any simi-larity metric can be used, we do believe that using SFC for similarity measure is appropriate for dealing with multi-attribute range queries due to the following rea-sons:
1. Similarity measurement in a 1-D Hilbert space is simple and fast;
2. Amount of storage is needed across all nodes is low; and
3. Communication cost is low.
Faster similarity measurement is important because it is one of the widely used operations in the SOG framework. It is used in algorithms to determine re-source grouping, detecting leader collision and query routing. On the Hilbert space, identifying similarity be-tween two Hilbert-codes is a matter of doing a simple XOR operation, while the same operation on a d-D Eu-clidean space will be much more expensive1
. An astute reader will point out that calculation of the Hilbert code itself will incur cost. This is indeed true, but it is impor-tant to note that once a Hilbert code has been calcu-lated, it is used a number of times to measure similarity since this operation is occurs much more often2
. Since every node in the system records the infor-mation about all the leader nodes, it is also important to minimize the amount of data that is needed to be stored to identify the leader and describe its charac-teristics. The use of Hilbert curve helps us limit the amount of space needed to describe the resource. For example, a curve with dimension d and order k required only k*d number of bits to describe the resource char-acteristics3
. Since the resource can be described in k*d bits, this lowers the overall storage requirement needed by each node. Furthermore, by sending the 1-D Hilbert code to describe resources, the quantity of data to be communicated between the nodes is reduced, lowering the requirement of network bandwidth.
One may argue that similar savings may be achieved by normalizing the resources and assigning a group in-dex. Assigning a group index alone will not be suffi-cient since the characteristics of the group is necessary for routing, so some sort of mapping between the in-dex space and resource space is needed. In our imple-mentation the Hilbert SFC provides such an implicit index, based on an locality preserving mapping from index to resource space. Any approach that uses an im-plicit mapping will predefine the logical group bound-aries and will be no better than the Hilbert SFC, since
1
Requires d-subtraction, d-multiplication, d-addition and one square-root calculation.
2
Similarity measurement occurs multiple times during every leader election, query routing and comparison steps.
3
it is not possible to guarantee closeness in d-D space will result in closeness in 1-D space. If a method with an explicit dynamic mapping or no mapping at all (i.e. d-D Euclidean coordinate) is used, the amount of data that needs to be stored and communicated will sub-stantially increase. In a similar vein, a normalization scheme will not perform better than a SFC. Further-more, the SFC provides a structured and well defined code, which unlike an unstructured normalization and mapping scheme, can be efficiently computed and is well understood.
Lastly, we would argue that even if in some cases replacing SFC with a d-D coordinate space is a possi-bility, the gains are quite minimal. The only potential advantage is that the resources may be found faster (i.e. smaller number of hops). But as we will see in our experiments (section 6), the performance of SOG as measured by the number of hops is excellent and we do not anticipate any significant performance improve-ments even if we would decide to do a direct comparison in the d-D space. In the next section, we discuss in de-tail how this Hilbert SFC mapping is used for creating SOG groups and how multi-attribute range queries are handled.
4 Algorithms for SOG implementation
In this section we present the algorithmic details of SOG framework. We discuss in detail how self-organization occurs through group formation, how queries are handled and how Hilbert SFC mappings is used to handle multi-attribute range queries.
4.1 SOG Algorithm
4.1.1 Data and Query Model
Each resource is represented as a typed (attribute, value) pair. Each node is composed as a conjunction of a number of such resources. Each resource is repre-sented as a tuple of (type, attribute, value), where a type can beint, float, double, char, or string in the current implementation.
Similarly, a query in SOG is composed of a con-junction of tuples in the form of (attribute, opera-tor, value). The type associated with the attribute in a query is assumed to be same as that of the corre-sponding resource. The operators currently supported include<, >, ≤, ≥, =, 6=. Disjunction queries can be split and implemented as separate queries.
4.1.2 Data Structures For each noden we define:
1: c; {Statistical characteristic}. Initially c ←
undef ined
2: R;{Set of recent observations}. InitiallyR← ∅ 3: L;{Set of all leaders}. InitiallyL← ∅
4: S;{Set of statistical characteristic (c) values for all L, addressable as S(l′), where l′ ∈ L }. Initially
S← ∅
5: l;{Node’s Leader}. Initiallyl←undef ined
6: isLeader;{Is node a leader?}. InitiallyisLeader←
f alse
7: x; {Rounds after which the statistic is recalcu-lated}. Initiallyx←pre−def ined constant
Additionally for leader nodes we define:
1: W;{Set of all worker nodes that report to it}. Ini-tiallyW ← ∅
2: S′;{Set ofcvalues for allW, addressable asS′(w),
wherew∈W}. InitiallyS′← ∅
3: V {Set of current resource status for all workers in W, addressable as V(w), where w∈ W}. Initially V ← ∅
4.1.3 Subscribe and Unsubscribe
A nodenjoins the Grid through noden′, which it learns
about offline. The node n sends a ‘subscribe’ message to n′, which forwards the message to a subset of its
neighbors (algorithm 2). It receives the current state of the Grid as captured by noden′. Furthermore, noden
will receive all the gossip messages thatn′ will receive
in future.
Algorithm 2Subscribe(n,n′): Node n joins the Grid
through noden′
1: Send asubscribemessage ton′{Subscribe as in [3]}
2: Receive setsLn′ andSn′ from noden′
3: L←LSL
n′;S←S
SS
n′;
Algorithm 3 deals with the case in which a node leaves the Grid. If the departing node happens to be a leader, then a replacement leader is selected before the node unsubscribes. This prevents the loss of existing grouping knowledge.
4.1.4 Group Formation and Maintenance
Algorithm 4 outlines the formation and maintenance of self-organized groups. Each node periodically checks to see if it is placed in an appropriate group, based on its
Algorithm 3Unsubscribe(n): Nodenleaves the Grid
1: ifn.isLeader=truethen
2: replace leader(){Select replacement}
3: Piggybackresignmessage to unsubscribe message
4: end if
5: Unsubscribe as in [3]
temporal values and the statistical similarity measure used (steps 5-7, algorithm 4). If not, it searches for a group to which it should belong (step 9). If there is no existing group for the node to join, it creates a new group with itself as leader and its current characteristic as the group’s characteristic (step 12). If the departing node happens to be a group leader, then it will first select a replacement leader before it leaves the group, thereby maintaining the existing grouping information (step 21).
Algorithm 4Group Formation, Maintenance: at node n
event count ← 0{Timer count for periodic recalculation of
statistic (c)}
1: r←poll resource();{Periodic resource status sampling}
2: Record entry(R, r);{Add current sample to R, replacing old
samples in round-robin fashion if necessary}
3: event count++;
4: ifevent count=xthen
5: c←recalculate c(R);{Recalculate characteristic (c)}
6: event count←0;
7: if l = undef ined ∨ (n.isLeader = f alse ∧
is not similar(S(l), c))then
8: {Either nodenbelongs to no group ornis a non-leader
that has moved away from its group}
9: l′ ← f ind leader node(c, L, S);{Find an appropriate
leader}
10: ifl′=undef inedthen
11: {No leader was found}
12: random delay(){This delay is added to reduce
con-flicts (see analysis section)}
13: gossip proclaim leadership(n,c);{Proclaim node as
leader through gossip}
14: else
15: {A new leader was found}
16: Inform nodel′aboutnjoining its group
17: Inform node l about n leaving its group if l 6=
undef ined
18: l←l′ {Assign new leader}
19: end if
20: else if n.isLeader ∧ is not similar(c, S(n)) ∧
change persistent()then
21: {Leader nodenhas moved away from its group range}
22: replace leader();
23: end if
24: end if
The strategies developed to minimize the number of gossip messages are two-fold: 1) a leader changes its group only if it observes a persistent change in its
statistical characteristic; 2) once a node has become a leader, it does not gossip its changing characteristic pe-riodically. Through the application of these strategies, a group is identified by the characteristic, that was gos-siped when its last leader was elected. When a leader’s current characteristic is significantly different from its group’s characteristic (steps 19-22), the leader identi-fies a node among its workers whose characteristic is the closest to the group’s characteristic and instructs that node to take over as the new leader of the group (steps 1-5, algorithm 5). This method of selecting a re-placement leader ensures that the group under the new leader will have a similar characteristic to the group’s characteristic under the current leader and there will be a minimal change in the group composition. Algo-rithm 5 is used to implement leader replacement. Once a replacement leader has been found, the current leader identifies an appropriate group for itself (steps 6-18).
Algorithm 5Replace Leader: replace leader() at node n
1: Select a nodel′′∈W− {n} |similarity value(S′(l′′) ,S(n))
is minimum{Find a node with characteristic most similar to
the group’s characteristic}
2: if l′′6=undef inedthen
3: Send a message tol′′asking it to proclaim leadership
4: ∀w∈W, send a message identifyingl′′as a new leader
5: end if
6: if nis not unsubscribingthen
7: {If a node is unsubscribing it does not need to find a group
it should belong to}
8: l′ ← f ind leader node(c, L, S);{Find an appropriate
leader}
9: ifl′=undef inedthen
10: {No leader was found}
11: random delay(){This delay is added to reduce conflicts
(see analysis section)}
12: gossip proclaim change characteristic(n,c); {Proclaim
new characteristic through gossip}
13: else
14: {New leader was found}
15: gossip proclaim resign leadership(n);{Resign leadership
through gossip}
16: Inform nodel′aboutnjoining its group
17: l←l′;{Assign new leader}
18: end if
19: end if
Due to autonomous decisions made at the node level, a conflict occurs when multiple nodes attempt to form different groups that have statistically similar characteristic. This results in a temporary fracture of a logical group with multiple nodes claiming to leaders of a small faction. Conflict detection occurs on at-least one of the conflicting leaders. This detection is done when a leader node receives a proclaim message from another node that claims the leadership of a
statistically similar group. Once a conflict is detected the leader sends a ‘conflict detected’ message to the offending node along the effective size of its group. The effective size of the group is same as the group size if there are no other outstanding conflicts; but if there are other outstanding conflicts, it is the group size that was reported to the first offending node. This guarantees that if there are conflicts among more than two groups exactly one leader is elected for the merged group after all conflicts are resolved. Conflicts among more than two leaders are handled in a pairwise manner. The groups then merge according to their effective size reported with the leader of the larger group becoming the leader of the merged group; and ties are broken randomly4
.
4.1.5 Query Routing
A query request is submitted to a local node. SOG is designed to return a node at which the resource is avail-able. A non-leader node tries to satisfy a request if it can, otherwise it will direct the query to the leader of a group with the pre-specified characteristic similar to the request made in the query. In the absence of such a leader, the query is randomly forwarded to one of the node’s gossip neighbors (the lower level overlay). A leader node (included in its group) will try to find a worker node, such that based on the leader’s cur-rent knowledge, the worker node is able to satisfy the query. If such a worker is not available, the leader tries to find another leader that is likely to satisfy the query. The query is randomly forwarded as a last resort. Algo-rithms 6 and 7 handle queries at non-leader and leader nodes respectively. In section 5 we analyze these algo-rithms, particularly with respect to complexity of leader election process, and communication overhead. SOG re-source discovery mechanisms are evaluated by experi-ments in section 6.
4.2 Using Hilbert SFC Mapping
In this section we illustrate how the Hilbert SFC map-ping is used to create SOG groups and how multi-attribute range queries are handled. We have already discussed the motivation of using the Hilbert SFC map-ping for tacking multi-attribute range query in section 3.3.2.
4
We can use a predefined scheme (e.g. lexical ordering of IP address).
Algorithm 6Handle Query: at non-leader noden
1: if n.can satisfy query()=truethen
2: {Query is satisfied}
3: Notify requesting node about resource availability
4: else
5: {Forward query, direct query to suitable leader}
6: Findl′∈L|is similar(S(l′), query request) OR
is likely to satisf y(S(l′), query request)
7: ifl′6=undef inedthen
8: Forward query tol′{A Leader is found}
9: else
10: {No leader is found that might satisfy query}
11: Randomly forward the query to one of the node in the
local view formed by gossip 12: end if
13: end if
Algorithm 7Handle Query: at leader noden
1: Find n′ ∈ W|is likely to satisf y(S′(n′) , query request)
{Find a worker to forward the query to}
2: if n′6=undef inedthen
3: {Worker capable of satisfying query found}
4: Forward query ton′
5: else
6: {No worker node is found}
7: Find l′ ∈ L|l′! = n ∧ is likely to satisf y(S(l′)
, query request) {Find another leader capable of
satisfy-ing the query}
8: ifl′6=undef inedthen
9: Forward query tol′ {Leader is found}
10: else
11: {No leader is found that might satisfy query}
12: Randomly forward query to one of the node in the local
view formed by gossip 13: end if
14: end if
4.2.1 Forming Groups
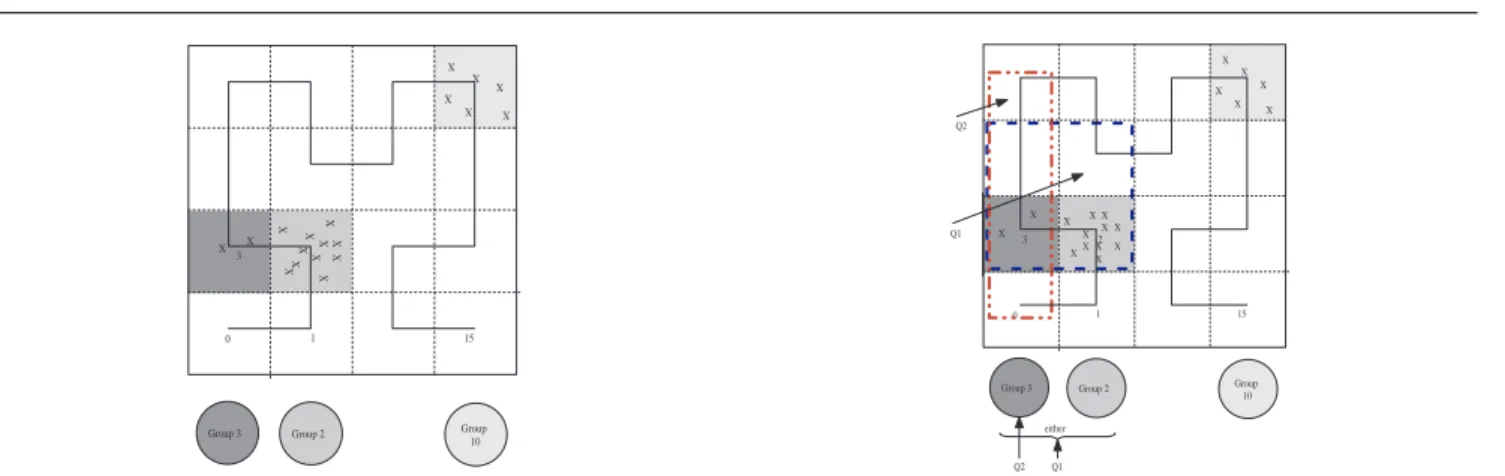
Hilbert SFC is used to produce a unique transformation of the d-dimensional resource status information to a corresponding 1-D Hilbert coordinate section. Using this 1-D Hilbert coordinate as the grouping attribute, SOG groups can be formed in a bottom-up fashion. Each node autonomously and periodically checks to ensure that it belongs to a correct group, based on its Hilbert coordinate. If its Hilbert coordinate has changed, a node attempts to identify and get assigned to the correct group. Details on how groups are formed and managed in SOG have been discussed in the ear-lier section5
. Figure 3 illustrates an example of how grouping is achieved in SOG using Hilbert coordinates. Nodes that lie in the same cell are mapped to the same Hilbert coordinate section, and are grouped together in the SOG framework. In figure 3, the nodes are arranged into three groups by the SOG grouping process.
5
The grouping process remains unchanged with the grouping attribute replaced by the Hilbert coordinate.
Group 3 Group 2 Group10 X X 3 2 1 0 10 15 X X X X X X X X X X X X X X X X X
Fig. 3 Forming Self-Organized Groups using Hilbert SFC Map-ping
Using the 1-D Hilbert coordinate as the grouping at-tribute also allows SOG to control group sizes through the ‘order’ of the Hilbert curve. By changing the order of the Hilbert SFC used, we can control the number of groups and the size of each group. A high order curve results in a larger number of groups (with each group having relatively a few members), while a low order curve would result in a smaller number of groups. In practice a very high order curves are not necessary for the sake of grouping in SOG6
. Furthermore, this space tends to be sparsely populated with resources due to resource clustering and only a small fraction of the po-tential groups tend to form. In our experiments curves with at most order of 4 were evaluated.
4.2.2 Multi-attribute Range Query Processing
SOG query processing component routes queries on its overlay, by exploiting the information on the identity of group leaders and their Hilbert coordinates7
. Each node that receives a query is able to route it to a suit-able leader, which represents a group of workers, one of which is likely to satisfy the query. When a multi-attribute query arrives at a leader node, the leader routes the query to a worker that is capable of sat-isfying the query. When such a query is received by a non-leader node, it first checks if it can successfully satisfy the query. If not, the processing node identifies a set of groups such that the intersection between the groups space and the query space is not empty. The query is forwarded to any one of the groups in this set, since all the groups in this set are likely to be of interest to the query. If the intersection set is empty, the query
6
Even with an order 4 curve on a 4-D space can have po-tentially 24∗4
groups, while the 10-D space could produce 24∗10
groups. 7
The query processing remains unchanged except for the use of the Hilbert coordinate as grouping attribute.
Group 3 Group 2 Group 10 Q1 either Q2 1 0 15 Q1 X X 3 X2 X X X X X X X X X X X X X X X X Q2
Fig. 4 Multi-Attribute Range Query Routing
is randomly forwarded on the lower-level overlay layer. This intersection between the resource and query space is determined by comparing the Hilbert coordinates.
Figure 4 illustrates the process of routing the query. The queries Q1 and Q2 are interested in ranges as shown in figure 4. Q1’s query space is mapped to sec-tions 2, 3, 4 & 7 on the 1-D Hilbert coordinate space. Since groups associated with both sections 2 & 3 ex-ist, the query is routed to the leaders of either of the groups with equal probability. Q2’s’ query space on the other hand transforms to Hilbert coordinate sections 0, 3, 4 & 5. The query is routed to the leader of group 3 since this is the only existing group, for which the in-tersection between group space and query space is not empty. A time-to-live (TTL) parameter is also set, so that a query can be dropped after a certain number of hops on the overlay, if resource does not exist, or cannot be successfully discovered.
We anticipate only a relatively small number of at-tributes for grouping, perhaps in the 10’s. A fair ques-tion would be what if we have 1000’s of attributes in the system that could be potentially queried. In gen-eral there are a small number of attributes (e.g. mem-ory, disk availability, wallclock limit) that tend to be most important and widely used and such attributes are well suited to be used for grouping in the SOG frame-work. The choice of particular attributes for grouping would depend extensively on the nature of Grid en-vironments and their usage. It should be noted that using too many attributes for grouping may cause the space to be finely divided and the grouping of resources will not be achieved. If on the other hand we use too few attributes for grouping then searching on the re-maining attributes would suffer performance deteriora-tion. Since both options could have potentially nega-tive impact on query performance, we try to achieve a balance between these conflicting conditions by se-lecting widely used attributes for grouping. Even at-tributes that have not been used for grouping can still
be searched, though the performance of queries against these attributes might suffer. Experiments in the sec-tion 6 help us verify the performance of the SOG frame-work.
5 Analysis of the SOG Framework
In this section we evaluate the SOG framework and demonstrate its low communication overhead and quick self-organization, associated with the leader election process. To do this we calculate the efficiency of the leader election algorithm in terms of the number of messages needed and time taken for leader election. The problem of leader election that we address is dif-ferent from the traditional leader election problem, in that not only all the members of a group should agree on one leader, but also all the nodes in the system need to know the leader’s identity. We concentrate on ‘gossip’ messages to assess communication overhead since they account for the majority of the overhead. Since leaders play a pivotal role in handling queries efficiently, the election of a leader is used as a met-ric to measure self-organization. Also time taken for leader election indicates how well the framework han-dles system perturbations (e.g. resource characteristic changing, leader leaving).
5.1 Model
There are ndistinct nodes, which form ggroups, with m nodes in each group. All decisions are made au-tonomously and independently at each node. We an-alyze the number of messages needed to elect a leader for each group. The model assumes no loss of messages. Furthermore, none of the nodes in the system have a global knowledge. Instead, each node maintains a local view ofO(logn) neighbors, based on the way the lower-level overlay is formed (section 3.1). Moreover, group membership is not known beforehand and is dynami-cally determined by a statistical characteristic, so tra-ditional methods of leader election (e.g. selecting node with the highest id) are not feasible for our problem. We consider the following cases in our analysis:
1. Worst case analysis (No suppression delay) 2. With a random suppression delay added
5.2 Worst Case Analysis
Lemma 1 The worst case message complexity for electing the leader of a single group is O(m) gossip messages, where m is the size of the group.
Proof We will first consider the group containing m nodes trying to elect a leader. In the worst case all the nodes will ‘proclaim’ themselves as leader. HenceO(m) gossip messages8
will be sent, one by each node. This will be followed by conflict resolution, done pairwise, leading to 2× m
2
messages andm−1 gossip messages to resign leadership, before a leader is elected.
Hence leader election involves, O(m) gossip and O(m2
) pairwise messages. Since each gossip message results innlogn andm ≤n O(m) gossip messages is
a dominant factor. Hence the proof. ⊓⊔
Theorem 1 The worst case message complexity for electing all leaders isO(n)gossip messages, wherenis the total number of nodes.
Proof Since each node in the system will occur exactly in one group, proof follows from Lemma 1 ⊓⊔
We could do better by simply sending direct mes-sages from each of themnodes, to the nnodes in the system. This would lead to just O(m∗n) messages, which would be better than the worst case presented above. But such an approach is infeasible, because as stated earlier no node in the system has the knowledge of allnnodes in the system. We will discuss a technique to improve this message complexity in the next section.
5.3 Analysis - with random suppression delay added Suppression is a technique by which we introduce some random delay before a node decides to send a ‘proclaim’ message. That implies that before a node sends a ‘gos-sip’ message it waits for some random time and then revisits its decision to send the ‘gossip’ message. This is a standard technique and has been used in previ-ous research [9] for leader election analysis. LetTd be a random variable which has a probability density func-tionp(t) and the corresponding cumulative distribution functionP(t). Let∆ be the propagation delay, i.e. the amount of time taken before a message sent by gos-sip reaches all the nodes. We will consider a bounded propagation delay, i.e.∆=constant9
.
Let∆=θ, a constant, i.e. if a message was sent by a node at timetall nodes in the system will have received the message by time t +θ. The goal is to minimize the time taken for leader election to complete as well as minimize message complexity. We will construct the functionp(t) as a discrete uniform distribution defined
8
One gossip message will result tonlognindividual messages.
9
In practice this constant could be equal to 3 * maximum round trip time between grid nodes.
as follows p(t) =
(1
m fort∈0, θ,2θ, . . . ,(m−1)θ
0 otherwise (1)
At this stage one may argue that this function can-not be constructed by the nodes, since the nodes have no knowledge of m. It is true that nodes do not have a correct knowledge of m, but since we know that each node hasO(logn), each node can essentially estimaten, which can be used in place ofmin the above function10
. Sincep(t) is the probability function used for sup-pression delay, nodes can send gossip messages at time slots t= (0,1, . . . , m−1)θ. If one or more nodes send ‘proclaim’ messages at t=cθ, none of the other nodes will send messages at t ≥ (c+ 1)θ. This is because the bounded message propagation delay of θ guaran-tees that all nodes will have received the message at (c+ 1)θ, and based on the algorithm no other nodes will send a ‘proclaim’ message beyond this time. Since we have established the number of gossip messages is a dominant factor, the pair-wise messages needed to resolve conflicts, can be neglected.
5.3.1 Calculating Time Complexity of Leader Election
:
This section estimates the time taken for the leader of a group to be elected. We will show that the expected time for electing a leader is O(1) and that with high probability the time taken to elect a leader isO(lnm).
Lemma 2 A leader of a group is expected to be elected inO(1) time.
Proof Let X be a random variable which denotes the earliest slot at which a proclaim message was sent. We will like to show thatE(X) =O(1);
P[N ode sends‘proclaim′ at time t=kθ] = 1
m P[N o‘proclaim′ at time t=kθ] = (1− 1 m) m ≈ 1 e P rob(X =i) = (1 ei(1− 1 e) fori= 0,1,2, . . . , 0 otherwise
So X essentially has a Geometric distribution with parameter (success probability) 1−1
e ∴E(X) = 1 e 1−1 e =O(1)
So a group leader is expected to be elected in constant
time. ⊓⊔
10
Sincen≥mit provides a upper bound value form.
Lemma 3 With high probability the leader of a group will be elected inO(lnm)time.
Proof Let X be a random variable as defined in lemma 2. We will like to show thatP rob(X ≤clogm)>1−
1
m. Also as we showed in lemma 2 X has a Geometric distribution with parameter 1− 1
e and a probability density function of P rob(X =i) = 1 ei(1− 1 e) So, P rob(X < k) =Pk−1 i=0 1 ei(1− 1 e) > 1− 1 ek−1 Usingk= lnm+ 1, P rob(X <lnm+ 1)>1− 1 m
Hence the proof. ⊓⊔
With these two lemmas we have shown that the leader of a single group is elected with high probability inO(lnm) time, and the expected time for leader elec-tion is constant. Since stabilizaelec-tion in SOG occurs on election of group leaders, the system does not take too long to stabilize.
5.3.2 Calculating Message Complexity of Leader Election
In this section we estimate the number of messages sent before a group leader is elected. We will show that the expected number of gossip messages11
taken to elect a leader isO(1) and that with high probability the num-ber of gossip messages taken is bounded byO( lnm
ln lnm).
Lemma 4 A leader of a single group is expected to be elected withO(1)gossip messages.
Proof Let Y be a random variable which represents the number of nodes that decide to become leader at any slot. So in order to prove this lemma all we need to show is thatE(Y) =O(1). This is true since each node selects a slot using the discrete uniform distribution (probabil-ity dens(probabil-ity function in equation 1). Hence proof. ⊓⊔
Lemma 5 With high probability the leader of a single group will be elected withO( lnm
ln lnm) gossip messages.
11
Since the gossip messages are dominant factor we ignore pair-wise messages sent for conflict resolution.
Proof Again, let Y be a random variable which repre-sents the number of nodes that decide to become leaders at any slot. We want to find the maximum number of possible collisions in any slot. This problem is equiva-lent to occupancy problem or balls in bin problem. Us-ing Chapter 3, Theorem 3.1 of [24], we know that with probability of at least 1− 1
m, there are no more than elnn
ln lnm coalition. Hence the proof. ⊓⊔
Theorem 2 With a high probability, over allg groups the gossip messages complexity isO(g lnm
ln lnm), for
elect-ing group leaders.
Proof Follows by using union bound on lemma 5. ⊓⊔
This shows that the way SOG framework uses gossip communication for leader election keeps the communi-cation overhead low.
So in essence analysis in this section we establish that the SOG framework has a low communication overhead and stabilizes quickly. This result demon-strates the scalability of the SOG framework which is further validated with the experimental observations.
6 Performance Evaluation
This section demonstrates how SOG achieves the scal-ability to a significant number of users and resources and excellent query performance when processing multi-attribute range queries. First we introduce Grid environments for the experiments. Then we study the effect of SFC attributes and measure query perfor-mance. We show that excellent performance is observed both in terms of the number of hops and query re-sponse time. Further we demonstrate the suitability of the SOG framework for routing multi-attribute range queries using Hilbert SFC. Finally we demonstrate that SOG approach is scalable to a large number of Grid nodes.
6.1 Modeling Grid Environments
For the experiments presented in this research, the fol-lowing parameters are used to specify the Grid environ-ments and model SOG on it.
1. Dimension of multi-attribute space represents the number of attributes that are considered for group-ing. Experiments assume a 4-D, 6-D, 8-D, 10-D re-source space12
.
12
The resources considered for the experiments include: 1) free memory, 2) average 1 min system load, 3) total memory, 4) num-ber of running processes, 5) user CPU usage, 6) total IO rate
2. Order of Hilbert space filling curve is used to control the granularity for assessing resource similarity. The lower the order of a Hilbert curve, the coarser its granularity is. We examine the effect of the order of Hilbert curve on query performance. The order values are set between 1 and 4. A curve of order 4 is quite sufficient for the purposes of grouping similar resources and keeping dissimilar resources apart. 3. Resource density reflects the percentage of nodes
that have resources available. Since the resource in-formation for these experiments was collected in near real-time from Open Science Grid (OSG) [26] nodes, we do not control the resource density for various queries. We would, however, study the ef-fect of resource density on query performance. 4. Resource discovery query performance is measured
using the average number of hops (taken by a query) as a metric. The number of hops is measured on SOG overlay network. Each node in the overlay gen-erates an equal number of queries. Therefore, an originating node does not have any effect on the average hops observed in the experiments.
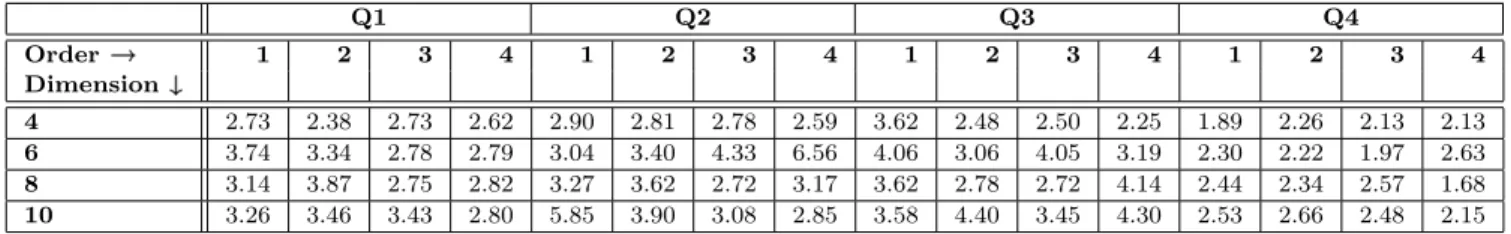
In our experiments we use the following types of range queries:
Q1:1024≤freeMem13
<2048 && load1 == 0 && 2048≤totalMem<3072 && procRun == 0
Q2: 1024 ≤freeMem < 3072 && load1 == 0 && 2048≤totalMem<4096 && procRun≤2
Q3: 1024 ≤freeMem < 3072 && load1 == 0 && totalMem ≥2048 && procRun ≤2
Q4:load1 == 0
From the queries listed above, we can see that query space increases from Q1 to Q4. In other words, we go from a more specialized query in Q1, which queries a small search space, to a more generalized query in Q4, corresponding to a large search space. Furthermore, Q4 represents a query search on only one attribute. The at-tributes that are not constrained are treated as “don’t care” (i.e. any value for those attributes is acceptable). These queries are chosen because they are representa-tive of various classes of queries. For each of the above query types, we conducted experiments with the order of Hilbert SFC ranging from 1 to 4.
in, 7) total IO rate out, 8) disk free, 9) number of CPUs, 10) avg 5 min load. When considering a 4-D attribute space the first 4 listed resources are used, while for a 10-D attribute space all attributes are used.
13
6.2 Experiment Setup
Resource usage information was collected from the Open Science Grid [26] using MonALISA [25] for this category of experiments.
6.2.1 Open Science Grid
The Open Science Grid (OSG) is a grassroots con-sortium of software,resource providers and researchers from universities, national laboratories and comput-ing centers across the U.S. It provides a national production-quality Grid infrastructure by connecting distributed computing and storage resources via a common set of middleware to enable collaborative scientific discovery. This infrastructure is highly het-erogeneous and consists of over 75 sites with thousands of computational resources and a large number of users. To simulate Grid environments, we use both static and dynamic resource information captured by near real-time monitoring of OSG resources.
6.2.2 MonALISA
MonALISA is agent-based dynamic distributed moni-toring system. MonALISA collects static and dynamic availability information of OSG resources in near real-time, which allows us to emulate the OSG environment. The monitoring information that is collected includes information for nodes and clusters, network, jobs and services.
The experiments were conducted in a simulated en-vironment that contains 1024 nodes. Experiments with 2048 and 4096 nodes were conducted in order to demon-strate scalability. Each participating node generates ap-proximately 200 queries during the period of each mea-surement. Our experiments were run in a distributed environment using several 64-bit Athlon desktop ma-chines.
6.3 Evaluating the Effect of Hilbert SFC Parameters In this section we evaluate the effect of varying Hilbert SFC parameters of the SOG framework. Specifically we focus on the effect of changing the number of dimension and order of Hilbert SFC on performance.
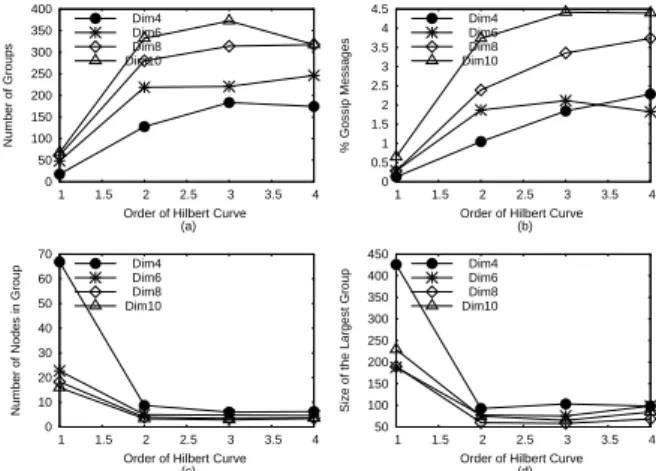
Figure 5 illustrates the effect of order and number of dimension of Hilbert SFC on SOG performance, av-eraged over all types of queries, since the query type has no impact on the values being measured. An in-crease in the granularity of the Hilbert curve results in
0 50 100 150 200 250 300 350 400 1 1.5 2 2.5 3 3.5 4 Number of Groups
Order of Hilbert Curve (a) Dim4 Dim6 Dim8 Dim10 0 0.5 1 1.5 2 2.5 3 3.5 4 4.5 1 1.5 2 2.5 3 3.5 4 % Gossip Messages
Order of Hilbert Curve (b) Dim4 Dim6 Dim8 Dim10 0 10 20 30 40 50 60 70 1 1.5 2 2.5 3 3.5 4
Number of Nodes in Group
Order of Hilbert Curve (c) Dim4 Dim6 Dim8 Dim10 50 100 150 200 250 300 350 400 450 1 1.5 2 2.5 3 3.5 4
Size of the Largest Group
Order of Hilbert Curve (d) Dim4 Dim6 Dim8 Dim10
Fig. 5 Evaluating the effect of Hilbert SFC parameters on SOG Performance averaged over all queries (a) total number of groups, (b) gossip communication, (c) average group size, (d) maximum group size
an increase in the number of groups for every sion. Furthermore, an increase in the number of dimen-sion keeping order unchanged also causes an increase in the number of SOG groups (figure 5 (a)). This is be-cause an increase in either order or dimension tends to make the groups more specialized, thereby groups are potentially split. A similar trend is observed with the percentage of gossip messages in figure 5 (b). The num-ber of gossip messages needed for stabilization tends to increase with an increase in either of the Hilbert SFC parameter. This is a direct effect of an increase in the number of groups. Consequently, in figure 5 (c) we see a decrease in the average group size as well as the size of the largest group (figure 5 (d)) as either of the SFC parameter values increase.
The linear relationship between the amount of gos-sip message and the group size can be seen from figure 6. The observation from this figure is consistent with the theoretical analysis (Lemma 4) where we showed that the expected number of gossip messages needed to elect a group leader is constant.
From these experiments we can summarize the ef-fect of Hilbert SFC parameter as follows. An increase in either the order or dimension of the SFC increases, tends to increase the number of resulting SOG groups. Consequently, this results in an increase in the num-ber of gossip messages needed to self-organize and a decrease in the size of individual groups.
The findings above indicate that SFC attributes need to be chosen carefully. Having a high order or dimension will result in higher communication over-head because of the fragmentation of groups. On the other hand, low order and dimension values, will not
0 20 40 60 80 100 1 2 3 4 % of communication
Order of Hilbert Curve Dimension=4 (a) Gossip overhead Update overhead Query response Query hops All communication overhead
0 20 40 60 80 100 1 2 3 4 % of communication
Order of Hilbert Curve Dimension=6 (b) Gossip overhead Update overhead Query response Query hops All communication overhead
0 20 40 60 80 100 1 2 3 4 % of communication
Order of Hilbert Curve Dimension=8 (c) Gossip overhead Update overhead Query response Query hops All communication overhead
0 20 40 60 80 100 1 2 3 4 % of communication
Order of Hilbert Curve Dimension=10 (d) Gossip overhead Update overhead Query response Query hops All communication overhead
Fig. 7 Communication costs associated with SOG components. Observations from experiments conducted with dimension values (a) 4; (b) 6; (c) 8; and (d) 10. 0 1 2 3 4 5 6 7 8 0 50 100 150 200 250 300 350 400 450 % of Gossip Number of Groups
Fig. 6 Relation between number of groups and gossip commu-nication
cluster resources into appropriate logical groups and will increase the possibility that some of the leader nodes would become hot-spots/bottlenecks during query processing. In other words, we need to balance these conflicting criteria when choosing the number
of grouping attributes14
and the order of the Hilbert SFC curve. Furthermore, as we shall see later in the experiments, the choice of the order and dimension also affects the performance of the SOG framework when handling resource discovery queries. The best choice should be determined by taking the nature of Grid environments and its expected usage into consideration.
6.4 Understanding Communication Costs
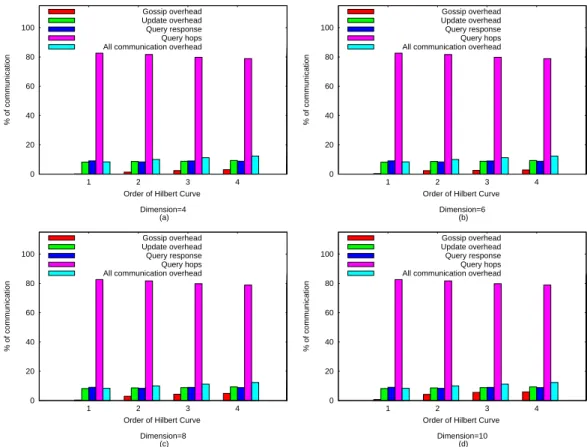
Since the SOG framework establishes a decentral-ized approach to resource discovery it is important to understand the communication overhead. Figure 7, illustrates the communication cost associated with various SOG components, by counting the messages exchanged over the lifetime of an experiment run. The figure highlights the communication costs incurred by different SOG components including cost of (1) gossip communication; (2) periodic updates from a worker
14
node to its leader; (3) responses to query messages15
; (4) hops taken by resource discovery queries; and (5) overall communication costs16
.
The results indicate that the communication over-head incurred by gossip is kept low (less than 5%), as is the cost for keeping the leader node updated with its worker node status (between 5 to 10 percent). So the overall overhead incurred for forming, maintaining and managing the SOG framework is kept quite low (between 5-15 percent). The remaining 85% of the time messages are exchanged in the SOG framework to han-dle resource discovery queries. Messages send trying to locate the requested resources account for around 70-80% messages exchanged, while approximately another 10-15% of the messages result from responses to the re-source discovery queries. So the SOG framework spends a significant amount of its network bandwidth utiliza-tion handling resource discovery queries, achieving low communication overhead. The low communication over-head observed is a direct result of the careful design of SOG algorithms to minimize gossip communication. As we will see in the next section the average number of hops taken by resource discovery queries is quite low, hence the overall communication cost incurred by the SOG framework is low.
6.5 Measuring Query Performance
The query performance of the SOG framework is mea-sured primarily in terms of the number of hops taken on the SOG overlay network. We also record the absolute time taken for each query and measure the reliability of our method.
Figures 8 shows the number of hops taken by re-source discovery queries before they were satisfied. The results for each query type was averaged over multi-ple runs with different values of order and dimension of Hilbert SFC. Sub-figures (a) and (b) respectively illus-trate the effect of order and dimension of Hilbert SFC on query performance. From these figures we observed that as the order increases the number of hops taken decreases. This is due to the fact that the groups are getting more specialized and queries are being directed more effectively to appropriate leader groups where re-sources can be found with an increased probability. At the first thought, one might expect the same kind of behavior where we increase the number of dimension, since this also makes the space more specialized. This
15
A response message received back at the node originating the query.
16
This includes the cost of gossip+update+other(e.g. messages exchanged when a node joins or leaves the system) messages.
1 1.5 2 2.5 3 3.5 4 1 2 3 4 Number of Hops
Order of Hilbert Curve (a) Q1 Q2 Q3 Q4 1.6 1.8 2 2.2 2.4 2.6 2.8 3 3.2 4 5 6 7 8 9 10 Number of Hops
Dimension of Hilbert Curve (b)
Q1 Q2 Q3 Q4
Fig. 8 Evaluating query performance using number of hops on SOG framework for queries as the (a) order of Hilbert SFC changes; (b) number of dimension used for constructing SOG groups changes.
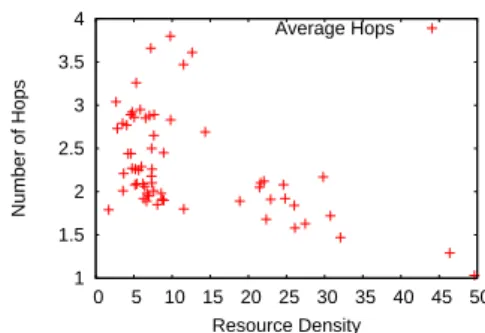
would indeed be true if our queries were against the new attribute that were added for grouping. However, since queries Q1-Q4 are querying against attributes that were already used for grouping, the addition of new dimen-sion actually causes some of the groups to fracture by specializing in these attributes which we were not inter-ested in our queries. Hence, we see that the performance tends to slightly degrade as the number of dimension increases. 1 1.5 2 2.5 3 3.5 4 0 5 10 15 20 25 30 35 40 45 50 Number of Hops Resource Density Average Hops
Fig. 9 Evaluating the effect of resource density on query perfor-mance
The effect of resource density on query performance is outlined in figure 9. Since there was no direct way to control or measure the density of dynamically chang-ing resources, we measured it indirectly through the percentage of queries that were satisfied in zero hops. Because query generation is uniformly distributed, this measure gives us a reliable empirical measure of re-source density. The graph indicates that the query per-formance remains relatively unaffected by the change in resource density. So essentially, query performance is equally good when the resources are either abundant
![Fig. 1 The upper level graph maintained by SOG (from [28])](https://thumb-us.123doks.com/thumbv2/123dok_us/9642215.2452406/4.892.132.357.316.473/fig-upper-level-graph-maintained-sog.webp)