R E S E A R C H
Open Access
Air pollution and mortality in a large,
representative U.S. cohort:
multiple-pollutant analyses, and spatial and
temporal decompositions
Jacob S. Lefler
1*, Joshua D. Higbee
2, Richard T. Burnett
3, Majid Ezzati
4, Nathan C. Coleman
5, Dalton D. Mann
5,
Julian D. Marshall
6, Matthew Bechle
6, Yuzhou Wang
6, Allen L. Robinson
7and C. Arden Pope III
5Abstract
Background:Cohort studies have documented associations between fine particulate matter air pollution (PM2.5) and mortality risk. However, there remains uncertainty regarding the contribution of co-pollutants and the stability of pollution-mortality associations in models that include multiple air pollutants. Furthermore, it is unclear whether the PM2.5-mortality relationship varies spatially, when exposures are decomposed according to scale of spatial variability, or temporally, when effect estimates are allowed to change between years.
Methods:A cohort of 635,539 individuals was compiled using public National Health Interview Survey (NHIS) data from 1987 to 2014 and linked with mortality follow-up through 2015. Modelled air pollution exposure estimates for PM2.5, other criteria air pollutants, and spatial decompositions (< 1 km, 1–10 km, 10–100 km, > 100 km) of PM2.5were assigned at the census-tract level. The NHIS samples were also divided into yearly cohorts for
temporally-decomposed analyses. Cox proportional hazards models were used to estimate hazard ratios (HRs) and 95% confidence intervals (CIs) in regression models that included up to six criteria pollutants; four spatial
decompositions of PM2.5; and two- and five-year lagged mean PM2.5exposures in the temporally-decomposed cohorts. Meta-analytic fixed-effect estimates were calculated using results from temporally-decomposed analyses and compared with time-independent results using 17- and 28-year exposure windows.
Results:In multiple-pollutant analyses, PM2.5demonstrated the most robust pollutant-mortality association. Coarse fraction particulate matter (PM2.5–10) and sulfur dioxide (SO2) were also associated with excess mortality risk. The PM2.5-mortality association was observed across all four spatial scales of PM2.5, with higher but less precisely estimated HRs observed for local (< 1 km) and neighborhood (1–10 km) variations. In temporally-decomposed analyses, the PM2.5-mortality HRs were stable across yearly cohorts. The meta-analytic HR using two-year lagged PM2.5equaled 1.10 (95% CI 1.07, 1.13) per 10μg/m
3
. Comparable results were observed in time-independent analyses using a 17-year (HR 1.13, CI 1.09, 1.16) or 28-year (HR 1.09, CI 1.07, 1.12) exposure window.
Conclusions:Long-term exposures to PM2.5, PM2.5–10, and SO2were associated with increased risk of all-cause and cardiopulmonary mortality. Each spatial decomposition of PM2.5was associated with mortality risk, and PM2.5 -mortality associations were consistent over time.
Keywords:Air pollution, Particulate matter, Sulfur dioxide, Mortality, Cardiopulmonary disease
© The Author(s). 2019Open AccessThis article is distributed under the terms of the Creative Commons Attribution 4.0 International License (http://creativecommons.org/licenses/by/4.0/), which permits unrestricted use, distribution, and reproduction in any medium, provided you give appropriate credit to the original author(s) and the source, provide a link to the Creative Commons license, and indicate if changes were made. The Creative Commons Public Domain Dedication waiver (http://creativecommons.org/publicdomain/zero/1.0/) applies to the data made available in this article, unless otherwise stated.
* Correspondence:[email protected]
1Department of Agricultural and Resource Economics, University of California,
Berkeley, CA 94720, USA
Background
Numerous studies have documented associations be-tween long-term exposure to fine particulate matter air pollution (PM2.5, particles < 2.5μm in aerodynamic
diameter) and risk of mortality. Notable cohort studies have indicated that elevated PM2.5exposures are
associ-ated with increased risks of all-cause and cardiopulmo-nary mortality [1–25]. Several studies have estimated the association between PM2.5 and mortality while
control-ling for exposures to one or more co-pollutants, such as ozone (O3), nitrogen dioxide (NO2), and sulfur dioxide
(SO2) [4, 5, 13, 20]. There remains a need for further
multiple-pollutant analyses that control for other com-mon air pollutants, including coarse fraction particulate matter (PM2.5–10, particles 2.5–10μm in aerodynamic
diameter) and carbon monoxide (CO).
Related to multiple-pollutant analyses are models that examine constituents of PM2.5rather than aggregated PM2.5
treated as a single pollutant. The composition and toxicity of PM2.5can vary substantially based on when and where it is
sampled and the distance from the pollution source [26,27]. Exposures that occur near a pollution source may include a larger fraction of primary combustion products (black carbon and primary organic aerosol) and other local sources (indus-trial and road dust). Alternatively, exposure may occur far-ther from the source, allowing a larger fraction of aged, agglomerated, and secondary particulate matter (sulfates, ni-trates, and secondary organic aerosol). Are there differences in the PM2.5-mortality associations across spatial
decomposi-tions of PM2.5pollution?
The composition of PM2.5not only varies spatially, but
may also vary temporally as sources of pollution change. Furthermore, ambient pollution levels change over time, and observed health effects of PM2.5 likely depend on
the window of exposure assigned to individuals in the cohort. Therefore, an important question is, are there differences in observed PM2.5-mortality associations
across time or for different windows of PM2.5exposure?
This study uses a large, well-documented, and repre-sentative cohort of the U.S. [25] to pursue three primary objectives. First, investigate pollution-mortality associa-tions with models that include multiple air pollutants. Second, explore differences in PM2.5-mortality
associa-tions across spatially-decomposed PM2.5as an evaluation
of whether the impact of PM2.5 depends on distance
from pollution source. Third, estimate PM2.5-mortality
associations in temporally-decomposed cohorts, allowing effect estimates to vary across time and for different choices of exposure window.
Methods
Study population
The cohort for this study was constructed using publicly-available National Health Interview Survey
(NHIS) data from 1987 to 2014, linked with restricted-use geographic information and mortality follow-up through 2015. The sample was limited to NHIS re-spondents aged 18–84 at the time of survey for whom information was available regarding age, sex, race-ethnicity, income, education, marital status, smoking status, BMI, census tract, ambient air pollution, survey date, mortality status at the end of 2015, and date of death (if deceased at the end of 2015).
The NHIS is a household survey administered annually by the National Center for Health Statistics (NCHS) and designed to be representative of the civilian noninstitu-tionalized U.S. population [28]. Survey data were linked with the National Death Index for mortality follow-up through 2015 [29]. The construction of this cohort has been described in a previous study [25], where it was re-ferred to as a“subcohort” of a larger NHIS cohort. This cohort, rather than the larger “full cohort” of the prior study, was chosen for the present analysis because it in-cluded information for smoking status and BMI. The NHIS design was altered periodically over the sample period, so some variables required harmonization. Data linkage was performed with permission and assistance from the NCHS. Further details on construction, harmonization, and data linkage for the NHIS cohort are documented elsewhere [25].
Air pollution data
Air pollution exposures were assigned to individuals based on their census tract of residence at the time of survey, using year-2000 Census tracts for individuals surveyed from 1987 to 2010 and year-2010 Census tracts for individuals surveyed from 2011 to 2014. Annual-average estimates of ambient air pollution were calcu-lated for criteria pollutants (PM2.5, PM10, SO2, NO2, O3,
and CO) using estimates from the v1 empirical models of Kim et al., 2018 [30], available atwww.caces.us. These models employed regulatory monitoring and land-use data, and pollution estimates were calculated starting with the first year for which nationwide monitoring data were available for that pollutant (1979 for SO2, NO2,
and O3; 1988 for PM10; 1990 for CO; and 1999 for
PM2.5). In the case of O3, annual values are the mean for
May through September of the daily maximum eight-hour moving average. O3 monitoring is not widely and
routinely conducted from October through April since these months typically experience very low O3
exposures prior to 1999 were estimated by multiplying a census tract’s PM10 value with the census tract’s mean
PM2.5:PM10 ratio from 1999 to 2003, as explained
else-where [25]. Values for PM2.5–10were calculated by
sub-tracting PM2.5from PM10.
In addition, spatially-decomposed PM2.5 data were
gen-erated following an approach described elsewhere [26]. Briefly, a census block’s total ambient PM2.5 was
decom-posed into four components, depending on the spatial variance in PM2.5surrounding the census block.
Estimat-ing spatial decompositions involved findEstimat-ing and subtract-ing the minimum PM2.5 values within circular buffers
around each census block. First, the minimum PM2.5 for
census block centroids within a 100 km radius of a given census block centroid was found, and this minimum was designated as regional (> 100 km) PM2.5. After subtracting
regional PM2.5, the minimum PM2.5within a 10 km radius
of the census block centroid was found, and this value was designated as mid-range (10–100 km) PM2.5. Next, the
minimum value within 1 km of the block centroid was similarly used to calculate neighborhood (1–10 km) PM2.5
by subtracting regional and mid-range PM2.5. Finally, the
residual PM2.5 that remained after subtracting regional,
mid-range, and neighborhood PM2.5was called local (< 1
km) PM2.5. The process was repeated for each year-2010
Census block and for each year from 2000 through 2015. Values for census tracts were calculated using population-weighted averages of year-2010 Census blocks.
Statistical analyses
Statistical analyses were performed at the NCHS Re-search Data Center in Hyattsville, MD, using SAS
(ver-sion 9.3; SAS Institute). Survival analyses were
performed for all-cause and cardiopulmonary mortality, with cardiopulmonary mortality defined as mortality due to cardiovascular disease (ICD-10 codes: I00-I09, I11, I13, I20-I51), cerebrovascular disease (I60-I69), chronic lower respiratory disease (J40-J47), and influenza or pneumonia (J09-J18). Mortality hazard ratios (HRs) and 95% confidence intervals (CIs) were estimated using two versions of the Cox proportional hazards (PH) model. The first PH model, referred to as the basic PH model, controlled for age, sex, and race-ethnicity by allowing each combination of age (in one-year increments), sex, and race-ethnicity (Hispanic, Hispanic black, non-Hispanic white, other or unknown) its own baseline haz-ard function using the STRATA statement of the PHREG procedure in SAS. The second PH model, re-ferred to as the complex PH model, controlled for age
group (18–24 years and subsequent five-year age
groups), sex, and race-ethnicity by including an indicator variable for each interaction of age group, sex, and race-ethnicity. The complex PH model was estimated using the SURVEYPHREG procedure in SAS, adjusting for the
NHIS complex survey design, using reported survey stratum, primary sampling unit, and sample weight from mortality follow-up files [28].
Both PH models controlled for covariates by including indicator variables for each value of marital status (never
married, married, separated, divorced, widowed),
inflation-adjusted household income ($0–35,000; $35, 000-50,000; $50,000-75,000; >$75,000), education (<high school graduate, high school graduate, some college, col-lege graduate, >college graduate), smoking status (current, former, never), BMI (< 20, 20–25, 25–30, 30– 35, > 35), U.S. Census region, urban versus rural desig-nation, and survey year. Survival time was the number of days between survey and death. For all-cause mortality, censored survival time was the number of days between survey and mortality follow-up (31 Dec 2015). In models that considered cardiopulmonary mortality, censored survival time was the number of days between survey and mortality follow-up, or the number of days between survey and non-cardiopulmonary mortality. Pollution values were included as continuous variables in the regressions.
In models using criteria pollutants (PM2.5, PM2.5–10,
SO2, NO2, O3, and CO), regressions included one, two,
or six pollutants, and were estimated for both all-cause and cardiopulmonary mortality. One- and two-pollutant regression models used the basic PH model. For six-pollutant regression models, both the basic and complex PH models were employed to examine whether results were sensitive to adjusting for the NHIS complex survey design. Basic PH models were also used to estimate the associations between spatial decompositions of PM2.5
and risk of all-cause and cardiopulmonary mortality. Re-gressions were performed for each of the four decompo-sitions individually and for models that included all four decompositions.
constructed for each year from 1993 to 2015. The con-struction of these yearly cohorts is illustrated in Additional file1: Figure S1.
Complex PH regressions were performed for all-cause and cardiopulmonary mortality for each of the 24 temporally-decomposed cohorts. In each cohort, individ-uals were assigned a two-year (cohort year and previous year) and five-year (cohort year and four previous years) average of ambient PM2.5using their census tract of
resi-dence at time of survey. In addition, age was adjusted to age in cohort year. Other covariates were not updated between cohorts. Meta-analytic fixed-effect estimates of the HR associated with a 10μg/m3increase in mean am-bient PM2.5 were calculated for all-cause and
cardiopul-monary mortality using estimates generated by the 24 yearly cohorts (Comprehensive Meta Analysis Ver. 3 Biostat Englewood, NJ).
Results
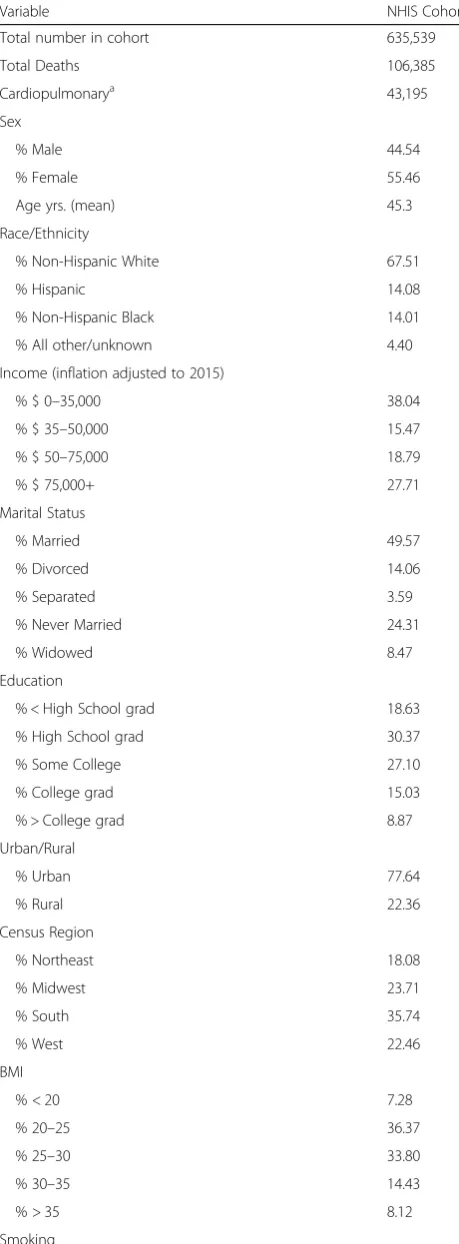
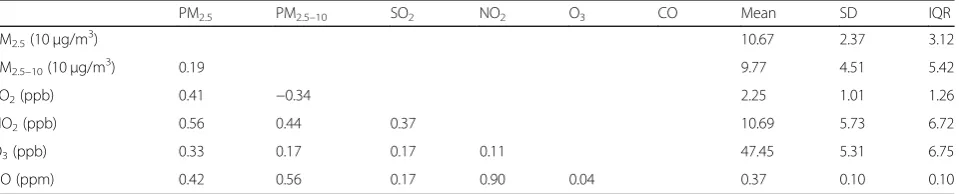
Table 1 presents summary statistics for the NHIS co-hort. Table 2 provides summary statistics (mean, stand-ard deviation, and interquartile range [IQR]) for the 17-year (1999–2015) averages of the six criteria pollutants (PM2.5, PM2.5–10, SO2, NO2, O3, and CO) and
correl-ation coefficients between pollutants, within the NHIS cohort. Criteria pollutants were generally positively cor-related, with the exception of PM2.5–10 and SO2 (see
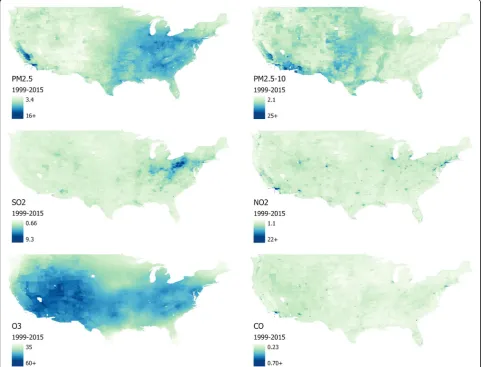
Table2). Figure1 presents heat maps for the six criteria pollutants across census tracts in the contiguous U.S.
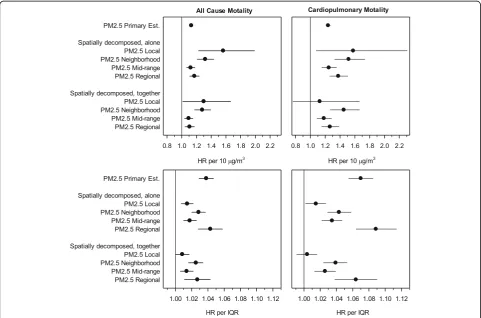
Figure2illustrates the HRs (and 95% CIs) estimated in regression models with the six criteria pollutants, using one-, two-, and six-pollutant models. HRs and CIs in Fig.2are presented relative to each pollutant’s IQR. Ex-posure to PM2.5 was consistently associated with
in-creased risk of all-cause and cardiopulmonary mortality, and the PM2.5-mortality associations were statistically
significant and insensitive to controlling for other pollut-ants. Exposures to PM2.5–10 and SO2 were also
associ-ated with increased mortality risk, including in six-pollutant models, but the associations were less robust. NO2, O3, and CO were not consistently linked with
ex-cess mortality risk. In models that controlled for PM2.5,
exposures to NO2were associated with reduced
mortal-ity risk. Furthermore, O3was not associated with excess
risk of all-cause mortality in six-pollutant models, and O3-mortality associations were marginally significant in
six-pollutant cardiopulmonary regression models. Esti-mated HRs were not sensitive to using the complex PH regression model.
Because the IQR of PM2.5–10(5.42μg/m3) is larger than
the IQR of PM2.5 (3.12μg/m3), the pollution-mortality
HRs associated with these two pollutants appear more similar in Fig. 2 than when scaled by 10μg/m3. In the two-pollutant basic PH model with PM2.5 and PM2.5–10,
Table 1Baseline unweighted characteristics of the NHIS cohort
Variable NHIS Cohort
Total number in cohort 635,539
Total Deaths 106,385
Cardiopulmonarya 43,195
Sex
% Male 44.54
% Female 55.46
Age yrs. (mean) 45.3
Race/Ethnicity
% Non-Hispanic White 67.51
% Hispanic 14.08
% Non-Hispanic Black 14.01
% All other/unknown 4.40
Income (inflation adjusted to 2015)
% $ 0–35,000 38.04
% $ 35–50,000 15.47
% $ 50–75,000 18.79
% $ 75,000+ 27.71
Marital Status
% Married 49.57
% Divorced 14.06
% Separated 3.59
% Never Married 24.31
% Widowed 8.47
Education
% < High School grad 18.63
% High School grad 30.37
% Some College 27.10
% College grad 15.03
% > College grad 8.87
Urban/Rural
% Urban 77.64
% Rural 22.36
Census Region
% Northeast 18.08
% Midwest 23.71
% South 35.74
% West 22.46
BMI
% < 20 7.28
% 20–25 36.37
% 25–30 33.80
% 30–35 14.43
% > 35 8.12
the all-cause mortality HR associated with a 10μg/m3 in-crease in PM2.5 is 1.12 (95% CI: 1.09, 1.15), whereas the
HR associated with a 10μg/m3increase in PM2.5–10is 1.02
(1.00, 1.04). Thus, when considered per 10μg/m3, expos-ure to PM2.5is associated with about six times greater
ex-cess risk than PM2.5–10.
Table 3 provides summary statistics and correlations for 16-year (2000–2015) averages of spatial decomposi-tions of PM2.5(local PM2.5, < 1 km; neighborhood PM2.5,
1–10 km; mid-range PM2.5, 10–100 km; regional PM2.5,
> 100 km), within the NHIS cohort. Although local, neighborhood, and mid-range PM2.5 are somewhat
cor-related, regional PM2.5 is mostly uncorrelated with local
PM2.5 and negatively correlated with neighborhood and
mid-range PM2.5(see Table3). Table 3 reports large
dif-ferences in the means and IQRs of the spatial decompo-sitions of PM2.5.
Fig.3 presents estimated HRs for all-cause and cardio-pulmonary mortality from models including spatially-decomposed PM2.5. In the top panel, HRs are presented
per 10μg/m3to assess the toxicity of spatial components of particulate matter. The same results are also pre-sented as scaled by IQR (bottom panel) to account for differences in exposure variability across spatial decom-positions of PM2.5. Regression results from models that
included individual spatial decompositions were compar-able to results from models that included all four spatial decompositions. Both types of model provide some
evidence that local PM2.5 and neighborhood PM2.5 may
be more toxic than mid-range and regional PM2.5.
Fig.4presents results from the temporally-decomposed analysis. HRs for all-cause and cardiopulmonary mortality associated with a 10μg/m3 increase in two-year mean PM2.5are presented from regressions performed on the 24
temporally-decomposed cohorts. These PM2.5-mortality
associations were consistent across follow-up years. Al-though PM2.5-mortality associations were generally not
statistically significant for individual cohort years, meta-analytic estimates of pooled results were statistically sig-nificant. HRs from fixed-effect meta-analyses of HRs from the 24 cohorts are also presented for two- and five-year mean PM2.5and for all-cause and cardiopulmonary
mor-tality. HRs associated with two-year and five-year mean PM2.5were nearly identical. Also presented are HRs from
time-independent analyses which used the entire NHIS cohort and 17-year (1999–2015) or 28-year (1988–2015) mean PM2.5. HRs from meta-analyses of
temporally-decomposed regressions were greater than HRs associated with 28-year mean PM2.5 but less than HRs associated
with 17-year mean PM2.5.
Discussion
This study advances our understanding of mortality risk associated with long-term exposure to PM2.5 in several
ways. First, it illustrates that the PM2.5-mortality
associ-ation within a large cohort is not highly sensitive to controlling for other air pollutants. Second, results from multiple-pollutant models report that, while mortality
risk associated with PM2.5 exposure was the most
prominent and robust result, exposures to elevated levels of SO2and PM2.5–10were also consistently linked to
ex-cess mortality risk. Third, regressions using spatially-decomposed PM2.5 suggest that more spatially variable
components (< 10 km) of PM2.5 exposures may be more
toxic. Fourth, mortality risk was significantly associated with all spatial decompositions of PM2.5, indicating that
the PM2.5-mortality association within the U.S. is likely
not the result of exclusively regional or local
Table 1Baseline unweighted characteristics of the NHIS cohort
(Continued)
Variable NHIS Cohort
% Never 53.76
% Current 23.90
% Former 22.34
a
Cardiopulmonary mortality is based on International Statistical Classification of Diseases, Injuries, and Causes of Death, Tenth Revision (ICD-10) and includes: cardiovascular disease (I00-I09, I11, I13, I20-I51), cerebrovascular disease (I60-I69), chronic lower respiratory disease (J40-J47), and influenza and pneumonia (J09-J18)
Table 2Correlations (Pearson’s r) and summary statistics of criteria pollutants (1999–2015) in the NHIS cohort
PM2.5 PM2.5–10 SO2 NO2 O3 CO Mean SD IQR
PM2.5(10μg/m3) 10.67 2.37 3.12
PM2.5–10(10μg/m3) 0.19 9.77 4.51 5.42
SO2(ppb) 0.41 −0.34 2.25 1.01 1.26
NO2(ppb) 0.56 0.44 0.37 10.69 5.73 6.72
O3(ppb) 0.33 0.17 0.17 0.11 47.45 5.31 6.75
CO (ppm) 0.42 0.56 0.17 0.90 0.04 0.37 0.10 0.10
Note: PM2.5, fine particulate matter (particles < 2.5μm in aerodynamic diameter); PM2.5–10, coarse fraction particulate matter (particles 2.5–10μm in aerodynamic
diameter); SO2, sulfur dioxide; NO2, nitrogen dioxide; O3, ozone, mean for May–September of daily max of eight-hour moving average; CO, carbon monoxide; SD,
confounders. And fifth, the temporally-decomposed ana-lysis indicates that PM2.5-mortality associations were
largely consistent over time within the NHIS cohort, but provides incomplete evidence regarding the most rele-vant window of pollution exposure.
The robustness of the PM2.5-mortality association has
been reported by various studies, including studies using two- or three-pollutant models [4,5,13,20]. Our results regarding risks associated with other air pollutants, how-ever, were less congruent with existing literature. For ex-ample, this study found a relatively stable association between PM2.5–10 and mortality, which contrasts with
the lack of consistent associations in similar cohort stud-ies [31]. Similarly, previous studies examining the effect
of long-term O3 exposures reported results that
remained significant when controlling for PM2.5 and
NO2[4, 13, 20], while this study found that the
associ-ation was stable except in six-pollutant models. The
mortality association with NO2 was extremely sensitive
to the inclusion of other pollutants, especially PM2.5.
Ul-timately, the clearest signals emerging from multiple-pollutant regressions were that the PM2.5-mortality
asso-ciation was the most robust among these pollutants and that the mortality associations of other pollutants re-quire further investigation.
The spatially-decomposed analyses are interesting because they provide insight into different compo-nents of PM2.5. PM2.5 is largely comprised of regional
and mid-range components which are presumably dominated by secondary material (sulfates, nitrates, and secondary organic aerosol). The neighborhood and local components contribute a relatively small fraction of the PM2.5 mass (6 and 17% respectively)
but are presumably more influenced by local emissions and therefore comprised of combustion emissions (black carbon and primary organic aerosol) and other Fig. 1Average concentrations of criteria pollutants by 2010 Census tracts in the continental U.S., 1999–2015. PM2.5, fine particulate matter (particles < 2.5μm in aerodynamic diameter) inμg/m3; PM2.5–10, coarse fraction particulate matter (particles 2.5–10μm in aerodynamic diameter)
local sources (industrial and road dust). As illustrated in Fig. 3, these results provide some evidence that
local PM2.5 and neighborhood PM2.5 may be more
strongly associated with mortality risk than regional PM2.5. Near-source PM2.5 was also more strongly
as-sociated with mortality risk than regional PM2.5in
an-other large U.S. cohort [32]. An implication of these results is that reliance on PM2.5-mortaltiy associations
that are driven largely by regional differences in
pollution may underestimate the health effects of ex-posure to local sources of pollution.
Strengths of the NHIS cohort have been described previ-ously [25], which include the availability of detailed docu-mentation, precise geographic information, large sample size, representativeness of U.S. adults, and individual-level controls for age, race-ethnicity, sex, smoking status, educa-tion, BMI, marital status, and income. Other strengths of this study include a) the robustness of the PM2.5-mortality
association in multiple-pollutant models that included mod-eled air pollution estimates for six criteria pollutants.b) The ability to examine the stability of other pollutant-mortality associations in multiple-pollutant models. c) The use of spatially-decomposed PM2.5data to investigate whether the
toxicity of PM2.5 depended on proximity to source. d)
Temporally-decomposed analyses which allowed exposures and mortality effects to vary between years and facilitated comparisons of different windows of exposure.
This study also has important limitations. Like all obser-vational studies, it was hindered by a lack of random
exposure assignment, meaning it was susceptible to con-founders that were unobserved or inadequately controlled for. Another limitation was the lack of follow-up for most individual-level data, including residential census tract, smoking status, marital status, and income. In multiple-pollutant analyses, correlations among multiple-pollutants limit the ability to estimate independent associations between mortality risk and specific pollutants. For example, the cor-relation between PM2.5and NO2likely contributed to
in-stability in the estimated effect of NO2 exposures; in
models that controlled for PM2.5, NO2 was linked with
Fig. 3Illustration of spatially-decomposed analyses, presented per 10μg/m3(top panel) and per IQR (bottom panel). Hazard ratios (and 95% CIs) were estimated using the basic proportional hazards regressions model which adjusted for age, sex, race-ethnicity, marital status, inflation-adjusted household income, education, smoking status, BMI, U.S. Census region, urban versus rural designation, and survey year. Local PM2.5, PM2.5generated within 1 km of residence; neighborhood PM2.5, PM2.5generated 1–10 km from residence; mid-range PM2.5, PM2.5generated 10– 100 km from residence; regional PM2.5, PM2.5generated over 100 km from residence; IQR, interquartile range. Data used to generate plot are listed in Additional file1Table S2.
Table 3Correlations (Pearson’s r) and summary statistics for spatial decompositions of PM2.5(2000–2015) in the NHIS cohort
Local (< 1 km)
Neighborhood (1–10 km)
Mid-range (10–100 km)
Regional (> 100 km) Mean SD IQR
Local PM2.5 0.63 0.28 0.32
Neighborhood PM2.5 0.25 1.81 0.87 1.01
Mid-range PM2.5 0.17 0.29 2.59 1.45 1.53
Regional PM2.5 0.01 −0.33 −0.21 5.47 1.90 2.65
Note: Local PM2.5, PM2.5generated within 1 km of residence; neighborhood PM2.5, PM2.5generated 1–10 km from residence; mid-range PM2.5, PM2.5generated 10–
decreased mortality risk. Similarly, in the temporally-decomposed analyses, the correlation of PM2.5 exposures
over time made it difficult to determine the most relevant exposure window. In addition, the lack of variation in PM2.5-mortality associations between years may reflect a
lack of independence between yearly cohorts, in which case the standard errors from fixed-effect meta-analytic esti-mates may be underestimated.
Conclusions
Associations between long-term exposure to PM2.5 air
pollution and mortality risk were robust to controlling for co-pollutants, observed across different spatial de-compositions of PM2.5, and consistent over temporal
de-compositions of PM2.5. There was some evidence of
increased toxicity for PM2.5 exposures that occurred
closer to pollution sources. Exposures to SO2 and
PM2.5–10 were also linked to mortality risk, even when
controlling for other air pollutants.
Additional file
Additional file 1: Table S1.Hazard ratios (and 95% CIs) from regressions using 6 criteria pollutants, scaled by IQR.Table S2.Hazard ratios (and 95% CIs) from spatially-decomposed analyses of PM2.5.Table S3.Hazard ratios (and 95% CIs) from temporally-decomposed PM2.5and related analyses.Figure S1.Illustration of the construction of temporally decomposed cohorts
Acknowledgements
Not applicable.
Availability of data
Air pollution data are available atwww.caces.us/data. Public-use National Health Interview Survey data can be accessed atwww.cdc.gov/nchs/ nhis/data-questonnaires-documentation.htm. For access to restricted-use geographic files, it is required to submit a proposal to the Research Data
Center of the National Center of Health Statistics. Details are available at
www.cdc.gov/rdc.
Authors’contributions
Conceptualization: CAP, RTB, ME, ALR, JDM; Data curation: JSL, JDH, JDM, MB, YW, ALR; Formal analysis: JSL, JDH, NCC, DDM, CAP; Methodology: JSL, RTB, ME, JDM, CAP; Supervision: CAP, ALR; Writing—original draft: JSL, CAP; Writing—review & editing: All authors have read and approved the final manuscript.
Authors’information
Not applicable.
Funding
This publication was developed as part of the Center for Air, Climate, and Energy Solutions (CACES), which was supported under Assistance Agreement No. R835873 awarded by the U.S. Environmental Protection Agency. It has not been formally reviewed by EPA. The views expressed in this document are solely those of authors and do not necessarily reflect those of the Agency. EPA does not endorse any products or commercial services mentioned in this publication.
Ethics approval and consent to participate
Not applicable. The research reported in this manuscript uses public data that are de-identified and not subject to federal regulations on protection of human research subjects.
Consent for publication
Not applicable.
Competing interests
The authors declare they have no actual or potential competing financial interests.
Author details
1Department of Agricultural and Resource Economics, University of California,
Berkeley, CA 94720, USA.2Department of Economics, University of Chicago, Chicago, IL, USA.3Health Canada, Ottawa, Ontario, Canada.4MRC Centre for
Environment and Health, School of Public Health, Imperial College London, London, UK.5Department of Economics, Brigham Young University, Provo,
UT, USA.6Department of Civil and Environmental Engineering, University of Washington, Seattle, WA, USA.7Engineering and Public Policy, Carnegie
Mellon University, Pittsburgh, PA, USA.
Received: 26 August 2019 Accepted: 7 November 2019
References
1. Dockery DW, Pope CA, Xu X, Spengler JD, Ware JH, Fay ME, Ferris BG Jr, Speizer FE. An association between air pollution and mortality in six US cities. N Engl J Med. 1993;329(24):1753–9.
2. Pope CA III, Burnett RT, Thun MJ, Calle EE, Krewski D, Ito K, Thurston GD. Lung cancer, cardiopulmonary mortality, and long-term exposure to fine particulate air pollution. JAMA. 2002;287(9):1132–41.
3. Miller KA, Siscovick DS, Sheppard L, Shepherd K, Sullivan JH, Anderson GL, Kaufman JD. Long-term exposure to air pollution and incidence of cardiovascular events in women. N Engl J Med. 2007 Feb 1;356(5):447–58. 4. Jerrett M, Burnett RT, Pope CA III, Ito K, Thurston G, Krewski D, Shi Y, Calle E,
Thun M. Long-term ozone exposure and mortality. N Engl J Med. 2009; 360(11):1085–95.
5. Krewski D, Jerrett M, Burnett RT, Ma R, Hughes E, Shi Y, Turner MC, Pope CA III, Thurston G, Calle EE, Thun MJ. Extended follow-up and spatial analysis of the American Cancer Society study linking particulate air pollution and mortality. Health Effects Institute: Boston, MA; 2009.
6. Lipsett MJ, Ostro BD, Reynolds P, Goldberg D, Hertz A, Jerrett M, Smith DF, Garcia C, Chang ET, Bernstein L. Long-term exposure to air pollution and cardiorespiratory disease in the California teachers study cohort. Am J Respir Crit Care Med. 2011;184(7):828–35.
7. Puett RC, Hart JE, Suh H, Mittleman M, Laden F. Particulate matter exposures, mortality, and cardiovascular disease in the health professionals follow-up study. Environ Health Perspect. 2011;119(8):1130–5.
8. Lepeule J, Laden F, Dockery D, Schwartz J. Chronic exposure to fine particles and mortality: an extended follow-up of the Harvard six cities study from 1974 to 2009. Environ Health Perspect. 2012;120(7):965–70. 9. Carey IM, Atkinson RW, Kent AJ, Van Staa T, Cook DG, Anderson HR.
Mortality associations with long-term exposure to outdoor air pollution in a national English cohort. Am J Respir Crit Care Med. 2013;187(11):1226–33. 10. Cesaroni G, Badaloni C, Gariazzo C, Stafoggia M, Sozzi R, Davoli M, Forastiere F.
Long-term exposure to urban air pollution and mortality in a cohort of more than a million adults in Rome. Environ Health Perspect. 2013;121(3):324–31. 11. Beelen R, Raaschou-Nielsen O, Stafoggia M, Andersen ZJ, Weinmayr G,
Hoffmann B, Wolf K, Samoli E, Fischer P, Nieuwenhuijsen M, Vineis P. Effects of long-term exposure to air pollution on natural-cause mortality: an analysis of 22 European cohorts within the multicentre ESCAPE project. Lancet. 2014;383(9919):785–95.
12. Bentayeb M, Wagner V, Stempfelet M, Zins M, Goldberg M, Pascal M, Larrieu S, Beaudeau P, Cassadou S, Eilstein D, Filleul L. Association between long-term exposure to air pollution and mortality in France: a 25-year follow-up study. Environ Int. 2015;85:5–14.
13. Crouse DL, Peters PA, Hystad P, Brook JR, van Donkelaar A, Martin RV, Villeneuve PJ, Jerrett M, Goldberg MS, Pope CA III, Brauer M. Ambient PM2.5, O3, and NO2exposures and associations with mortality over 16 years of follow-up in the Canadian census health and environment cohort (CanCHEC). Environ Health Perspect. 2015;123(11):1180–6. 14. Fischer PH, Marra M, Ameling CB, Hoek G, Beelen R, de Hoogh K,
Breugelmans O, Kruize H, Janssen NA, Houthuijs D. Air pollution and mortality in seven million adults: the Dutch environmental longitudinal study (DUELS). Environ Health Perspect. 2015;123(7):697–704.
15. Hart JE, Liao X, Hong B, Puett RC, Yanosky JD, Suh H, Kioumourtzoglou MA, Spiegelman D, Laden F. The association of long-term exposure to PM2.5on all-cause mortality in the Nurses’Health Study and the impact of measurement-error correction. Environ Health. 2015;14(1):38. 16. Thurston GD, Ahn J, Cromar KR, Shao Y, Reynolds HR, Jerrett M, Lim CC,
Shanley R, Park Y, Hayes RB. Ambient particulate matter air pollution exposure and mortality in the NIH-AARP diet and health cohort. Environ Health Perspect. 2015;124(4):484–90.
17. Tseng E, Ho WC, Lin MH, Cheng TJ, Chen PC, Lin HH. Chronic exposure to particulate matter and risk of cardiovascular mortality: cohort study from Taiwan. BMC Public Health. 2015;15(1):936.
18. Villeneuve PJ, Weichenthal SA, Crouse D, Miller AB, To T, Martin RV, van Donkelaar A, Wall C, Burnett RT. Long-term exposure to fine particulate matter air pollution and mortality among Canadian women. Epidemiology. 2015;26(4):536–45.
19. Pinault L, Tjepkema M, Crouse DL, Weichenthal S, van Donkelaar A, Martin RV, Brauer M, Chen H, Burnett RT. Risk estimates of mortality attributed to low concentrations of ambient fine particulate matter in the Canadian community health survey cohort. Environ Health. 2016;15(1):18. 20. Di Q, Wang Y, Zanobetti A, Wang Y, Koutrakis P, Choirat C, Dominici F,
Schwartz JD. Air pollution and mortality in the Medicare population. N Engl J Med. 2017;376(26):2513–22.
21. Pinault LL, Weichenthal S, Crouse DL, Brauer M, Erickson A, van Donkelaar A, Martin RV, Hystad P, Chen H, Finès P, Brook JR. Associations between fine particulate matter and mortality in the 2001 Canadian census health and environment cohort. Environ Res. 2017;159:406–15.
22. Yin P, Brauer M, Cohen A, Burnett RT, Liu J, Liu Y, Liang R, Wang W, Qi J, Wang L, Zhou M. Long-term fine particulate matter exposure and nonaccidental and cause-specific mortality in a large national cohort of Chinese men. Environ Health Perspect. 2017;125(11):117002. 23. Parker JD, Kravets N, Vaidyanathan A. Particulate matter air pollution
exposure and heart disease mortality risks by race and ethnicity in the United States: 1997 to 2009 national health interview survey with mortality follow-up through 2011. Circulation. 2018;137(16):1688–97.
24. Vodonos A, Awad YA, Schwartz J. The concentration-response between long-term PM2. 5 exposure and mortality; a meta-regression approach. Environ Res. 2018;166:677–89.
25. Pope CA III, Lefler JS, Ezzati M, Higbee JD, Marshall JD, Kim S-Y, Bechle M, Gilliat KS, Vernon SE, Robinson AL, Burnett RT. Mortality Risk and Fine Particulate Air Pollution in a Large, Representative Cohort of U.S. Adults. Environ Health Perspect. 2019.https://doi.org/10.1289/EHP4438.
27. Bell ML, Dominici F, Ebisu K, Zeger SL, Samet JM. Spatial and temporal variation in PM2. 5 chemical composition in the United States for health effects studies. Environ Health Perspect. 2007;115(7):989–95.
28. National Center for Health Statistics. 2014 National Health Interview Survey: Survey Description. NCHS, Division of Health Interview Statistics.ftp://ftp. cdc.gov/pub/Health_Statistics/NCHS/Dataset_Documentation/NHIS/2014/ srvydesc.pdf(2015). Accessed 3 July 2019.
29. National Center for Health Statistics (NCHS). NCHS data linked to NDI mortality files.https://www.cdc.gov/nchs/data-linkage/mortality.htm(2019). Accessed 3 July 2019.
30. Kim S-Y, Bechle M, Hankey S, Sheppard EA, Szpiro AA, Marshall JD. Concentrations of criteria pollutants in the contiguous U.S., 1979–2015: Role of model parsimony in integrated empirical geographic regression. UW Biostatistics Working Paper Series.Working Paper 425.https://biostats. bepress.com/uwbiostat/paper425.
31. Adar SD, Filigrana PA, Clements N, Peel JL. Ambient coarse particulate matter and human health: a systematic review and meta-analysis. Curr Environ Health Rep. 2014;1(3):258–74.
32. Turner MC, Jerrett M, Pope CA III, Krewski D, Gapstur SM, Diver WR, Beckerman BS, Marshall JD, Su J, Crouse DL, Burnett RT. Long-term ozone exposure and mortality in a large prospective study. Am J Respir Crit Care Med. 2016;192(10):1134–42.
Publisher’s Note