DEMOGRAPHIC RESEARCH
A peer-reviewed, open-access journal of population sciences
DEMOGRAPHIC RESEARCH
VOLUME 37, ARTICLE 48, PAGES 1549–1610
PUBLISHED 23 NOVEMBER 2017
http://www.demographic-research.org/Volumes/Vol37/48/ DOI: 10.4054/DemRes.2017.37.48
Research Article
Bayesian projection of life expectancy
accounting for the HIV/AIDS epidemic
Jessica Godwin
Adrian E. Raftery
c
2017 Jessica Godwin & Adrian E. Raftery.
This open-access work is published under the terms of the Creative Commons Attribution 3.0 Germany (CC BY 3.0 DE), which permits use, reproduction, and distribution in any medium, provided the original author(s) and source are given credit.
1 Introduction 1550
2 Methodology 1552
2.1 Data 1552
2.2 Review of joint probabilistic projections of male and female life expectancy 1552 2.3 Probabilistic projections of life expectancy accounting for HIV prevalence 1554
2.4 Model validation 1556
3 Case studies 1560
3.1 Medium epidemic: Nigeria 1560
3.2 Medium epidemic: Kenya 1561
3.3 Widespread epidemic: South Africa 1561
3.4 Widespread epidemic: Botswana 1563
3.5 No epidemic: Germany 1563
4 Discussion 1564
5 Acknowledgments 1565
References 1566
Appendix A: Female life expectancy and adult HIV prevalence projections 1569
Bayesian projection of life expectancy accounting for the HIV/AIDS
epidemic
Jessica Godwin1
Adrian E. Raftery2
Abstract
BACKGROUND
While probabilistic projection methods for projecting life expectancy exist, few account for covariates related to life expectancy. Generalized HIV/AIDS epidemics have a large, immediate negative impact on the life expectancy in a country, but this impact can be mitigated by widespread use of antiretroviral therapy (ART). Thus, projection methods for countries with generalized HIV/AIDS epidemics could be improved by accounting for HIV prevalence, the future course of the epidemic, and ART coverage.
METHODS
We extend the current Bayesian probabilistic life expectancy projection methods of Raftery et al. (2013) to account for HIV prevalence and adult ART coverage in countries with generalized HIV/AIDS epidemics.
RESULTS
We evaluate our method using out-of-sample validation. We find that the proposed method performs better than the method that does not account for HIV prevalence or ART cov-erage for projections of life expectancy in countries with a generalized epidemic, while projections for countries without an epidemic remain essentially unchanged.
CONCLUSIONS
In general, our projections show rapid recovery to pre-epidemic life expectancy levels in the presence of widespread ART coverage. After the initial life expectancy recovery, we project a steady rise in life expectancy until the end of the century.
CONTRIBUTION
We develop a simple Bayesian hierarchical model for long-term projections of life ex-pectancy while accounting for HIV/AIDS prevalence and coverage of ART. The method
produces well-calibrated projections for countries with generalized HIV/AIDS epidemics up to 2100 while having limited data demands.
1. Introduction
Probabilistic projections of mortality measures are important for many applications, in-cluding population projection and pension and healthcare planning. Until recently, most projections of mortality measures were deterministic, although the United Nations (UN) has recently started to base its official projections of mortality on probabilistic methods. Most projections, deterministic or probabilistic, do not incorporate cause-of-death infor-mation or other covariates.
Lee and Carter (1992) developed a method for projecting a mortality measure prob-abilistically. The Lee–Carter method projects age-specific mortality rates and is widely used today. It requires at least three time periods of age-specific death rates, an amount of data that is not available in many countries. The method assumes that the logarithm of the age-specific death rates will increase linearly in the future, which may not be optimal for long-term projections (Lee and Miller 2001). Alho and Spencer (1985) developed a method for incorporating uncertainty in population forecasting, addressing fertility, mor-tality and migration separately. However, the authors state this method is designed to be used for shortterm projections. Girosi and King (2008) proposed a Bayesian method for smoothing age-specific death rates over both age and time. Even though this method allows for the incorporation of covariates, it has been shown to perform well only for countries with good vital registration data. Like the Lee–Carter method, the Girosi and King (2008) method assumes a constant rate of increase. Lutz, Sanderson, and Scher-bov (1998) developed an expert-based method for probabilistic projections of population that incorporates subjective probabilistic projections for several demographic measures, including life expectancy.
dif-ferent from that of other diseases, which tend primarily to affect mortality rates for very young and/or older ages.
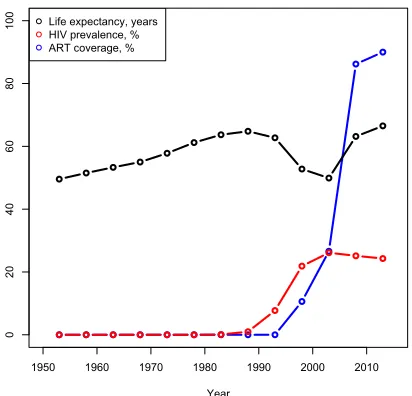
Figure 1 shows the rise of the HIV epidemic and the corresponding evolution of life expectancy at birth in Botswana. There was a sharp lowering of life expectancy with the rise of the epidemic and then a rapid recovery to pre-epidemic levels following the widespread introduction of ART.
Figure 1: Life expectancy at birth (black), HIV prevalence (red) and ART coverage (blue) for Botswana from 1950–1955 to 2005–2015
1950 1960 1970 1980 1990 2000 2010
0
20
40
60
80
100
Year
Life expectancy, years
HIV prevalence, % ART coverage, %
To incorporate covariate information into a probabilistic projection model, we must also have a method for projecting the covariate of interest into the future. UNAIDS de-veloped the Spectrum/EPP methodology for projecting HIV prevalence and demographic measures, including life expectancy at birth, while accounting for HIV prevalence and ART coverage, among other things (Stover, Brown, and Marston 2012; Stanecki, Garnett, and Ghys 2012; Futures Institute 2014). The method is quite complicated and requires fine-grained data on a number of demographic and health measures for each country. It is recommended for reconstructing the HIV epidemic, including the time of onset, in a particular country and for projecting the epidemic up to five years into the future. It is not designed for long-term HIV prevalence projections, which in turn are important for long-term population projections (UNAIDS 2014: 9).
written inR(Brown et al. 2010). We develop a model for projecting life expectancy at birth while accounting for HIV prevalence and ART coverage that is simpler and more practical for long-term projections than Bayesian probabilistic methods.
2. Methodology
2.1 Data
We use estimates of past and present female life expectancy at birth from the United Nations World Population Prospects(WPP) 2015 Revision (United Nations 2015) for 201 countries. The UN produces estimates of past and present period life expectancy at birth and age-specific mortality rates by five-year periods and five-year age groups; these are updated every two years. There are estimates for each country of the world for each five-year period from 1950 to 2015. We do not use life expectancy inputs for Cambodia and Rwanda from the time periods of the genocides in these countries.
To fit the model, we use UNAIDS estimates of past HIV prevalence and ART cov-erage for 40 countries with generalized epidemics. We use 1,000 trajectories of HIV prevalence, using the same assumptions as Brown et al. (2010). Additionally, we use a single deterministic trajectory of ART coverage from UNAIDS in the projection stage. ART is relatively new in many generalized epidemic countries, with the first coverage estimates available for the time period 2000–2005. Data relating to coverage tends to be noisy. We code HIV prevalence as 0 for all countries not experiencing a generalized HIV epidemic.
2.2 Review of joint probabilistic projections of male and female life expectancy
Our methodology builds on the Bayesian hierarchical model for joint probabilistic pro-jection of female and male life expectancy used by the UN (Raftery et al. 2013; Raftery, Lalic, and Gerland 2014), which proceeds as follows: First, we estimate the Bayesian hi-erarchical model for female life expectancy using Markov chain Monte Carlo (MCMC), then we make probabilistic projections of female life expectancy from the present day to 2100. We then make projections of male expectancy based on the projected values of female life expectancy (Raftery, Lalic, and Gerland 2014). The model provides a way for projection for one country to be improved using information from other countries.
∆`c,t≡`c,t+1−`c,t = g(`c,t|θ(c)) +εc,t+1, (1)
εc,t ∼ N(0, (ωf(`c,t))2),
where`c,tis the female life expectancy at birth for countrycin time period t,g(·|θ(c)) is the expected five-year gain in life expectancy, modeled as a double logistic function of current life expectancy and governed by country-specific parameters,θ(c),εc,t+1is a
random perturbation around the expected gain, andf(`c,t)is a smooth function of life expectancy. The double logistic function for countrycis
g(`c,t|θ(c)) =
kc
1 + exp−A1
∆c
2
(`c,t−∆c1−A2∆c2)
+
zc−kc
1 + exp−A1
∆c
4
(`c,t−P
3
i=1∆
c
i −A2∆c4)
,
whereθ(c) = (∆c
1, ∆c1, ∆c1, ∆c1,kc,zc),A1,A2 are constants. The parameterzc is the
expected country-specific asymptotic five-year gain in life expectancy. The other param-eters govern the maximum value and the pace of rise and fall of expected five-year gains in life expectancy.
At the second level of the model, the country-specific parametersθ(c)are assumed
to be drawn from the following distributions:
∆ci|σ∆i iid
∼Normal[0,100](∆i,σ2∆i), i= 1,. . ., 4,
kc|σ k
iid
∼Normal[0,10](k,σk2)
zc|σz
iid
∼Normal[0,0.653](z,σz2).
The truncation of the normal distribution forzcis informed by observed gains in max-imum age at death among countries with the highest life expectancies (Wilmoth et al. 2000). At the third, top level of the model, hyperprior distributions are specified for the world parametersθ= (∆1, ∆2, ∆3, ∆4,k,z,ω). The hyperpriors are proper and diffuse.
See Raftery et al. (2013) for more details.
Once the model has been estimated, projections of life expectancy are made based on each posterior sample of θ(c) and a random perturbation, εc,t+1, drawn from a
N(0, (ωf(`c,t))2) distribution, where ω is drawn from the posterior distribution.
Af-ter female projections of life expectancy are made, projections of male life expectancy,
`m
c,t, are made by modeling the gap between the two (Raftery, Lalic, and Gerland 2014).
2.3 Probabilistic projections of life expectancy accounting for HIV prevalence
We expand the BHM to account for generalized HIV/AIDS epidemics by adding a co-variate to the observation level of the model. To define the coco-variate, let HIVc,t and
ARTc,tbe the HIV prevalence and ART coverage in percent of countrycat time period
t, respectively. Then the quantityHnAc,t=HIVc,t×(100−ARTc,t)can be viewed as approximating the percentage of the population who are infected but do not receive ART therapy. The covariate we found to best predict change in life expectancy was the change in this quantity, namely∆HnAc,t−1=HnAc,t−HnAc,t−1. Our expanded observation
equation is then
∆`c,t=g(`c,t|θ(c)) +βHnA∆HnAc,t−1+εc,t+1. (2)
The parameterβHnAis constant across countries and is estimated by MCMC along with the other parameters of the Bayesian hierarchical model. It has a diffuse prior dis-tribution, chosen to be proper (i.e., a valid probability distribution) but spread out enough that reasonable changes in it would have little impact on the final inference.
Specifi-cally, the prior distribution ofβHnAthat we use isN
0, 0.25× V ar(∆`c,t)
V ar(∆HnAc,t)
=
N(0, 0.832)(i.e., with standard deviation 0.83, or variance0.832= 0.69), where the prior
variance is determined by the sample variances of observed changes in life expectancy and observed changes inHnAc,t. The posterior distribution ofβHnAisN(−0.64, 0.172) and is estimated with the other parameters in the MCMC via Gibbs sampling updates.
After estimation, we project female life expectancy in the same manner as out-lined in Section 2.2. However, we make a projection based on each posterior sample of(θ(c),βHnA)and a random perturbation. We account for uncertainty in the HIV tra-jectories by using 1,000 yearly tratra-jectories of HIV projections from EPP (Brown et al. 2010). For each countrycand yeart, we find the median, zt,c, of projected adult HIV prevalence output from EPP. We use a single UNAIDS deterministic projection to 2100 as a baseline reference, and we construct 1,000 trajectories from the single UNAIDS
trajec-tory by using 1,000 multipliers of the form z k t,c
zt,c
, at each time pointtfork= 1,. . ., 1000,
wherezk
UNAIDS deterministic trajectory serves as the median trajectory of HIV prevalence to 2100, and the EPP trajectories determine the uncertainty. We construct five-year averages from the yearly trajectories to be used in the projection stage. From these, we use a single deterministic trajectory of ART coverage to compute 1,000 trajectories of∆HnAc,tfor all countries. We sample from the 1,000 trajectories of∆HnAc,twith equal probability to be used in the projection stage.
For the country of Liberia, the prevalence is projected to be so low in the future (close to 0) that the multipliers are unrealistically large. We therefore treated it slightly differently. For this country we calculatedzk
t,c −zt,c for each time point t. We then added this distance to the UNAIDS trajectory to yield 1,000 trajectories with the UNAIDS trajectory as the median and borrowed the uncertainty from the EPP trajectories.
The methods of Raftery et al. (2013) and Raftery, Lalic, and Gerland (2014) did not use the generalized HIV epidemic countries in their models. By contrast, our estimation of the BHM does include these countries. The covariate values are set to 0 for nonepi-demic countries. Thus, the estimation of country-specific parameters and the projection of life expectancy for nonepidemic countries change negligibly; we are effectively fitting the model in (1) for these countries. For epidemic countries, the model in (2) allows us to adjust for the effects of HIV on life expectancy in the linear term and to interpret
g(·|θ(c))as the expected five-year gain in life expectancy in the absence of the epidemic.
Even though high HIV prevalence takes a big toll on a country’s life expectancy at birth in the absence of ART, ART extends an infected person’s life substantially. Several epi-demiological case studies show that HIV-positive individuals have nearly normal life ex-pectancy when treated with ART (Mills et al. 2011; Johnson et al. 2013). In a country where ART coverage is high, a generalized HIV epidemic affects life expectancy like a chronic disease would (Deeks, Lewin, and Havlir 2013).
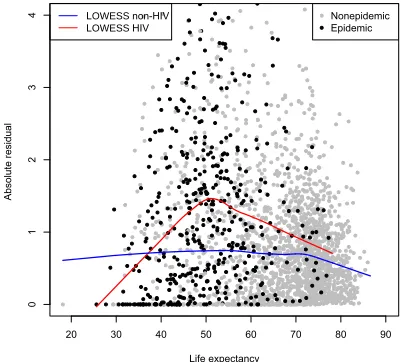
Similarly to Raftery et al. (2013), the distribution of the random perturbations in the projection stage isεc,t+1∼N(0, (ω×f(`c,t,i)2), whereωis a model parameter,f(`c,t,i) is a smooth function, andi is an indicator of generalized HIV epidemic. To estimate
f(`c,t,i), we fit the model in (2) using the same functionf(`c,t)as used by Raftery et al. (2013). Then, using mean posterior estimates ofg(`c,t|θ(c)), we projected life expectancy forward from 1950–1955 to the 2010–2015 period using only the mean model in (2) with no random perturbations. We then calculated absolute residuals for these projections. We fit LOWESS curves to the absolute residuals for nonepidemic countries and for epidemic countries separately. A LOWESS curve fits a smooth curve to points using weighted least squares in estimation.
the future for epidemic countries. For nonepidemic countries, f(`c,t,i=nonHIV)is the blue curve in Figure 2. For epidemic countriesf(`c,t,i=HIV)is the maximum of the blue and red curves up to the highest observed life expectancy for an HIV country to date, namely 78.1. For projected female life expectancies above 78.1 years, we use the blue curve plus a constant that is equal to the vertical difference between the red and blue curves at 78.1 years.
Figure 2: Estimating the variance in the model
20 30 40 50 60 70 80 90
0
1
2
3
4
Life expectancy
Absolute
r
esidual
Nonepidemic
Epidemic LOWESS non-HIV
LOWESSHIV
Note: The black dots represent absolute residuals for epidemic countries; the grey dots represent absolute residuals for nonepidemic countries. The blue line is the LOWESS fit to the nonepidemic residuals. The red line is the LOWESS fit to the epidemic residuals.
2.4 Model validation
We performed predictive out-of-sample validation to assess our model. First, we fit the model in (2) using data from 1950–1955 up to 2000–2005 and projected female life ex-pectancy for the time periods 2005–2010 and 2010–2015. We also fit the model in (2) using data from 1950–1955 up to 2005–2010 and projected female life expectancy for the time period 2010–2015.
coun-tries for more detail. The second and third columns reflect the period of data used to train and validate the model, respectively. The fourth column contains the number of countries for which the subsequent calibration metrics are calculated.
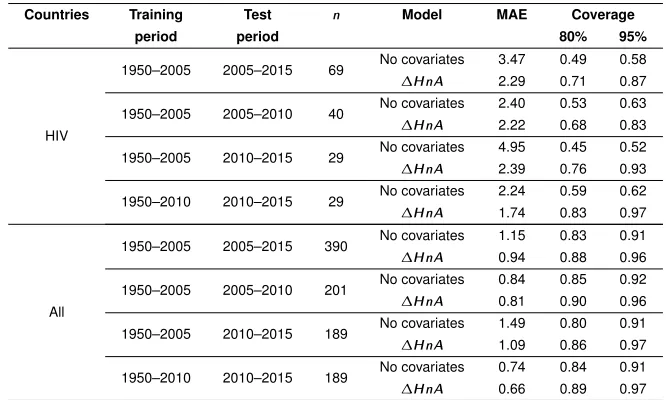
Table 1: Predictive validation results for female life expectancy
Countries Training Test n Model MAE Coverage
period period 80% 95%
HIV
1950–2005 2005–2015 69 No covariates 3.47 0.49 0.58
∆HnA 2.29 0.71 0.87
1950–2005 2005–2010 40 No covariates 2.40 0.53 0.63
∆HnA 2.22 0.68 0.83
1950–2005 2010–2015 29 No covariates 4.95 0.45 0.52
∆HnA 2.39 0.76 0.93
1950–2010 2010–2015 29 No covariates 2.24 0.59 0.62
∆HnA 1.74 0.83 0.97
All
1950–2005 2005–2015 390 No covariates 1.15 0.83 0.91
∆HnA 0.94 0.88 0.96
1950–2005 2005–2010 201 No covariates 0.84 0.85 0.92
∆HnA 0.81 0.90 0.96
1950–2005 2010–2015 189 No covariates 1.49 0.80 0.91
∆HnA 1.09 0.86 0.97
1950–2010 2010–2015 189 No covariates 0.74 0.84 0.91
∆HnA 0.66 0.89 0.97
There were 12 countries for which no new data became available between the pub-lication of the 2012 UN estimates in WPP 2012 (United Nations 2013) and the 2015 UN estimates in WPP 2015 (United Nations 2015). Hence, the WPP 2015 life expectancy estimate for the time period 2010–2015 is actually the projection of life expectancy for this period from the WPP 2012. As such, there is no observed life expectancy for these countries for the time period 2010–2015, and so we excluded these countries in this time period from the validation exercise. In the fifth column, ‘no covariates’ refers to the model in (1), and∆HnArefers to the model in (2).
The last three columns contain our metrics. The mean absolute error (MAE) is calculated as
1 n
X
c∈C
X
t∈T
|`ˆc,t−`c,t|, (3)
third column, andnis the number of country–time period combinations as shown in the fourth column. The last two columns show the proportion of countries whose 80% and 95% posterior predictive intervals contain the observed life expectancy in the validation period of interest.
In all the out-of-sample scenarios, we saw substantial improvements in coverage for HIV countries after accounting for HIV prevalence and ART coverage. We broke down the two-period out-of-sample exercise into the two projection periods to get more detailed information about the HIV countries. In 2005–2010, the model with no covariates missed 15 out of 40 HIV countries at the 95% level. When we accounted for HIV prevalence and ART coverage, the number of HIV countries missed went down by over half, to only 7 at the 95% level. For 2010–2015, the model with no covariates missed 14 out of 29 HIV countries at the 95% level, while accounting for HIV prevalence and ART coverage reduced this to only two HIV countries in the time period 2010–2015. In the leave-two-time-periods-out validation exercise, we saw a decrease in MAE for the HIV countries in every case, while the MAE remained unchanged for the non-HIV countries. For the non-HIV countries, the addition of the covariate in the model in (2) changed coverage negligibly.
When fitting the model using data from 1950–1955 up to 2005–2010 and projecting female life expectancy for 2010–2015, we also saw improvements. Our coverage was much closer to the target nominal proportion for HIV countries after accounting for HIV prevalence and ART coverage. We missed 11 HIV countries out of 29 in the model with no covariates but only one HIV country after accounting for the HIV epidemic. The MAE also decreased when accounting for HIV prevalence and ART coverage.
Predictive validation results for male life expectancy are shown in Table 2 in Ap-pendix B, and the conclusions are broadly similar.
The current method used by the UN to project life expectancy in the presence of the HIV epidemic is the Spectrum/EPP package (Futures Institute 2014; Stanecki, Garnett, and Ghys 2012; Stover, Brown, and Marston 2012). However, Spectrum is a complicated method with heavy data demands and is intended only for short-term projections up to five years into the future. Therefore, an important question is whether our simpler method can produce short-term projections similar to those of the more complex Spectrum method.
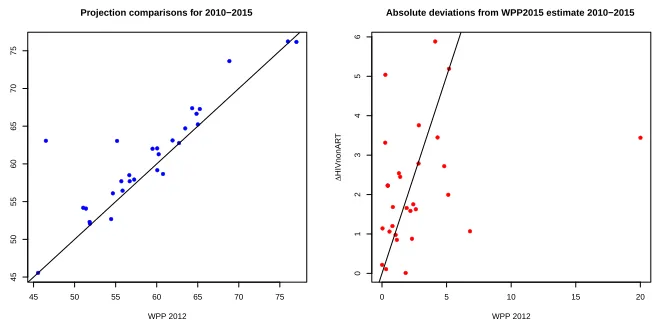
To answer this, we fit our model (2) using WPP 2012 estimates of female life ex-pectancy from 1950–1955 up to 2005–2010 (United Nations 2013). Then we projected female life expectancy to 2010–2015. We compared the projections from our simpler model designed to make long-term projections to the WPP 2012 projection for 2010– 2015 made using Spectrum. In the left panel of Figure 3, we see that the five-year projec-tions from our simpler method are similar to the projecprojec-tions from the more complicated Spectrum. In fact, the correlation between the projections from our proposed model and those published in WPP 2012 is 0.89.
esti-mate of female life expectancy in 2010–2015 for the projections published in WPP 2012 on the x axis and for our projections on the y axis. The WPP 2012 projections have a mean absolute error of 2.70 years using the WPP 2015 estimate for comparison. The projections produced with the model in (2) have a mean absolute error of 2.17 years.
Figure 3: Comparison between short-term projections in WPP 2012 using Spectrum, and our simpler method
● ● ● ● ● ● ● ● ● ● ●● ● ● ● ● ● ● ● ● ● ● ● ● ● ● ● ● ●
45 50 55 60 65 70 75
45 50 55 60 65 70 75
Projection comparisons for 2010−2015
WPP 2012 ∆ HIVnonAR T ● ● ● ● ● ● ● ● ● ● ● ● ● ● ● ● ● ● ● ● ● ● ● ● ● ● ● ● ●
0 5 10 15 20
0 1 2 3 4 5 6
Absolute deviations from WPP2015 estimate 2010−2015
WPP 2012
∆
HIVnonAR
T
Note: Left: On thex-axis are projections of female life expectancy in 2010–2015 produced using Spectrum and
published in WPP 2012. On they-axis are projections of female life expectancy in 2010–2015 produced by fitting
the model in (2) with WPP2012 data up to 2005–2010. The projections are mostly similar and remain close to the
y=xline. Right: This figure shows the absolute deviations of WPP 2012 female life expectancy projections for
2010–2015 from the WPP 2015 estimates on thex-axis, and the absolute deviations of projections using (2) from
the WPP 2015 estimates on they-axis. Overall they are similar, with one extreme improvement using (2) for the
country of Botswana.
3. Case studies
We now give specific results for five countries that illustrate specific aspects of the method. Results for all countries considered here as having generalized epidemics are given for female life expectancy in Appendix A and for male life expectancy in Appendix B.
3.1 Medium epidemic: Nigeria
Nigeria, located in West Africa, is the most populous country on the continent. It had an HIV prevalence of 3.6% in 2010–2015. Figure 4 shows a comparison between projections of life expectancy under the model (1) with no covariates in blue and the model (2) with the HIV covariate in red.
The median projections of female life expectancy are higher than those projected when not accounting for the HIV/AIDS epidemic, and accounting for the epidemic leads to more uncertainty about the future trajectory of female life expectancy in Nigeria.
Figure 4: Projections of female life expectancy in Nigeria (left) and the prevalence of HIV (right)
1950 2000 2050 2100
40
60
80
100
Nigeria
Year
Lif
e expectancy
● ●
●●
●
●● ● ● ● ●
● ● No covariates ∆HIVnonART
1950 2000 2050 2100
0
1
2
3
4
5
Nigeria
Year
HIV Pre
valence
● ● ● ● ● ● ● ●
● ●
● ●
● Median
80% 95%
3.2 Medium epidemic: Kenya
Kenya in East Africa has a medium-sized epidemic with HIV prevalence at 5.7% in 2010– 2015. Figure 5 shows that Kenya has already recovered to pre-epidemic life expectancy levels. After accounting for HIV prevalence and ART coverage, we project a slightly higher median female life expectancy to 2100 with more uncertainty at all time periods.
Figure 5: Projection of female life expectancy in Kenya (left) and the prevalence of HIV (right)
1950 2000 2050 2100
40
50
60
70
80
90
100
110
Kenya
Year
Lif
e expectancy
● ●
● ●
● ●
● ● ●
● ●
● ● No covariates ∆HIVnonART
1950 2000 2050 2100
0
2
4
6
8
10
Kenya
Year
HIV
p
re
valence
● ● ● ● ● ● ● ●
● ●
●
●
● Median
80% 95%
Note: The left panel shows projection of female life expectancy in Kenya under the model in equation (1) in blue and equation (2) in red. The solid lines represent medians, and the dashed lines are the 95% intervals. After accounting for HIV prevalence and ART coverage, we see a higher median projection of life expectancy with more uncertainty. The right panel shows the single trajectory of past estimates and future trajectories of HIV.
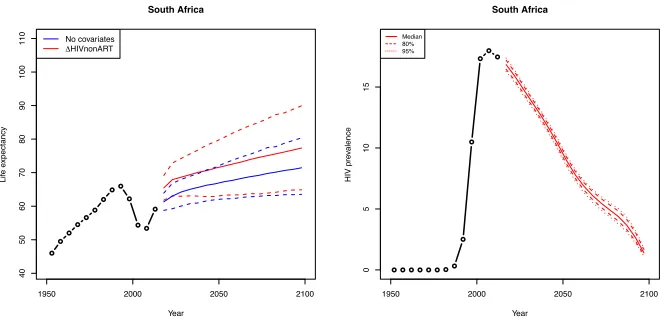
3.3 Widespread epidemic: South Africa
the HIV/AIDS epidemic. Thus, not accounting for HIV and ART in the model leads to projections that are contrary to the epidemiological literature referenced in Section 2.3, showing that life expectancy recovers quickly after a scale-up of ART coverage.
As mentioned in Section 2.4, there are a number of countries for which the UN did not have up-to-date life expectancy data at the time of publication of the WPP 2015, including South Africa. The UN estimates the female life expectancy for the period 2010– 2015 as 59.1 years (United Nations 2015). Statistics South Africa has published mid-year estimates of life expectancy for each calendar year (Statistics South Africa 2010, 2011, 2013, 2014, 2015), and averaging these gives an estimate for the five-year period 2010– 2015 of 60.7 years. When we fit our model with data up to 2005–2010 and project forward five years to 2010–2015, our 95% interval for 2010–2015 is (56.6, 65.1). When we fit our model with data only up to 2000–2005 and project forward ten years to 2010–2015, our 95% interval for 2010–2015 is (51.6, 63.7). In both cases, our interval captures the outcome, whether measured by the UN or Statistics South Africa, and in particular the rapid increase in life expectancy due to the widespread rollout of ART.
Figure 6: Projection of female life expectancy in South Africa (left) and the prevalence of HIV (right)
1950 2000 2050 2100
40
50
60
70
80
90
100
110
South Africa
Year
Lif
e expectancy
● ●
● ●
● ●
● ●●
●
● ●
● No covariates ∆HIVnonART
1950 2000 2050 2100
0
5
10
15
South Africa
Year
HIV
p
re
valence
● ● ● ● ● ● ●●
● ●
● ●
●
Median 80% 95%
3.4 Widespread epidemic: Botswana
HIV prevalence rose early and quickly in Botswana, and the ART scale-up was also quick. This led to a rapid recovery in life expectancy in the 2005–2010 time period. After accounting for the epidemic and ART, we project a slightly slower rise in median life expectancy with more certainty than the model that does not account for the epidemic. This is in agreement with the epidemiological literature cited in Section 2.3 suggesting that HIV/AIDS will affect life expectancy as a chronic disease would after ART has become pervasive.
Figure 7: Projection of female life expectancy in Botswana (left) and the prevalence of HIV (right)
1950 2000 2050 2100
50
60
70
80
90
100
110
Botswana
Year
Lif
e expectancy
● ●
● ●
● ●
●●
●
● ●
● ● No covariates ∆HIVnonART
1950 2000 2050 2100
0
5
10
15
20
25
Botswana
Year
HIV
p
re
valence
● ● ● ● ● ● ● ●
● ●
● ●
● Median
80% 95%
Note: The left panel shows projection of female life expectancy in Botswana under the model in equation (1) in blue and equation (2) in red. The solid lines represent medians, and the dashed lines are the 95% intervals. After accounting for HIV prevalence and ART coverage, we see a dampened, slow-rising median projection of life expectancy with less uncertainty.
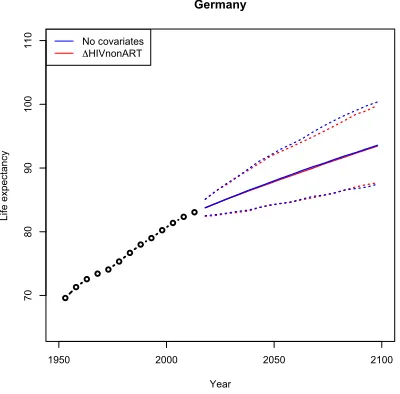
3.5 No epidemic: Germany
Figure 8: Projection of female life expectancy in Germany
1950 2000 2050 2100
70
80
90
100
110
Germany
Year
Life expectancy
No covariates
ΔHIVnonART
Note: This figure shows projection of female life expectancy in Germany under the model in equation (1) in black and equation (2) in red. The medians are identical, and the predictive intervals differ negligibly.
4. Discussion
We have developed a probabilistic method for projecting life expectancy while account-ing for generalized HIV/AIDS prevalence and ART coverage. Our method has relatively modest data requirements. Through predictive validation we have shown that our method improves upon life expectancy projections for countries with generalized HIV/AIDS epi-demics using the method in Raftery et al. (2013), while leaving projections for nonepi-demic countries essentially unchanged. Our projections improve in terms of both the mean absolute error of point predictions and the calibration of predictive intervals. Our method produces similar short-term projections to the UNAIDS Spectrum/EPP package, with a simpler model that requires much less data. Moreover, the method can produce long-term projections out to 2100.
Our method can be combined with population projection methods to make proba-bilistic population projections which account for the HIV/AIDS epidemic. Sharrow et al. (2016) convert our probabilistic projections of life expectancy to age- and sex-specific mortality rates using model life tables for countries with an HIV/AIDS epidemic (Shar-row, Clark, and Raftery 2014). Probabilistic projections of population size are then made using the cohort–component method (Raftery, Alkema, and Gerland 2014; ˇSevˇc´ıkov´a and Raftery 2016).
One limitation of our method is the quality of the ART coverage data and projec-tions. As ART coverage is relatively new and hard to measure, the data we have is noisy. Improvements in ART data quality would likely result in improvements in projections for the generalized HIV epidemic countries. Given high-quality data, our method could also be extended to account for other covariates that explain changes in life expectancy. The data would need to be available for every country used in model fitting back to 1950. Methodology for projecting the covariates would also be required.
5. Acknowledgments
References
Alho, J.M. and Spencer, B.D. (1985). Uncertain population forecast-ing. Journal of the American Statistical Association 80(390): 306–314.
doi:10.1080/01621459.1985.10478113.
Brown, T., Bao, L., Raftery, A.E., Salomon, J.A., Baggaley, R.F., Stover, J., and Ger-land, P. (2010). Modeling HIV epidemics in the antiretroviral era: The UNAIDS Estimation and Projection Package 2009. Sexually Transmitted Infections86: 3–10.
doi:10.1136/sti.2010.044784.
Deeks, S.G., Lewin, S.R., and Havlir, D.V. (2013). The end of AIDS: HIV infec-tion as a chronic disease. The Lancet 382(9903): 1525–1533.
doi:10.1016/S0140-6736(13)61809-7.
Futures Institute (2014). Spectrum/EPP 2014 version 5.06. (downloaded June 2014). http://www.futuresinstitute.org/spectrum.aspx.
Girosi, F. and King, G. (2008). Demographic forecasting. Princeton: Princeton Univer-sity Press.
Johnson, L.F., Mossong, J., Dorrington, R.E., Schomaker, M., Hoffmann, C.J., Keiser, O., Fox, M.P., Wood, R., Prozesky, H., Giddy, J., Garone, D.B., Cornell, M., Egger, M., and Boulle, A. (2013). Life expectancies of South African adults starting antiretroviral treatment: Collaborative analysis of cohort studies. PLoS Medicine10(4): e1001418.
doi:10.1371/journal.pmed.1001418.
Lee, R. and Miller, T. (2001). Evaluating the performance of the Lee–Carter method for forecasting mortality.Demography38(4): 537–549. doi:10.1353/dem.2001.0036.
Lee, R.D. and Carter, L.R. (1992). Modeling and forecasting US mortality. Journal of the American Statistical Association87(419): 659–671.
Lutz, W., Sanderson, W.C., and Scherbov, S. (1998). Expert-based probabilistic popula-tion projecpopula-tions.Population and Development Review24: 139–155.
Mills, E.J., Bakanda, C., Birungi, J., Chan, K., Ford, N., Cooper, C.L., Nachega, J.B., Dybul, M., and Hogg, R.S. (2011). Life expectancy of persons receiving combination antiretroviral therapy in low-income countries: A cohort analysis from Uganda.Annals of Internal Medicine 155(4): 209–216.
doi:10.7326/0003-4819-155-4-201108160-00358.
Raftery, A.E., Alkema, L., and Gerland, P. (2014). Bayesian population projections for the United Nations.Statistical Science29(1): 58.doi:10.1214/13-STS419.
proba-bilistic projections of life expectancy for all countries. Demography50(3): 777–801.
doi:10.1007/s13524-012-0193-x.
Raftery, A.E., Lalic, N., and Gerland, P. (2014). Joint probabilistic projection of female and male life expectancy. Demographic Research 30(27): 795–822.
doi:10.4054/DemRes.2014.30.27.
ˇSevˇc´ıkov´a, H. and Raftery, A.E. (2016). bayesPop: Probabilistic population projections.
Journal of Statistical Software75(5). doi:10.18637/jss.v075.i05.
Sharrow, D.J., Clark, S.J., and Raftery, A.E. (2014). Modeling age-specific mor-tality for countries with generalized HIV epidemics. PloS One 9(5): e96447.
doi:10.1371/journal.pone.0096447.
Sharrow, D.J., Godwin, J., He, Y., Clark, S.J., and Raftery, A.E. (2016). Probabilistic population projections for countries with generalized HIV/AIDS epidemics. arXiv preprint1609.04383.
Stanecki, K., Garnett, G.P., and Ghys, P.D. (2012). Developments in the field of HIV estimates: Methods, parameters and trends. Sexually Transmitted Infections88: i1–i2.
doi:10.1136/sextrans-2012-050885.
Statistics South Africa (2010). Mid-year population estimates 2010. http://www.statssa. gov.za/publications/P0302/P03022010.pdf.
Statistics South Africa (2011). Mid-year population estimates 2011. http://www.statssa. gov.za/publications/P0302/P03022011.pdf.
Statistics South Africa (2013). Mid-year population estimates 2013. http://www.statssa. gov.za/publications/P0302/P03022013.pdf.
Statistics South Africa (2014). Mid-year population estimates 2014. https://www.statssa. gov.za/publications/P0302/P03022014.pdf.
Statistics South Africa (2015). Mid-year population estimates 2015. https://www.statssa. gov.za/publications/P0302/P03022015.pdf.
Stover, J., Brown, T., and Marston, M. (2012). Updates to the Spectrum/Estimation and Projection Package (EPP) model to estimate HIV trends for adults and children.
Sexually Transmitted Infections 88(Suppl. 2): i11–i16.
doi:10.1136/sextrans-2012-050640.
UNAIDS (2014). Quick start guide for Spectrum. Geneva: UNAIDS.
United Nations (2013). World population prospects: The 2012 revision. New York: United Nations, Department of Economic and Social Affairs, Population Division.
United Nations, Department of Economic and Social Affairs, Population Division.
Wilmoth, J.R., Deegan, L.J., Lundstr¨om, H., and Horiuchi, S. (2000). In-crease of maximum life-span in Sweden, 1861–1999. Science 289: 2366–2368.
Appendix A: Female life expectancy and adult HIV prevalence
projections
In the left panel of every row below are projections of life expectancy using our model (2) for all countries we treat as generalized epidemic countries. The right panel shows our observed trajectories of HIV prevalence and our projections of HIV prevalence made using a single trajectory of HIV prevalence for each country allowing the EPP projections to give uncertainty. The format of these figures is the same as that of Figures 4–7 in Section 3.
1950 2000 2050 2100
40
60
80
100
Angola
Year
Lif
e expectancy
●●
●●●●
●●●●
●●
● No covariates
∆HIVnonART
1950 2000 2050 2100
0
1
2
3
4
5
Angola
Year
HIV pre
v
alence
●●●●●●●●
●
●●●●
Median 80% 95%
1950 2000 2050 2100
60
70
80
90
100
Bahamas
Year
Lif
e expectancy
●●
●●
●●
●●●
●●●
● No covariates
∆HIVnonART
1950 2000 2050 2100
0
2
4
6
8
10
12
Bahamas
Year
HIV pre
v
alence
●●●●●●● ●
1950 2000 2050 2100
50
60
70
80
90
100
Belize
Year
Lif
e expectancy
●●
●●
●●
●●●●●●● No covariates
∆HIVnonART
1950 2000 2050 2100
0
2
4
6
8
Belize
Year
HIV pre
v
alence
●●●●●●●● ●
●●●●
Median 80% 95%
1950 2000 2050 2100
40
60
80
100
Benin
Year
Lif
e expectancy
●●
●●
●●
●●
●●●●●
No covariates
∆HIVnonART
1950 2000 2050 2100
0.0
0.5
1.0
1.5
2.0
Benin
Year
HIV pre
v
alence
●●●●●●●●
● ●
● ●
1950 2000 2050 2100
50
60
70
80
90
110
Botswana
Year
Lif
e expectancy
●●
●●
●
●●●●
● ●
● ● No covariates
∆HIVnonART
1950 2000 2050 2100
0
5
10
15
20
25
Botswana
Year
HIV pre
v
alence
●●●●●●●●
● ●
● ●
● Median 80% 95%
1950 2000 2050 2100
40
60
80
100
Burkina Faso
Year
Lif
e expectancy
●●
●●
●●
●●●●●
●●
No covariates
∆HIVnonART
1950 2000 2050 2100
0
1
2
3
4
Burkina Faso
Year
HIV pre
v
alence
●●●●●● ●
● ●
●
●
1950 2000 2050 2100
40
60
80
100
Burundi
Year
Lif
e expectancy
●●●●
●●●●●
●●●
● No covariates
∆HIVnonART
1950 2000 2050 2100
0
1
2
3
4
5
6
Burundi
Year
HIV pre
v
alence
●●●●●●●
● ●
●
●
●
● Median 80% 95%
1950 2000 2050 2100
40
60
80
100
Cameroon
Year
Lif
e expectancy
●●
●●
●●●●●●●●
● No covariates
∆HIVnonART
1950 2000 2050 2100
0
1
2
3
4
5
6
7
Cameroon
Year
HIV pre
v
alence
●●●●●●●●
● ●
●●●
1950 2000 2050 2100
40
60
80
100
Central African Republic
Year
Lif
e expectancy
●●
●●
● ●●●●
●●●
● No covariates
∆HIVnonART
1950 2000 2050 2100
0
2
4
6
8
10
Central African Republic
Year
HIV pre
v
alence
●●●●●●● ●
● ●
●
●
● Median 80% 95%
1950 2000 2050 2100
40
60
80
100
Chad
Year
Lif
e expectancy
●●●●
●●●●
●●●● ● No covariates
∆HIVnonART
1950 2000 2050 2100
0
1
2
3
4
Chad
Year
HIV pre
v
alence
●●●●●●●
● ●
●
●●●
1950 2000 2050 2100
40
60
80
100
Congo
Year
Lif
e expectancy
● ●
●●●
●●● ●
●● ●
● No covariates
∆HIVnonART
1950 2000 2050 2100
0
1
2
3
4
5
6
Congo
Year
HIV pre
v
alence
●●●●●● ●
● ●
●
● ●
● Median 80% 95%
1950 2000 2050 2100
40
60
80
100
Cote d'Ivoire
Year
Lif
e expectancy
●●
●●
●●
●●●
●●●●
No covariates
∆HIVnonART
1950 2000 2050 2100
0
2
4
6
8
Cote d'Ivoire
Year
HIV pre
v
alence
●●●●●●● ●
● ●
●
●
1950 2000 2050 2100
40
60
80
100
Djibouti
Year
Lif
e expectancy
●●
●●
●●
●●●●●
●●
No covariates
∆HIVnonART
1950 2000 2050 2100
0
1
2
3
4
5
6
7
Djibouti
Year
HIV pre
v
alence
●●●●●●● ●
●
●●●●
Median 80% 95%
1950 2000 2050 2100
40
60
80
100
Equatorial Guinea
Year
Lif
e expectancy
●●●●
●● ●●
●●●
●●
No covariates
∆HIVnonART
1950 2000 2050 2100
0
2
4
6
8
10
12
Equatorial Guinea
Year
HIV pre
v
alence
●●●●●●●●● ●
● ●
1950 2000 2050 2100
40
60
80
100
Ethiopia
Year
Lif
e expectancy
●●
●●●●●
●●
●●
● ● No covariates
∆HIVnonART
1950 2000 2050 2100
0.0
1.0
2.0
3.0
Ethiopia
Year
HIV pre
v
alence
●●●●●●●●
● ●
●
●
● Median 80% 95%
1950 2000 2050 2100
40
60
80
100
Gabon
Year
Lif
e expectancy
●●●
● ●
●
●●●●●●
● No covariates
∆HIVnonART
1950 2000 2050 2100
0
2
4
6
8
10
Gabon
Year
HIV pre
v
alence
●●●●●●●●
● ●
●●●
1950 2000 2050 2100
40
60
80
100
Gambia
Year
Lif
e expectancy
●●●
●
●●
●●●
●●
●● No covariates
∆HIVnonART
1950 2000 2050 2100
0
2
4
6
8
10
12
Gambia
Year
HIV pre
v
alence
●●●●●●●●●●
●
●●
Median 80% 95%
1950 2000 2050 2100
40
60
80
100
Ghana
Year
Lif
e expectancy
●●
●●
●●●
●●●●
●● No covariates
∆HIVnonART
1950 2000 2050 2100
0.0
1.0
2.0
3.0
Ghana
Year
HIV pre
v
alence
●●●●●●●●
● ●
● ●
1950 2000 2050 2100
40
60
80
100
Guinea
Year
Lif
e expectancy
●●●●
●●
●
●●●●
●●
No covariates
∆HIVnonART
1950 2000 2050 2100
0
2
4
6
Guinea
Year
HIV pre
v
alence
●●●●●●● ●
● ●
● ●● Median 80% 95%
1950 2000 2050 2100
40
60
80
100
Guinea−Bissau
Year
Lif
e expectancy
●●●
●●
●●●
●●●●
● No covariates
∆HIVnonART
1950 2000 2050 2100
0
2
4
6
8
Guinea−Bissau
Year
HIV pre
v
alence
●●●●●●●● ●
●
●●●
1950 2000 2050 2100
60
70
80
90
100
Guyana
Year
Lif
e expectancy
●●●●
●●●●
●●●●● No covariates
∆HIVnonART
1950 2000 2050 2100
0
1
2
3
4
Guyana
Year
HIV pre
v
alence
●●●●●●
● ●
●
●
●
● ● Median 80% 95%
1950 2000 2050 2100
40
60
80
100
Haiti
Year
Lif
e expectancy
●●
●●
●●●
●●●●
●●
No covariates
∆HIVnonART
1950 2000 2050 2100
0
2
4
6
8
Haiti
Year
HIV pre
v
alence
●●●●●●●●
● ●
● ●
1950 2000 2050 2100
60
70
80
90
100
Jamaica
Year
Lif
e expectancy
● ●
●●
●●
●●●●●●
● No covariates
∆HIVnonART
1950 2000 2050 2100
0
2
4
6
8
10
12
Jamaica
Year
HIV pre
v
alence
●●●●●●●
●●●●●●
Median 80% 95%
1950 2000 2050 2100
40
60
80
100
Kenya
Year
Lif
e expectancy
●●
●●
●●
●●●
●● ●
● No covariates
∆HIVnonART
1950 2000 2050 2100
0
2
4
6
8
10
Kenya
Year
HIV pre
v
alence
●●●●●●● ●
● ●
●
1950 2000 2050 2100
40
60
80
100
Lesotho
Year
Lif
e expectancy
●●
●●●
●●
●●
●
●●
● No covariates
∆HIVnonART
1950 2000 2050 2100
0
5
10
15
20
25
Lesotho
Year
HIV pre
v
alence
●●●●●●●● ●
● ●
●● Median 80% 95%
1950 2000 2050 2100
40
60
80
100
Liberia
Year
Lif
e expectancy
●●●
●●
●●●●
●●
●●
No covariates
∆HIVnonART
1950 2000 2050 2100
0
2
4
6
8
Liberia
Year
HIV pre
v
alence
●●●●●●●● ●
●
●
●
1950 2000 2050 2100
40
60
80
100
Malawi
Year
Lif
e expectancy
●●●●
●●●●●●●
● ● No covariates
∆HIVnonART
1950 2000 2050 2100
0
5
10
15
Malawi
Year
HIV pre
v
alence
●●●●●●●
● ●
●
●
● ● Median 80% 95%
1950 2000 2050 2100
20
40
60
80
100
Mali
Year
Lif
e expectancy
●●●●
●●
●●●
●●
●●
No covariates
∆HIVnonART
1950 2000 2050 2100
0.0
0.5
1.0
1.5
2.0
2.5
Mali
Year
HIV pre
v
alence
●●●●●●●●
● ●
●
●
1950 2000 2050 2100
40
60
80
100
Mozambique
Year
Lif
e expectancy
●●
●●
●●●●●
●●●
● No covariates
∆HIVnonART
1950 2000 2050 2100
0
2
4
6
8
10
14
Mozambique
Year
HIV pre
v
alence
●●●●●●●●
● ●
● ●● Median 80% 95%
1950 2000 2050 2100
40
60
80
100
Namibia
Year
Lif
e expectancy
●●
●●
●●
●●●●
● ●
● No covariates
∆HIVnonART
1950 2000 2050 2100
0
5
10
15
Namibia
Year
HIV pre
v
alence
●●●●●●● ●
● ●
●
●
1950 2000 2050 2100
40
60
80
100
Nigeria
Year
Lif
e expectancy
●●
●●●
●●●●●●
●●
No covariates
∆HIVnonART
1950 2000 2050 2100
0
1
2
3
4
5
Nigeria
Year
HIV pre
v
alence
●●●●●●● ●
● ●
●●●
Median 80% 95%
1950 2000 2050 2100
20
40
60
80
100
Rwanda
Year
Lif
e expectancy
●●●●●
●●●
● ●
●
●●
No covariates
∆HIVnonART
1950 2000 2050 2100
0
1
2
3
4
5
6
Rwanda
Year
HIV pre
v
alence
●●●●●● ●
● ●
●
●
1950 2000 2050 2100
40
60
80
100
Sierra Leone
Year
Lif
e expectancy
●●●●
●●●●●●
●●
● No covariates
∆HIVnonART
1950 2000 2050 2100
0
1
2
3
4
Sierra Leone
Year
HIV pre
v
alence
●●●●●●●●●
● ●
●● Median 80% 95%
1950 2000 2050 2100
40
60
80
100
South Africa
Year
Lif
e expectancy
●
●●
●●
●●
●● ●
●● ● No covariates
∆HIVnonART
1950 2000 2050 2100
0
5
10
15
South Africa
Year
HIV pre
v
alence
●●●●●●●● ●
●
●●●
1950 2000 2050 2100
40
60
80
100
Swaziland
Year
Lif
e expectancy
●●●
●●
●●
●●
●
●●●
No covariates
∆HIVnonART
1950 2000 2050 2100
0
5
10
15
20
25
Swaziland
Year
HIV pre
v
alence
●●●●●●● ●
● ●
● ●● Median 80% 95%
1950 2000 2050 2100
40
60
80
100
Togo
Year
Lif
e expectancy
●●
●●
●●
●●●●●● ● No covariates
∆HIVnonART
1950 2000 2050 2100
0
1
2
3
4
5
6
7
Togo
Year
HIV pre
v
alence
●●●●●●●●
● ●
● ●
1950 2000 2050 2100
40
60
80
100
Uganda
Year
Lif
e expectancy
●●
●●●●●●●●
● ●
● No covariates
∆HIVnonART
1950 2000 2050 2100
0
2
4
6
8
10
Uganda
Year
HIV pre
v
alence
●●●●●● ●
● ●
●
● ●● Median 80% 95%
1950 2000 2050 2100
40
60
80
100
United Republic of Tanzania
Year
Lif
e expectancy
●●●
●●●●●●●
● ●
● No covariates
∆HIVnonART
1950 2000 2050 2100
0
2
4
6
8
United Republic of Tanzania
Year
HIV pre
v
alence
●●●●●●●
● ●
●
●
●
1950 2000 2050 2100
40
60
80
100
Zambia
Year
Lif
e expectancy
●●
●●
●●● ●
●●●
● ● No covariates
∆HIVnonART
1950 2000 2050 2100
0
5
10
15
Zambia
Year
HIV pre
v
alence
●●●●●● ●
●
●●●●
● Median 80% 95%
1950 2000 2050 2100
40
60
80
100
Zimbabwe
Year
Lif
e expectancy
●●
●●●
●●●
●
● ●
● ● No covariates
∆HIVnonART
1950 2000 2050 2100
0
5
10
15
20
25
Zimbabwe
Year
HIV pre
v
alence
●●●●●●●
● ●
●
●
●
Appendix B: Male life expectancy and adult HIV prevalence
projections
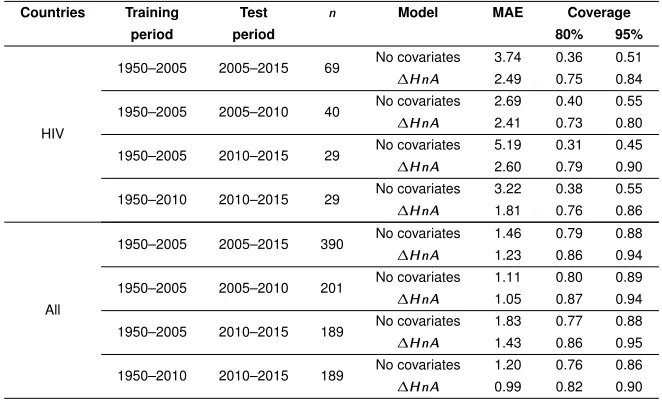
Table 2: Out-of-sample validation results for male life expectancy projected using the gap model in Raftery, Lalic, and Gerland 2014
Countries Training Test n Model MAE Coverage
period period 80% 95%
HIV
1950–2005 2005–2015 69 No covariates 3.74 0.36 0.51
∆HnA 2.49 0.75 0.84
1950–2005 2005–2010 40 No covariates 2.69 0.40 0.55
∆HnA 2.41 0.73 0.80
1950–2005 2010–2015 29 No covariates 5.19 0.31 0.45
∆HnA 2.60 0.79 0.90
1950–2010 2010–2015 29 No covariates 3.22 0.38 0.55
∆HnA 1.81 0.76 0.86
All
1950–2005 2005–2015 390 No covariates 1.46 0.79 0.88
∆HnA 1.23 0.86 0.94
1950–2005 2005–2010 201 No covariates 1.11 0.80 0.89
∆HnA 1.05 0.87 0.94
1950–2005 2010–2015 189 No covariates 1.83 0.77 0.88
∆HnA 1.43 0.86 0.95
1950–2010 2010–2015 189 No covariates 1.20 0.76 0.86
∆HnA 0.99 0.82 0.90
Note: The first column represents the set of countries used in the subsequent calibration calculations. The second column represents the time period of data used to fit the model, and the third column represents the time periods used in validation. The fourth column represents the number of countries used in validation. In the fifth column, “No
Covariates” represents the model in (1) and “∆HnA” represents the model in (2). The sixth column contains the
1950 2000 2050 2100
40
60
80
100
Angola
Year
Lif
e expectancy
●●
●●
●●●●●●
●●●
No covariates
∆HIVnonART
1950 2000 2050 2100
0
1
2
3
4
5
Angola
Year
HIV pre
v
alence
●●●●●●●●
●
●●●●
Median 80% 95%
1950 2000 2050 2100
50
60
70
80
90
100
Bahamas
Year
Lif
e expectancy
●
●●
●●
●●●●●
●●● No covariates
∆HIVnonART
1950 2000 2050 2100
0
2
4
6
8
10
12
Bahamas
Year
HIV pre
v
alence
●●●●●●● ●
1950 2000 2050 2100
50
60
70
80
90
110
Belize
Year
Lif
e expectancy
●●
●●
●●
●●●
●●●●
No covariates
∆HIVnonART
1950 2000 2050 2100
0
2
4
6
8
Belize
Year
HIV pre
v
alence
●●●●●●●● ●
●●●●
Median 80% 95%
1950 2000 2050 2100
40
60
80
100
Benin
Year
Lif
e expectancy
●●●
● ●
●●●
●●●●●
No covariates
∆HIVnonART
1950 2000 2050 2100
0.0
0.5
1.0
1.5
2.0
Benin
Year
HIV pre
v
alence
●●●●●●●●
● ●
● ●
1950 2000 2050 2100
40
60
80
100
Botswana
Year
Lif
e expectancy
●
●●
●
●●
●● ●
● ●
●●
No covariates
∆HIVnonART
1950 2000 2050 2100
0
5
10
15
20
25
Botswana
Year
HIV pre
v
alence
●●●●●●●●
● ●
● ●
● Median 80% 95%
1950 2000 2050 2100
40
60
80
100
Burkina Faso
Year
Lif
e expectancy
●●●●
●●
●●●●●
●●
No covariates
∆HIVnonART
1950 2000 2050 2100
0
1
2
3
4
Burkina Faso
Year
HIV pre
v
alence
●●●●●● ●
● ●
●
●
1950 2000 2050 2100
40
60
80
100
Burundi
Year
Lif
e expectancy
●●●●●
●●●●●
●●
● No covariates
∆HIVnonART
1950 2000 2050 2100
0
1
2
3
4
5
6
Burundi
Year
HIV pre
v
alence
●●●●●●●
● ●
●
●
●
● Median 80% 95%
1950 2000 2050 2100
40
60
80
100
Cameroon
Year
Lif
e expectancy
●●
●●
●●
●●●●
●●●
No covariates
∆HIVnonART
1950 2000 2050 2100
0
1
2
3
4
5
6
7
Cameroon
Year
HIV pre
v
alence
●●●●●●●●
● ●
●●●
1950 2000 2050 2100
40
60
80
100
Central African Republic
Year
Lif
e expectancy
●●
●●
●●
●●●
●●●●
No covariates
∆HIVnonART
1950 2000 2050 2100
0
2
4
6
8
10
Central African Republic
Year
HIV pre
v
alence
●●●●●●● ●
● ●
●
●
● Median 80% 95%
1950 2000 2050 2100
40
60
80
100
Chad
Year
Lif
e expectancy
●
●●●●●
●●●●●●
● No covariates
∆HIVnonART
1950 2000 2050 2100
0
1
2
3
4
Chad
Year
HIV pre
v
alence
●●●●●●●
● ●
●
●●●
1950 2000 2050 2100
40
60
80
100
Congo
Year
Lif
e expectancy
●●
●●●
●●● ●
●● ●
● No covariates
∆HIVnonART
1950 2000 2050 2100
0
1
2
3
4
5
6
Congo
Year
HIV pre
v
alence
●●●●●● ●
● ●
●
● ●
● Median 80% 95%
1950 2000 2050 2100
40
60
80
100
Cote d'Ivoire
Year
Lif
e expectancy
●●
●●
●●
●●●
●●●●
No covariates
∆HIVnonART
1950 2000 2050 2100
0
2
4
6
8
Cote d'Ivoire
Year
HIV pre
v
alence
●●●●●●● ●
● ●
●
●
1950 2000 2050 2100
40
60
80
100
Djibouti
Year
Lif
e expectancy
●●
●●
●●
●●●●●●
● No covariates
∆HIVnonART
1950 2000 2050 2100
0
1
2
3
4
5
6
7
Djibouti
Year
HIV pre
v
alence
●●●●●●● ●
●
●●●●
Median 80% 95%
1950 2000 2050 2100
40
60
80
100
Equatorial Guinea
Year
Lif
e expectancy
●
●●●
●● ●●
●●●
●●
No covariates
∆HIVnonART
1950 2000 2050 2100
0
2
4
6
8
10
12
Equatorial Guinea
Year
HIV pre
v
alence
●●●●●●●●● ●
● ●
1950 2000 2050 2100
40
60
80
100
Ethiopia
Year
Lif
e expectancy
●●
●●●●●
●●
●●
● ● No covariates
∆HIVnonART
1950 2000 2050 2100
0.0
1.0
2.0
3.0
Ethiopia
Year
HIV pre
v
alence
●●●●●●●●
● ●
●
●
● Median 80% 95%
1950 2000 2050 2100
40
60
80
100
Gabon
Year
Lif
e expectancy
● ●●
● ●
●●
●● ●
●● ● No covariates
∆HIVnonART
1950 2000 2050 2100
0
2
4
6
8
10
Gabon
Year
HIV pre
v
alence
●●●●●●●●
● ●
●●●
1950 2000 2050 2100
40
60
80
100
Gambia
Year
Lif
e expectancy
●●● ●
●
●●●
●●●
●● No covariates
∆HIVnonART
1950 2000 2050 2100
0
2
4
6
8
10
12
Gambia
Year
HIV pre
v
alence
●●●●●●●●●●
●
●●
Median 80% 95%
1950 2000 2050 2100
40
60
80
100
Ghana
Year
Lif
e expectancy
●●●
●●●
●●●●●●
● No covariates
∆HIVnonART
1950 2000 2050 2100
0.0
1.0
2.0
3.0
Ghana
Year
HIV pre
v
alence
●●●●●●●●
● ●
● ●
1950 2000 2050 2100
40
60
80
100
Guinea
Year
Lif
e expectancy
●●●●
●●
● ●●●●
●●
No covariates
∆HIVnonART
1950 2000 2050 2100
0
2
4
6
Guinea
Year
HIV pre
v
alence
●●●●●●● ●
● ●
● ●● Median 80% 95%
1950 2000 2050 2100
40
60
80
100
Guinea−Bissau
Year
Lif
e expectancy
● ●●
●●●
●●●●●●
● No covariates
∆HIVnonART
1950 2000 2050 2100
0
2
4
6
8
Guinea−Bissau
Year
HIV pre
v
alence
●●●●●●●● ●
●
●●●
1950 2000 2050 2100
50
60
70
80
90
110
Guyana
Year
Lif
e expectancy
●●●●●●
●●●●●●●
No covariates
∆HIVnonART
1950 2000 2050 2100
0
1
2
3
4
Guyana
Year
HIV pre
v
alence
●●●●●●
● ●
●
●
●
● ● Median 80% 95%
1950 2000 2050 2100
40
60
80
100
Haiti
Year
Lif
e expectancy
●●
●●
●●
●●●
●●●
● No covariates
∆HIVnonART
1950 2000 2050 2100
0
2
4
6
8
Haiti
Year
HIV pre
v
alence
●●●●●●●●
● ●
● ●