R E S E A R C H
Open Access
Deletion of the type-1 interferon receptor
in APP
SWE
/PS1
Δ
E9
mice preserves cognitive
function and alters glial phenotype
Myles R. Minter
1, Zachery Moore
1, Moses Zhang
1, Kate M. Brody
1, Nigel C. Jones
2, Sandy R. Shultz
2,
Juliet M. Taylor
1*and Peter J. Crack
1*Abstract
A neuro-inflammatory response is evident in Alzheimer’s disease (AD), yet the precise mechanisms by which neuro-inflammation influences the progression of Alzheimer’s disease (AD) remain poorly understood. Type-1 interferons (IFNs) are master regulators of innate immunity and have been implicated in multiple CNS disorders, however their role in AD progression has not yet been fully investigated. Hence, we generated APPSWE/PS1ΔE9mice
lacking the type-1 IFN alpha receptor-1 (IFNAR1, APPSWE/PS1ΔE9x IFNAR1−/−) aged to 9 months to investigate the
role of type-1 IFN signaling in a well-validated model of AD. APPSWE/PS1ΔE9x IFNAR1−
/−mice displayed a modest
reduction in Aβmonomer levels, despite maintenance of plaque deposition. This finding correlated with partial rescue of spatial learning and memory impairments in the Morris water maze in comparison to APPSWE/PS1ΔE9
mice. Q-PCR identified a reduced type-1 IFN response and modulated pro-inflammatory cytokine secretion in APPSWE/PS1ΔE9x IFNAR1−
/−mice compared to APP
SWE/PS1ΔE9mice. Interestingly, immunohistochemistry displayed
enhanced astrocyte reactivity but attenuated microgliosis surrounding amyloid plaque deposits in APPSWE/PS1ΔE9x
IFNAR1−/−mice in comparison to APPSWE/PS1ΔE9mice. These APPSWE/PS1ΔE9x IFNAR1−
/−microglial populations
demonstrated an anti-inflammatory phenotype that was confirmed in vitro by soluble Aβ1-42 treatment of IFNAR1−/− primary glial cultures. Our findings suggest that modulating neuro-inflammatory responses by suppressing type-1 IFN signaling may provide therapeutic benefit in AD.
Keywords:Alzheimer’s disease, Type-1 interferons, Neuro-inflammation, Cognition, Amyloid-β, Microglial polarization
Introduction
Pathologically, Alzheimer’s disease (AD) is characterized
by the extracellular accumulation of Aβ plaques [60]
and presence of neurofibrillary tangles containing hyper-phosphorylated tau [22]. Yet targeting these proteinopathies has yet proven clinically efficacious [47]. Neuro-inflammation, involving pro-inflammatory cytokine secretion and reactive gliosis, is evident in AD [34, 37, 38, 48, 54] and epidemiological evidence suggests that this innate immune process is a key contributor to disease pathogenesis [6, 59, 67]. However
the exact contribution of cytokines to the exacerbation of neuro-inflammation in AD remains unclear.
Oligomeric and fibrillar Aβ are detected by pattern
recognition receptors of the innate immune system and trigger inflammasome activation [57, 58]. Many studies
have utilized the APPSWE/PS1ΔE9mouse model of AD as
a tool to investigate in vivo inflammasome activation in
response to Aβproduction. These mice displays elevated
production of Aβ1-42, leading to progressive plaque
de-position and cognitive decline beginning at 6–9 months of age [30, 31]. Removal of the NLRP3 inflammasome,
critical for caspase-1-mediated production of IL-1β, in
APPSWE/PS1ΔE9 mice confers reductions in Aβ load,
enhances LTP and rescues cognitive impairments [26]. A supportive study addressing the NLRP1 inflammasome
also demonstrated that a reduced IL-1β response to
amyloid is beneficial in APPSWE/PS1ΔE9 mice and
* Correspondence:[email protected];[email protected]
1Department of Pharmacology and Therapeutics, University of Melbourne,
8th floor, Medical building, Grattan St, Parkville, Melbourne 3010, Victoria, Australia
Full list of author information is available at the end of the article
reduces neuronal pyroptosis [62]. In addition, monoclonal antibodies blocking IL-12/IL-23 signaling attenuate amyloid
burden and cognitive defects in APPSWE/PS1ΔE9mice [66].
Findings from these studies suggest that microglial phenotype and function play an important role in the exacerbation and progression of AD. Upon stimulus with pro-inflammatory cytokines, microglia can polarize towards a pro-inflammatory phenotype that is deleteri-ous to neurogenesis and synaptic plasticity. Microglial
populations can also adopt an alternate
anti-inflammatory phenotype that results from exposure to anti-inflammatory cytokines and promotes resolution of inflammation considered to be neuro-protective [45, 55]. These aforementioned studies demonstrate that targeting pro-inflammatory cytokine networks can attenuate
neuro-inflammation, promote Aβclearance and confer cognitive
benefit in mouse models of AD by promoting anti-inflammatory activity of microglia. However, Adenoviral delivery of anti-inflammatory cytokines IL-4 or IL-10
results in deleterious effects, impeding Aβclearance and
worsening cognitive decline [10, 11]. In contrast complete removal of IL-10 promotes innate immunity and mitigates
AD-like pathology in APPSWE/PS1ΔE9mice [23]. Clearly a
greater understanding of pro- and anti-inflammatory cyto-kine signaling is required to explain how modulating innate neuro-inflammation impacts progression of AD.
The pleiotropic type-1 IFNs regulate the aforemen-tioned pro-inflammatory cytokine systems and are mas-ter regulators of the innate immune response [19, 33]. By signalling through the type-1 interferon receptor alpha-1 (IFNAR1) and activating the Janus associated kinase/Signal transducer and activator of transcription (JAK/Stat) pathway, type-1 IFNs can induce pro-inflammatory gene transcription generating hallmark
cytokines (IL-1β, IL-6 and TNFα) that regulate immune
cell recruitment and inflammatory progression. Whilst their contribution to peripheral immunity is well docu-mented, type-1 IFNs are produced and trigger inflamma-tory cascades in CNS residing neurons and microglia [14, 52]. Elevated type-1 IFN levels have been linked to
exacerbation numerous neuro-pathologies including
Aicardi-Goutieres syndrome [17, 18] and systemic lupus erythromatosus [8]. It is now considered that a balance of interferon signalling is required for healthy brain physiology and dysregulation of this cytokine system can
result in brain ‘interferonopathies’ [20]. Significantly, an
exacerbated type-1 IFN response contributes to many deleterious effects associated with the aging process [3]. In addition, a type-1 IFN signature in both human AD
patients and APPSWE/PS1ΔE9 mice is evident and
re-moval IFNAR1 confers protection against soluble Aβ
1-42-induced toxicity in primary cultured neurons [64]. We hypothesize that removal of type-1 IFN signaling attenuates neuro-inflammation and delays phenotypic
progression in APPSWE/PS1ΔE9 mice. To test this, we
generated APPSWE/PS1ΔE9 x IFNAR1−/− mice and used
primary mixed astrocyte and microglial cultures and pri-mary neuronal cultures to investigate the role of type-1
IFN signaling in AD. We find that APPSWE/PS1ΔE9 x
IFNAR1−/− mice display modest reductions in
mono-meric Aβ load, without altering plaque deposition, and
improved spatial cognitive performance. These mice exhibit a predominantly anti-inflammatory glial phenotype
when compared to APPSWE/PS1ΔE9mice alone. We
con-firm this anti-inflammatory glial phenotype in vitro in
re-sponse to Aβ1-42 and demonstrate this polarization state
protects primary neuronal cultures. Importantly, this study demonstrates that removal of type-1 IFN signaling modulates neuro-inflammation and retards phenotypic
progression in the APPSWE/PS1ΔE9mouse model of AD.
Materials and Methods
Animals
APPSWE/PS1ΔE9 transgenic mice [30] on a C57BL/6
background were sourced from JAX. (B6.Cg-Tg(APPs-we,PSEN1dE9)85Dbo/Mmjax, JAX ID: 005864, https://
www.jax.org/strain/005864). IFNAR1−/− mice on a
C57Bl/6 background were initially generated by [28].
APPSWE/PS1ΔE9 transgenic mice lacking IFNAR1 were
generated by interbreeding. APPSWE/PS1ΔE9 and
IFNAR1−/−mice to produce F1 progeny. APPSWE/PS1ΔE9
x IFNAR1+/−mice from F1 progeny were then interbred
to yield APPSWE/PS1ΔE9x IFNAR1−/−mice (F2 progeny).
In all animal experiments, mice were used at 9 months of age with aged-matched littermate non-transgenic
wildtype and IFNAR1−/− control mice. All mice were
determined as specific pathogen-free, housed in sterile micro-isolator cages and fed ad-libitum on standard chow with open access to water. All animal procedures were performed in accordance with the University of Melbourne animal care committee’s regulations.
Animal genotyping
All animals used in this study were analysed for correct genotypes before use. This genotyping was either per-formed manually (Additional file 1: Figure S1), as
described below, or in partnership with Transnetyx™
(Cordova, TN, USA).
PCR products were then loaded into a 2 % w/v agarose
Et-Br-labelled (40 μg/ml) gel and electrophoresis was
performed to separate bands. A pre-stained BenchTop 100 bp DNA ladder (G8291, Promega) was used to de-termine sample band sizes upon gel imaging using the
ChemiDoc™ MP image system (Biorad). Specific
oligo-nucleotide primers used for amplification of APPSWE, PS1ΔE9, IFNAR1 and internal control DNA sequences
are detailed below:
In vivo study structure
The number of mice used in this study were as follows:
Wildtype: 15; IFNAR1−/−: 18; APPSWE/PS1ΔE9; APPSWE/
PS1ΔE9x IFNAR1−/−: 9. Both male and female mice were
used in the study in 50:50 proportion. No significant sex difference was detected in behavior and/or biochemical readouts and thus sexes were pooled. All mice were sub-jected to Morris water testing then 9 mice from each geno-type were randomly selected for biochemical processing. Half hemispheres were taken for immunohistochemistry,
whilst the other half was snap frozen and ground on liquid nitrogen in order to isolate both protein and RNA from the same mice.
Mixed cortical and hippocampal glial isolation
Mixed cortical and hippocampal neurons were isolated from embryonic P0-1 embryos as previously described [35]. Briefly, cortices were isolated and meninges surgi-cally removed. The cleaned cortical tissue was then digested in hanks buffered sulphate solution (HBSS, 14025–092, Gibco) using trypsin/DNAse (1 mg/ml, T9201, D5025, Sigma) until a single cell suspension was achieved. Cells were then plated at a density of 1 brain/ 10 ml in culture medium (DMEM, 31985–062, Gibco,
20 % FBS, 0.5 % penicillin-streptomycin) in T75cm2
flasks. Media was then replaced every two days until the glial cultures formed a comprehensive monolayer. Cells
were seeded at 5 x 10⁵ cells/ml for experimental use
between 14 and 28 days in vitro.
Mixed cortical and hippocampal neuron isolation
Mixed cortical and hippocampal neurons were isolated as described previously [63]. Briefly, cortices were iso-lated from embryonic day 14–16 pups and meninges were removed. Cleaned cortices were then digested in
Krebs solution containing trypsin (250 μg/ml) and
DNAse (33μg/ml) and mechanically agitated to ensure a
single cell suspension. Cells were then plated into pre-coated Poly-L-lysine (0.5 mg/ml, P6282, sigma) plastic
ware at a density of 1 x 10⁶cells/ml in neurobasal media
(17504–044, Gibco) containing B-27 growth factor
sup-plement (17504–044, Gibco), L-glutamine (500 μM,
G7513, Sigma) and 2 % FBS. The following day, FBS was removed from the media and cultures were supple-mented with fresh culture media every two days until experimental use. Neuronal purity was assessed at >90 % using NeuN (neuronal nuclei) immunohistochemistry (data not shown) and all cultures were used day 9–10 in vitro.
Cardiac perfusion of mice and isolation of brain tissue
Mice were deeply anaesthetized using intra-peritoneal injection of combinatorial ketamine (90 mg/kg) and xylazine (4.5 mg/kg, K113, Sigma). Mice were cardiac perfused with ice-cold heparinized PBS (1U/ml, H3393, Sigma). Brains were then excised and separated for use in immunohistochemistry or for RNA/protein biochem-ical analysis. Isolation of the cortex for RNA/protein bio-chemistry was performed using a modified dissection technique [24]. Hemispheres were placed on an ice cold glass dissection plate and orientated in a sagittal plane. The cerebellum was removed, and the striatum, thalamus, midbrain and brain stem remnants were identified. These structures were then removed using sterilized blunt
Step # Temperature (°C) Time (seconds) Comments
1 94 180
2 94 30 X35 repeats
3 54 60
4 72 60
5 72 120
6 4 ∞ Holding temperature
Primer name Direction (5’→3’)
Sequence (5’→3’) Reaction concentration
oIMR3610 (APP)
Forward AGG ACT GAC CAC TCG ACC AG
1μM
oIMR3611 (APP)
Reverse CGG GGG TCT AGT TCT GCA T
1μM
oIMR1644 (PS1)
Forward AAT AGA GAA CGG CAG GAG CA
1.33μM
oIMR1645 (PS1)
Reverse GCC ATG AGG GCA CTA ATC AT
1.33μM
oIMR7338 (Control)
Forward CTA GGC CAC AGA ATT GAA AGA TCT
0.5μM
oIMR7339 (Control)
Reverse GTA GGT GGA AAT TCT AGC ATC ATC C
0.5μM
mIFNAR1E4F (IFNAR1)
Forward CTC CTC CCG GAC AAG ACG GG
1μM
mIFNAR1E5R (IFNAR1)
Reverse TGG TGC TTA TAC ACT GCA CAG TGC T
1μM
NeoF (neomycin)
Forward GAG GCA GCG CGG CTA TCG TG
spatulas, exposing the hippocampal complex and interior wall of the cortex. The hippocampus was then peeled away from the cortex, and cortical tissue was snap frozen
in liquid nitrogen and stored at−80 °C until required.
Immunohistochemistry
For immunohistochemical analysis, hemispheres were post-fixed in 4 % w/v paraformaldehyde in PBS for 72 h (4 °C) before being transferred into 30 % w/v sucrose in PBS for 48 h (4 °C) and embedded in Optimal Cutting Temperature (OCT, 4583, Sakura) medium for
subse-quent cryosectioning. Sagittal sections (30 μm) were
then cut throughout the hippocampal region using a cryostat (Reichert-Jung) and mounted onto electrostatic Menzel-Gläser Superfrost® plus glass microscopy slides (J1800AMNZ, Thermo-Scientific). Tissue was then permeabilized in PBS-T (0.05 % v/v Tween-20, 5 min,
room temperature) and blocked in CAS-Block™ (1 h,
room temperature, 008120, Invitrogen). After rinsing with PBS, tissue was then incubated overnight with
pri-mary antibody diluted in 10 % v/v CAS-Block™ in PBS
(4 °C, humidified chamber). After washing in PBS, slides were then incubated with fluorescent secondary
anti-bodies diluted in 10 % v/v CAS-Block™ in PBS (2 h,
room temperature). Post-PBS rinse coverslips were mounted in Vectashield® DAPI-containing mounting media (H-1200, Vector laboratories). Images were then obtained using a Zeiss Axio Observer.Z1 (Carl Zeiss im-aging) inverted fluorescence microscope. Details of anti-bodies used for immunohistochemistry are provided below:
To quantify plaque number and burden, WO-2 immunofluorescent labelled sections were converted to 8-Bit images and an image fluorescence threshold was set using Image J quantification software (NIH). Plaque staining was then analysed by particle quantification giv-ing plaque number. The WO-2 positive pixel coverage value was then expressed relative to total cortical area to calculate cortical plaque burden. For IBA-1 and GFAP immunofluorescence quantification, integrated densities were calculated from entire cortical regions using Image
J quantification software (National Institutes of Health, NIH). These values were then normalized to staining background and expressed as relative fluorescence inten-sity as described previously [32]. All quantified data is
from average values generated from ≥3 sections/mouse
(each 270μm apart or every 6th section).
Amyloid beta preparation and cell culture treatment
Amyloid peptide stocks were prepared according to
methods described previously [2]. Aβ1-42 stocks
(A-42-T-1, GenecBio) were initially monomerized in 1, 1, 1, 3, 3, 3-Hexafluoro-2-propanol (0.5 mg/ml, HFIP, 52512,
Fluka), lyophilized and stored at −80 °C until required.
The peptide was then dissolved in ice cold 5 mM NaOH in Dulbecco’s PBS by rigorous vortexing and protein concentration was determined by absorbance spectro-photometry at 214 nm. Peptide concentrations were calculated using Eq. 1.
Aβ42
½ ¼ Abs214x DFð =εÞ ð1Þ
Where Abs214= Absorbance value of sample at 214 nm,
DF = Sample dilution factor, ε= molar extinction
coeffi-cient of Aβ42 (75,887 L/mol/cm).
Primary cultured glial cells were treated with 10 μM
Aβ1-42 or NaOH vehicle for up to 96 h in
serum-reduced glial treatment medium (DMEM with 2 % FBS and 0.5 % penicillin-streptomycin). The final concentra-tion of NaOH across all treatment groups was <5nM and remained non-toxic.
Protein extraction
Following treatment, primary glial cell cultures were washed in ice cold PBS and collected via cell scraping. Cell pellets were briefly sonicated in Tris lysis buffer (50 mM Tris, 150 mM NaCl, 1 % v/v Triton x-100 (T8787, Sigma), 1 % w/v SDS, PhosphoSTOP® phosphat-ase and cOmplete® protephosphat-ase inhibitors (04906837001, 11697498001, Roche), pH 7.4). Brain tissue was
homoge-nized in Tris lysis buffer (≤100 mg/ml concentration,
without 1%w/v SDS). Upon rotation for 90 min at 4 °C, homogenates were centrifuged (12,000xg, 4 °C, 5 min)
before supernatants were removed and stored at−80 °C
until required. Protein concentrations were determined as per the method of Bradford ([5], 500–0006, Bio-Rad).
SDS-PAGE gel electrophoresis and Western blotting
Fifty micrograms of protein was denatured in reducing buffer (20 mM Tris, 20%v/v glycerol, 4%w/v SDS, 10 %
β-mecaptoethanol (M6250, Sigma), and bromophenol
blue). Samples were loaded onto 10 % SDS-PAGE gels (60 mM Tris, 0.1 % w/v SDS, 0.1 % w/v APS, 0.01 % v/v TEMED, 10 % Acrylamide/Bis (161–0156, Bio-Rad)) or
4-20 % Mini-PROTEAN® TGX Stain-Free™ gels (456–
Antibody Supplier Source Dilution
GFAP Dako (Z0334) Rabbit pAb 1:1000
IBA-1 Wako (019–19741) Rabbit pAb 1:300
WO-2 (Wun et al., 2008 [68]) Mouse mAb IgG1
1:500
Alexa Fluor® 488 Goat anti-rabbit
Molecular probes (A-11008)
Goat pAb 1:1000
Alexa Fluor® 594 Goat anti-mouse
Molecular probes (A-11005)
8093, Bio-Rad) and electrophoresis was performed at 120 V in Novex® Tris-Glycine SDS running buffer (LC2675-5, Invitrogen). Proteins were then transferred to polyvinylidene fluoride (PVDF) membranes by semi-dry transfer (60 mA/gel, 1.25 h) or using the TransBlot®
Turbo™ transfer system (2.5MA, 7 min, 170–4155,
Bio-Rad) as per manufacturer’s instructions. Membranes were blocked in 5%w/v skim milk powder in Tris buff-ered saline-Tween 20 (0.05 % v/v Tween-20, TBS-T) for 1 h before overnight incubation with primary antibodies at 4 °C (dilutions in 2 % w/v skim milk powder in TBS-T). Membranes were then washed in TBS-T before being in-cubated with horseradish peroxidase (HRP)-conjugated secondary antibodies (dilutions in 2 % w/v skim milk pow-der in TBS-T) for 90 min at room temperature. HRP sig-nals were detected using an enhanced chemiluminescence
(ECL™) prime Western blotting detection kit (RPN2232,
Amersham) and visualized using the ChemiDoc™ MP
system (Bio-Rad). For densitometry analysis, all raw pixel intensities of HRP signals from Western blots were calcu-lated using Image J quantification software (NIH). Details of antibodies used for Western blotting are provided below:
Aβ1:40 sandwich Enzyme-linked immunosorbent assay (ELISA)
For quantification of soluble and insoluble Aβlevels,
tis-sues were homogenized in PBS (containing Triton x-100, 1 % v/v, PBS-T) containing PhosphoSTOP® phosphatase
and cOmplete® protease inhibitors (04906837001,
11697498001, Roche), pH 7.4) via sonication. After centri-fugation (100,000xg, 60 min, 4 °C) the supernatant was
collected to detect PBS-T-soluble Aβ1:40 levels. The
remaining tissue pellets were further homogenized in 70 % v/v formic acid in PBS, centrifuged (100,000xg, 60 min, 4 °C) and the resulting supernatant was
neutralized with 1 M Tris base (20x volume) and collected
to detect PBS-T-insoluble Aβ1:40 levels by sandwich
ELISA.
Assays were run in 96-well plate format with all stan-dards and samples run in duplicate reactions. ELISA plates were coated in WO-2 capture antibody (diluted in 0.05 M carbonate-bicarbonate, pH 9.6) overnight and blocked in 1 % BSA (diluted in TBS-T) prior to sample
incubation (100 μg protein/well, 4 °C, overnight
incuba-tion with shaking). Plates were then washed in TBS-T
and incubated with an anti-Aβ1:40 casein-1E8
biotinyl-ated monoclonal sandwich detection antibody. After washing in TBS-T plates were incubated with high sensi-tivity Streptavidin-HRP and signals were developed using TMB substrate and detection at 450 nm. Sample
ab-sorbance were normalized to the Aβ1:40 standard
curve and concentrations are expressed relative to sample total protein concentrations as determined by Bradford assay.
RNA isolation and cDNA synthesis
RNA was extracted from cell pellets or brain tissue by methods previously described [12] using TRIzol® reagent (15596018, Life-Technologies). Contaminating genomic DNA was then removed prior to reverse transcription
using the TURBO DNA-free™kit (AM1907, Ambion)
ac-cording to manufacturer’s guidelines. Yield quantities and purity of the RNA product was then assessed using the nanodrop 1000 spectrophotometer (Thermo Scientific). One microgram of RNA was then reverse transcribed to produce cDNA using a high capacity cDNA reverse transcription kit (4368814, Applied Biosciences) as per manufacturer’s instructions and cDNA was then diluted 1:3 in diethylpyrocarbonate (DEPC)-treated dH2O for use in QPCR.
Quantitative PCR
All QPCR was performed in standard 384-well plates (4309849, Applied Biosystems) using the 7900ht fast real-time PCR system (Applied Biosystems) and reac-tions for a given sample were performed in triplicate. All Taqman gene expression assays were purchased commercially (431182, Applied Biosystems) and reac-tions were performed under the following thermal conditions:
Antibody Supplier Source WB
dilution
p-Stat-3 (Y705) Cell Signaling (9145) Rabbit mAb IgG1
1:1000
Stat-3 Cell Signaling (9132) Rabbit pAb 1:1000
WO-2 [68] Mouse mAb
IgG1
1:2000
p-NFkB (p65, S536)
Cell Signaling (3033) Rabbit mAb IgG1
1:1000
SOCS3 Abcam (ab723) Goat pAb 1:200
β-actin Sigma-Aldrich (A5441)
Mouse mAb IgG1
1:4000
Gα-rabbit/HRP Dako (P0448) Goat pAb-HRP 1:1000
Gα-mouse/HRP Dako (P0447) Goat pAb-HRP 1:1000
Step # Temperature (°C) Time (minutes) Comments
1 50 2
-2 94.5 10
-3 97 0.5 X40 repeats
For SYBR® green-based detection, gene-specific primers were synthesized commercially (Geneworks) and reactions were performed under the following thermal conditions:
Fold change readouts presented throughout the study
were calculated using theΔΔct calculation method [36].
For each experiment a fluorescence detection threshold was automatically set at 1.0 RFU and the cycle number at which each reaction reached this threshold was calcu-lated (cycle threshold (Ct)). Triplicate Ct value for genes of interest were then normalized back to the Ct values of the GAPDH housekeeping gene to account for differ-ences in original cDNA concentration between samples
(ΔCt). The calculated ΔCt of treatment or genotype
groups were then normalized back to the ΔCt of
appropriate genotype-specific control samples. In
addition, ΔΔCt values were converted to fold change
data using Eq. 2.
Fold change ¼ 2ð−ΔΔctÞ ð2Þ
Primers used for QPCR analysis are listed below:
MTS cell viability assay
Cell viability was measured by the ability to metabolize 3-(4,5-dimethylthiazol-2-yl)-5-(3-carboxymethoxyphenyl)-2-(4-sulfophenyl)-2H-tetrazolium (MTS, CellTiter 96®
AQueous non-radioactive cell proliferation assay, G5421,
Promega) in the presence of the electron coupler phena-zine methosulfate (PMS) to a media soluble formazan product, as described previously [9]. Combined MTS
(400μg/ml) and PMS (44μg/ml) solution was incubated
on primary cultured neurons for 4 h (37 °C). Culture medium absorbance at 492 nm was then determined using a Multiskan Ascent spectrophotometer (Thermo Scien-tific). All sample absorbance readings were then blank normalized using a negative control reaction containing only culture medium and the MTS/PMS reagent. Absorb-ance readings of all treatment groups were then normal-ized back to genotype-specific vehicle controls and expressed as a percentage of vehicle control cell viability. Experiments were performed in technical triplicate and
staurosporine (1 μM, S6942, Sigma) was used to induce
cellular apoptosis in primary neuronal cultures for positive control means.
Morris water maze
Morris water maze (MWM) testing was conducted in a black circular pool 1.6 m in diameter and 0.8 m deep. A
Step # Temperature (°C) Time (minutes) Comments
1 95 20
-2 95 0.5 X40 repeats
3 60 1.5
4 95 15
-5 60 15
-6 95 15
-Gene Species Inventory number
GAPDH Mouse Mm99999915_m1
IFNβ Mouse Mm00439552_s1
IRF7 Mouse Mm00516788_m1
IRF3 Mouse Mm00516779_m1
IRF8 Mouse Mm00492567_m1
IL-1β Mouse Mm01336189_m1
IL-6 Mouse Mm00446190_m1
TNFα Mouse Mm00443258_m1
CD33 Mouse Mm00491152_m1
TREM2 Mouse Mm04209422_m1
Gene Direction (5’→3’) Sequence (5’→3’)
GAPDH Forward ATCTTCTTGTGCAGTGCCAGC
Reverse ACTCCACGACATACTCAGCACC
IFNα Forward GCAATCCTCCTAGACTCACTTCTGCA
Reverse TATAGTTCCTCACAGCCAGCAG
IFNαE4 Reverse TATTTCTTCATAGCCAGCTG
iNOS Forward CAAGCACCTTGGAAGAGGAG
Reverse AAGGCCAAACACAGCATACC
CD32 Forward AATCCTGCCGTTCCTACTGATC
Reverse GTGTCACCGTGTCTTCCTTGAG
CD11b Forward CCAAGACGATCTCAGCATCA
Reverse TTCTGGCTTGCTGAATCCTT
CD206 Forward CAAGGAAGGTTGGCATTTGT
Reverse CCTTTCAGTCCTTTGCAAGC
ARG1 Forward TCACCTGAGCTTTGATGTCG
Reverse CTGAAAGGAGCCCTGTCTTG
CCL22 Forward CTGATGCAGGTCCCTATGGT
Reverse GCAGGATTTTGAGGTCCAGA
TGFβ Forward TGCGCTTGCAGAGATTAAAA
Reverse CGTCAAAAGACAGCCACTCA
YM1 Forward CAGGGTAATGAGTGGGTTGG
white Perspex 10 cm2circular platform was then secured to the enclosure 25 cm from the pool wall. The pool was then filled with water at 21–23 °C until the white plat-form was submerged 1 cm below the surface. Non-toxic, water soluble white ceiling paint (Taubmans) was then used to opacify the water. The room was brightly illumi-nated using wall-mounted halogen lamps. Several dis-tinct and distal extra-maze cues were placed around the pool as points of reference. These cues remained in place throughout the duration of testing and the plat-form was only removed to conduct the probe trial.
Mice were subjected to a 4 trial/day protocol for 7 days with 60 s maximum trial duration. Mice were removed from their test cage and placed into the water maze, at a randomized cardinal point, facing towards the pool wall. The 60 s trial commenced after the mouse had entered the MWM for 2 s. If the test mouse found, mounted and stayed on the hidden platform for 2 s the trial was deemed complete and latency to reach the platform was calculated. The mouse remained on the hidden platform for 20 s before being removed from the water maze and placed back in their testing cage. If the mouse failed to find or remain on the platform for at least two seconds before the 60 s time allowance, the researcher entered the testing area and guided the mouse to the hidden platform. Once an individual mouse completed the trial and was towel dried, the next mouse within the testing group was immediately placed into the MWM for test-ing. Each mouse underwent 4 trials per day, according to the aforementioned trial parameters and had an inter-trial resting time of 10 min. All MWM testing was recorded to DVD and automatically tracked using Ethovision® XT (Noldus). For all individual trials, latency to platform, success rate, path length and swim speed was calculated. A 60 s value for latency was awarded for all tri-als where the test mouse failed to find the platform within the allocated time.
To assess spatial reference memory, a probe trial was conducted on day 7 of MWM acquisition. Mice were placed into the maze at the north cardinal point and allowed to explore for the standard 60 s trial length with the escape platform removed. The maze was virtually di-vided up into quadrants and time spent in the quadrant which previously held the platform was calculated. All primary readouts reported from MWM testing conducted in this study are well-established in the AD field [7].
Statistical analysis
GraphPad Prism software (version 6.0, http://
www.graphpad.com/scientific-software/prism/) was used
for all t-tests, ANOVAs and post-hoc statistical
evalu-ation. Where comparisons of multiple groups was re-quired a one or two-way analysis of variance (ANOVA) was performed, with mouse genotype as the fixed
variable. A Bonferroni post-hoc or Tukey’s HSD multiple comparisons test was then performed. Otherwise an
unpaired two-tailed Student’s t-test was used. For all
statistical tests a two-tailed α value of 0.05 was utilized.
Box plots were used to display data in which the midline represents the median value and the upper and lower margins equate to the 25 % and 75 % quartiles. The whiskers display data within the 1.5xinterquartile range and values beyond this were determined as outliers (rep-resented as circles). All other numerical data is pre-sented as mean ± SEM. Power values for each test where calculated post-hoc using G*Power (version 3.1, http:// gpower.hhu.de/), based upon the effect size, group num-ber and sample size. Exact p-values were calculated for
all Student’s t-tests and multiplicity adjusted p-values
were determined for all Bonferroni’s and Tukey’s
post-hoc tests. A p-value <0.05 was considered statistically significant. All use of statistics is detailed in Additional file 2: Table S1.
Results
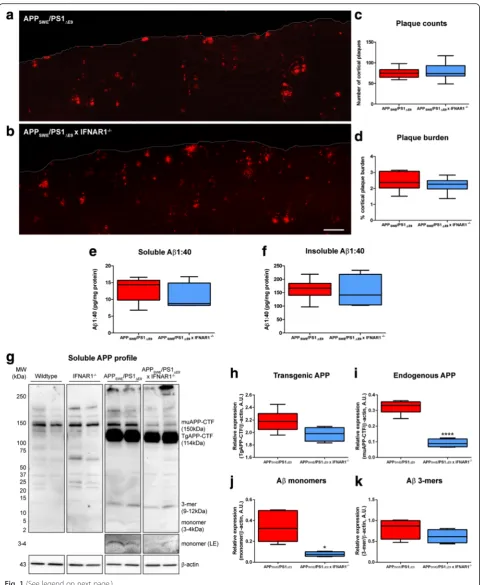
Removal of IFNAR1 in APPSWE/PS1ΔE9mice confers modest reductions in cortical Aβmonomer load but plaque burden remains unaltered
To investigate the effect of removing type-1 IFN
signal-ing in AD we generated APPSWE/PS1ΔE9 x IFNAR1−/−.
APPSWE/PS1ΔE9 mice aged 9 months display an
en-hanced type-1 IFN and pro-inflammatory cytokine re-sponse [64]. Hence, we focused on characterizing
phenotypic alterations in APPSWE/PS1ΔE9 x IFNAR1−/−
mice at this age. With variable hippocampal Aβplaque
deposition at this age in both APPSWE/PS1ΔE9 and
APPSWE/PS1ΔE9 x IFNAR1−/− mice (data not shown),
the current study focused on cortical regions only, not
hippocampus. To assess potential alterations in Aβ
plaque burden, immunohistochemistry was performed
on APPSWE/PS1ΔE9 and APPSWE/PS1ΔE9 x IFNAR1−/−
mouse brain sagittal sections, stained with anti-AβmAb
WO-2 (n= 9 per genotype, Fig. 1a, b). Both APPSWE/
PS1ΔE9 and APPSWE/PS1ΔE9 x IFNAR1−/− mice display
extensive plaque deposition within cortical regions but
no difference was detected between genotypes when Aβ
plaques were counted (n= 9 per genotype, Fig. 1c) or
when cortical plaque burden percentage was quantified
(n= 9 per genotype, Fig. 1d). To validate these
immuno-histochemical findings we prepared PBS-T-soluble and PBS-T-insoluble fractions from cortical tissue to quantify
Aβlevels by ELISA. We did not observe any differences
in PBS-T-soluble or PBS-T-insoluble Aβ1:40 levels
mea-sured from cortical tissue lysates of APPSWE/PS1ΔE9and
APPSWE/PS1ΔE9 x IFNAR1−/− mice (n= 4–6 per
geno-type, Fig. 1e, d). These findings suggest that removal of
type-1 IFN signaling in APPSWE/PS1ΔE9 mice does not
Whilst amyloid plaque levels remained unchanged in the
APPSWE/PS1ΔE9 IFNAR1−/− mouse, the oligomerization
state of soluble Aβspecies may be altered. This can
influ-ence peptide toxicity and potentially impact cognitive phe-notypes [1, 15, 44]. To investigate the oligomerization state
of various Aβspecies, we analyzed Tris–HCl soluble
cor-tical fractionations from wildtype, IFNAR1−/−, APPSWE/
PS1ΔE9and APPSWE/PS1ΔE9x IFNAR1−/−mice by western
blotting, probed with anti-Aβ mAb WO-2 (n= 4–6 per
genotype, Fig. 1g). Analysis of Aβ oligomers in wildtype
and IFNAR1−/−mice displayed constitutive Aβproduction
but not overexpression that is characteristic of the
APPSWE/PS1ΔE9transgene. Densitometry identified a trend,
albeit not statistically significant, to decreased transgenic
human APP-CTF expression (n= 4–6 per genotype, p =
0.0618, Fig. 1h) and significant reductions in endogenous
murine APP-CTF levels (n= 4–6 per genotype,p <0.0001,
Fig. 1i) in APPSWE/PS1ΔE9x IFNAR1−/−mice compared to
APPSWE/PS1ΔE9 mice. Densitometry confirmed a
signifi-cant 4.3 ± 0.2-fold decrease of cortical Aβmonomer levels
in APPSWE/PS1ΔE9 x IFNAR1−/− mice compared to
APPSWE/PS1ΔE9 mice (n= 4–6 per genotype, p =0.0122,
Fig. 1j). Although not statistically significant, Aβtrimer
(3-mer) levels also trended to a decrease in APPSWE/PS1ΔE9x
IFNAR1−/− mice compared to APPSWE/PS1ΔE9 mice (n=
4–6 per genotype, p =0.0569, Fig. 1k). Collectively, this
data highlights that removal of IFNAR1 in APPSWE/PS1ΔE9
mice does not influence Aβplaque deposition, but may
in-fluence oligomerization through modest, but significant,
reductions in Aβmonomer levels.
Spatial learning and memory defects in APPSWE/PS1ΔE9 mice are improved upon removal of IFNAR1
To assess if removal of type-1 IFN signaling can alleviate
the cognitive deficits observed in APPSWE/PS1ΔE9we
an-alyzed spatial learning and memory performance of
wild-type, IFNAR1−/−, APPSWE/PS1ΔE9and APPSWE/PS1ΔE9x
IFNAR1−/− mice using the Morris water maze.
Com-pared to wildtype, APPSWE/PS1ΔE9 mice required more
time to find the escape platform, whilst APPSWE/PS1ΔE9
x IFNAR1−/− mice were initially impaired but recovered
to wildtype levels as pheno-copied by IFNAR1−/− mice
(n= 9–18 per genotype, 0.05 <p <0.001, Fig. 2a).
Com-pared to wildtype, an initial decline in trial success rate was seen for all genotypes but this was only maintained
by the APPSWE/PS1ΔE9mice over the course of
acquisi-tion (n= 9–18 per genotype, 0.05 <p <0.0001, Fig. 2b).
Compared to wildtype, all genotypes initially selected
longer escape paths but only APPSWE/PS1ΔE9 mice
maintained this abnormality throughout testing (n= 9–
18 per genotype,p <0.01, Fig. 2c). Representative tracks
(Day 7 acquisition) of APPSWE/PS1ΔE9 mice display a
lack of cue-directed swimming to find the platform,
par-tially rectified in the APPSWE/PS1ΔE9 IFNAR1−/−
coun-terparts. Wildtype and IFNAR1−/− behaved similarly
(Fig. 2d, Additional file 2: Table S1 for detailed analysis). After the 7 day acquisition period, the escape platform was removed from the maze and persistence of the mouse to escape was measured. Although not
statisti-cally significant, APPSWE/PS1ΔE9 x IFNAR1−/− mice
spent more time exploring the escape quadrant than
APPSWE/PS1ΔE9 mice (APPSWE/PS1ΔE9: 27.3 ± 3.8 % vs.
APPSWE/PS1ΔE9x IFNAR1−/−: 39.0 ± 7.7 %,n= 9–18 per
genotype, p =0.5111, Fig. 2e). Interestingly, IFNAR1−/−
mice spent a significantly greater amount of time in the
escape quadrant than APPSWE/PS1ΔE9mice (IFNAR1−/−:
45.6 ± 0.5 % vs. APPSWE/PS1ΔE9: 27.3 ± 3.8 %, n= 9–18
per genotype, p =0.0488, Fig. 2e). As swimming ability
can represent a potential confounding factor in the Mor-ris water maze, average swim speed was measured.
APPSWE/PS1Δ9 mice swim at a significantly lower
vel-ocity than their wildtype counterparts (Wildtype: 18.5 ±
0.5 cm/s vs. APPSWE/PS1Δ9: 15.9 ± 0.4 cm/s, n= 9–18
per genotype,p =0.0025, Fig. 2f ); however this difference
at a physiological level is minor and observed swimming technique remained consistent amongst genotypes. Collectively, this data implicates that removal of type-1
IFN signaling in APPSWE/PS1ΔE9 mice rescues spatial
(See figure on previous page.)
Fig. 1Removal of IFNAR1 in APPSWE/PS1ΔE9mice confers modest reductions in Aβmonomer levels but not plaque burden. Representative
cortical sections from 9 month oldaAPPSWE/PS1ΔE9andbAPPSWE/PS1ΔE9x IFNAR1−
/−mice stained with anti-AβmAb WO-2 using fluorescence immunohistochemistry (scale bar = 200μm).cAβplaques were counted from entire cortical regions of APPSWE/PS1ΔE9and APPSWE/PS1ΔE9x
IFNAR1−/−mice (3 sections per mouse,•represents outlier value).dCortical plaque burden was calculated by quantifying Aβplaque immunofluorescence relative to total cortical area from these same cortical slices of APPSWE/PS1ΔE9and APPSWE/PS1ΔE9x IFNAR1−
/−mice.ePBS-T-soluble andfPBS-T-insoluble Aβ1:40 levels in APPSWE/PS1ΔE9and APPSWE/PS1ΔE9x IFNAR1−
/−mouse cortical lysates were quantified by ELISA.gRepresentative immunoblot of Tris–HCl soluble cortical protein lysates isolated from 9 month old wildtype, IFNAR1−/−, APPSWE/PS1ΔE9and APPSWE/PS1ΔE9x IFNAR1−
/−mice using the anti-AβmAb WO-2. Multiple amyloid species can be detected including endogenous APP-CTF (muAPP-CTF), transgenic APP-CTF (TgAPP-CTF), Aβ trimers (3-mer) and Aβ monomers. A long exposure (LE) was used to enhance detection of Aβ monomer levels. Densitometry ofh Transgenic APP-CTF,iendogenous murine APP-CTF,jAβmonomer andk3-mer levels in APPSWE/PS1ΔE9and APPSWE/PS1ΔE9x IFNAR1−
/−mice is shown. All densitometry is expressed as a ratio of Aβmonomer:β-actin or Aβtrimer:β-actin raw pixel intensities. Immuno-detection ofβ-actin was used to ascertain loading quantities. Data is presented as box plots described in the statistical analysis section in Materials and Methods (immunohistochemistry:n= 9 per genotype; ELISA and Western blotting:n= 6 (APPSWE/PS1ΔE9),n= 4 (APPSWE/PS1ΔE9x IFNAR1−
learning and memory deficits assessed using the Morris water maze.
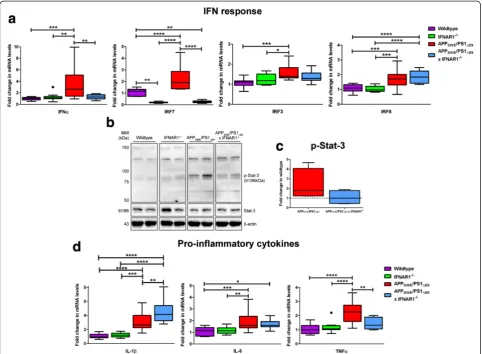
The type-1 IFN and pro-inflammatory cytokine response is attenuated in APPSWE/PS1ΔE9x IFNAR1−
/−mice
Previously it has been demonstrated that removal of IFNAR1 attenuates the type-1 IFN response to soluble
Aβ1-42 in primary cultured neurons and confers
neuro-protection [64]. To investigate alterations in the type-1
IFN response in APPSWE/PS1ΔE9 x IFNAR1−/− mice,
Q-PCR was performed on cortical tissue. Levels of IFNα
expression were significantly elevated in APPSWE/PS1ΔE9
mice compared to wildtype mice with this elevation
atten-uated in APPSWE/PS1ΔE9 x IFNAR1−/− mice (Wildtype:
Fig. 2APPSWE/PS1ΔE9x IFNAR1−/−mice are spared from cognitive impairment. Wildtype, IFNAR1−/−, APPSWE/PS1ΔE9and APPSWE/PS1ΔE9x IFNAR1−/−
littermate controls 9 months of age were subjected to Morris water maze testing to assess spatial learning and memory. All mice were tested using a 7-day hidden platform acquisition (4trials/day) with probe trial protocol as described in Materials and Methods. Primary water maze readouts ofa average trial latency,btrial success rate andctrial path length (*p <0.05, **p <0.01, ***p <0.001, ****p <0.0001, WT vs. APPSWE/PS1ΔE9;θp <0.05,θθp
<0.01,θθθp <0.001,θθθθp <0.0001, WT vs. APPSWE/PS1ΔE9x IFNAR1−/−; +p <0.05, ++p <0.01, +++p <0.001 WT vs. IFNAR1−/−).dRepresentative
automated tracks from day 7 testing is shown for all genotypes.eAfter day 7 acquisition the escape platform is removed from the maze and mice are introduced into the maze for a final trial. Quantification of the time spent in the platform containing quadrant for all genotypes is shown. The dashed line (y = 25 %) represents the percentage of time spent in the escape quadrant that would be solely due to random chance as opposed to preference (p <0.05).fCalculation of average swim velocity across all 7 days of testing is shown for all genotypes (**p <0.01). Data is displayed as mean ± SEM or box plots described in the statistical analysis section in Materials and Methods (n= 14 (APPSWE/PS1ΔE9),n= 9 (APPSWE/PS1ΔE9x IFNAR1−/−),n= 18
1.0 ± 0.08-fold vs. APPSWE/PS1ΔE9: 3.4 ± 0.8-fold, p =
0.0009; APPSWE/PS1ΔE9: 3.4 ± 0.8-fold vs. APPSWE/PS1ΔE9
x IFNAR1−/−: 1.3 ± 0.1-fold,p =0.0063,n= 9 per genotype,
Fig. 3a). This data confirms that aged APPSWE/PS1ΔE9
dis-play enhanced type-1 IFNα expression that is
IFNAR1-dependent. We also analyzed IFNβ transcript levels in
both wildtype and APPSWE/PS1ΔE9cortical tissue but were
unable to detect a difference between genotypes (n= 7 per
genotype, Additional file 3: Figure S2).
As IRF7 and IRF3 are critical mediators of IFNα [27]
and IFNβ [56] production respectively, mRNA levels
were also analyzed to assess the capacity for type-1 IFN
production in these mice. Levels of IRF7 expression were
significantly elevated in APPSWE/PS1ΔE9mice compared
to wildtype mice, implying elevated capacity for IFNα
production in these mice (Wildtype: 1.1 ± 0.08-fold vs.
APPSWE/PS1ΔE9: 2.2 ± 0.3-fold, p <0.0001, n= 9 per
genotype, Fig. 3a). This elevation in IRF7 was attenuated
in APPSWE/PS1ΔE9 x IFNAR1−/− mice (APPSWE/PS1ΔE9:
2.2 ± 0.3-fold vs. APPSWE/PS1ΔE9 x IFNAR1−/−: 0.3 ±
0.03-fold,p <0.0001, n= 9 per genotype, Fig. 3a).
Inter-estingly, IFNAR1−/− mice exhibit basal reductions in
IRF7 expression levels compared to wildtype mice
(Wildtype: 1.1 ± 0.08-fold vs. IFNAR1−/−: 0.2 ± 0.02-fold,
Fig. 3The type-1 IFN and pro-inflammatory cytokine response is attenuated upon removal of IFNAR1 in APPSWE/PS1ΔE9mice.aQ-PCR of cortical
tissue isolated from 9 month old wildtype, IFNAR1−/−, APP
SWE/PS1ΔE9and APPSWE/PS1ΔE9x IFNAR1−/−littermate controls analyzing IFNα, IRF7, IRF3
and IRF8 transcript levels.bRepresentative immunoblot of Tris–HCl soluble cortical protein lysates isolated from 9 month old wildtype, IFNAR1−/−, APPSWE/PS1ΔE9and APPSWE/PS1ΔE9x IFNAR1−/−mice using anti-p-Stat-3.cDensitometry of cortical p-Stat-3 levels in APPSWE/PS1ΔE9and APPSWE/
PS1ΔE9x IFNAR1−/−mice is shown.dQ-PCR of cortical tissue isolated from 9 month old wildtype, IFNAR1−/−, APPSWE/PS1ΔE9and APPSWE/PS1ΔE9x
IFNAR1−/−littermate controls analyzing IL-1β, IL-6 and TNFαtranscript levels. For Q-PCR, all samples were normalized back to the Ct value of the housekeeping gene GAPDH (ΔCt). The mRNA of the variant genotype groups were then expressed relative to their gene-specific wildtype litter-mate controls (fold change,ΔΔCt). For densitometry, total Stat-3 levels were normalized to theβ-actin loading control and p-Stat-3 intensity was calculated relative to this value (p-Stat-3/(Stat-3/β-actin). Intensity values of the APPSWE/PS1ΔE9and APPSWE/PS1ΔE9x IFNAR1−/−mouse groups are
p =0.0019,n= 9 per genotype, Fig. 3a). Expression levels
of IRF3 were significantly elevated in APPSWE/PS1ΔE9
mice compared to wildtype mice (Wildtype: 1.1 ±
0.06-fold vs. APPSWE/PS1ΔE9: 1.5 ± 0.1-fold, p =0.0004, n= 9
per genotype, Fig. 3a). However no alteration was
de-tected when IRF3 levels in APPSWE/PS1ΔE9 mice were
compared to APPSWE/PS1ΔE9 x IFNAR1−/−, implying
that signaling through IFNAR1 does not regulate IRF3
expression in these mice (APPSWE/PS1ΔE9: 1.5 ± 0.1-fold
vs. APPSWE/PS1ΔE9 x IFNAR1−/−: 1.4 ± 0.09-fold, p =
0.4369, n= 9 per genotype, Fig. 3a). We also analyzed
transcript levels of IRF8, a type-1 IFN-regulated medi-ator important in microglial activation and phenotype [40]. Levels of IRF8 expression were significantly
ele-vated in APPSWE/PS1ΔE9 mice compared to wildtype
mice (Wildtype: 1.1 ± 0.07-fold vs. APPSWE/PS1ΔE9: 1.7
± 0.2-fold, p =0.0009, n= 9 per genotype, Fig. 3a) and
this elevation was maintained in APPSWE/PS1ΔE9 x
IFNAR1−/− mice (APPSWE/PS1ΔE9: 1.7 ± 0.2-fold vs.
APPSWE/PS1ΔE9 x IFNAR1−/−: 1.9 ± 0.1-fold, p =0.3845,
n= 9 per genotype, Fig. 3a).
Considering type-1 IFNs signal via the JAK-Stat cas-cade and induce pro-inflammatory cytokine transcrip-tion, phosphorylation of Stat-3 was analyzed as a reporter of net type-1 IFN signaling in the APPSWE/
PS1ΔE9 x IFNAR1−/− mice. Western blotting confirmed
elevated phosphorylation of Stat-3 in APPSWE/PS1ΔE9
mice compared to both wildtype and IFNAR1−/− mice
(n= 4 per genotype, Fig. 3b). Densitometry of these blots
identified a trend for decreased Stat-3 activation in
APPSWE/PS1ΔE9 x IFNAR1−/− mice compared to
APPSWE/PS1ΔE9 mice (APPSWE/PS1ΔE9: 2.4 ± 0.8-fold vs.
APPSWE/PS1ΔE9 x IFNAR1−/−: 1.1 ± 0.4-fold, p =0.1955,
n= 4 per genotype Fig. 3c). Collectively, these data highlight
that removal of IFNAR1 attenuates the type-1 IFN response
in aged APPSWE/PS1ΔE9 mice, correlating with cognitive
benefits and modest reductions in Aβmonomer load.
Type-1 IFNs are master regulators of the innate im-mune response, regulating pro-inflammatory cytokine production [33]. To investigate if the removal of type-1 IFN signaling alters pro-inflammatory cytokine secretion
in APPSWE/PS1ΔE9mice, Q-PCR analyzing cortical tissue
was performed. IL-1βmRNA transcript levels were
up-regulated in the APPSWE/PS1ΔE9 mice compared
wild-type mice (Wildwild-type: 1.1 ± 0.09-fold vs. APPSWE/PS1ΔE9:
3.1 ± 0.4-fold, p <0.0001, n= 9 per genotype, Fig. 3d).
Interestingly, APPSWE/PS1ΔE9 x IFNAR1−/− mice
dis-played elevated IL-1β mRNA levels compared to
APPSWE/PS1ΔE9 mice alone (APPSWE/PS1ΔE9: 3.1 ±
0.4-fold vs. APPSWE/PS1ΔE9x IFNAR1−/−: 4.5 ± 0.5-fold, p =
0.0071, n= 9 per genotype, Fig. 3d). Whilst IL-6
expres-sion levels were significantly elevated in APPSWE/PS1ΔE9
mice when compared to wildtype mice, this response
was not significantly altered in APPSWE/PS1ΔE9 x
IFNAR1−/− mice (Wildtype: 1.1 ± 0.1-fold vs. APPSWE/
PS1ΔE9: 2.0 ± 0.2-fold, p =0.0005, n= 9 per genotype,
Fig. 3d). TNFαmRNA transcript levels were upregulated
in the APPSWE/PS1ΔE9 mice compared wildtype mice
(Wildtype: 1.0 ± 0.09-fold vs. APPSWE/PS1ΔE9: 2.2 ±
0.2-fold,p <0.0001,n= 9 per genotype, Fig. 3d) Significantly,
TNFα expression was reduced in the APPSWE/PS1ΔE9
IFNAR1−/− mice compared to APPSWE/PS1ΔE9
counter-parts (APPSWE/PS1ΔE9: 2.2 ± 0.2-fold vs. APPSWE/PS1ΔE9
x IFNAR1−/−: 1.4 ± 0.1-fold,p =0.0037,n= 9 per genotype,
Fig. 3d). These data suggest that type-1 IFN signaling through IFNAR1 is an important regulator of
pro-inflammatory cytokine expression in APPSWE/PS1ΔE9mice.
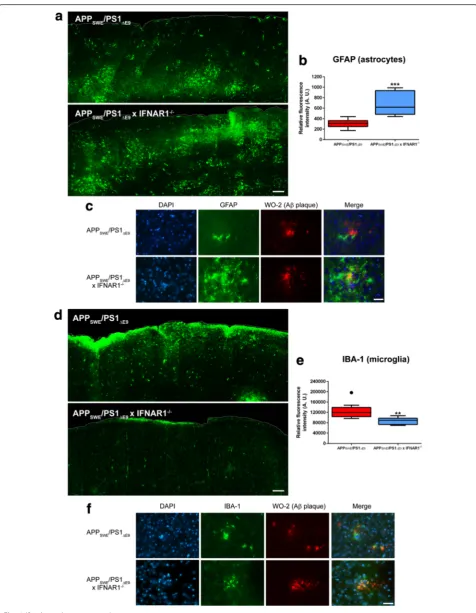
APPSWE/PS1ΔE9x IFNAR1−
/−mice exhibit enhanced
astrocyte reactivity but attenuated microgliosis surrounding amyloid deposition
Both microgliosis and astrocyte reactivity are important hallmarks of the neuro-inflammation evident in AD and are primary sources of inflammatory cytokine pro-duction [25]. To establish if removal of type-1 IFN
sig-naling alters astrocyte reactivity in APPSWE/PS1ΔE9mice,
immunohistochemistry was performed. Representative images and fluorescence quantification of sagittaly sec-tioned cortex revealed a significant 2.2 ± 0.3-fold increase
in GFAP reactivity in APPSWE/PS1ΔE9x IFNAR1−/− mice
compared to APPSWE/PS1ΔE9 counterparts (p =0.0006,
n= 9 per genotype, Fig. 4a, b). High power
magnifica-tion images demonstrate this elevated astrocyte
re-activity surrounds Aβ plaques, generating a localized
inflammatory environment (Fig. 4c). Collectively, this data highlights that removal of IFNAR1 triggers increased
astrocyte reactivity in cortical areas of Aβaccumulation in
APPSWE/PS1ΔE9mice. However, further investigation is
re-quired to conclude if this is a compensatory or direct effect
of removing type-1 IFN signaling in APPSWE/PS1ΔE9mice.
To assess if ablation of type-1 IFN signaling affects
microgliosis in APPSWE/PS1ΔE9 mice further
immuno-histochemistry was performed. Representative images and fluorescence quantification of sagittaly sectioned cortex revealed a significant 1.5 ± 0.09-fold decrease in
IBA-1 reactivity in APPSWE/PS1ΔE9 x IFNAR1−/− mice
compared to APPSWE/PS1ΔE9 counterparts (p =0.0032,
n= 9 per genotype, Fig. 4d, e). High power magnification
images demonstrate a hypertrophic and reactive
micro-glial phenotype surrounding Aβplaques in the APPSWE/
PS1ΔE9 mice. IBA-1 positive cells detected in APPSWE/
PS1ΔE9x IFNAR1−/− display decreased staining intensity
and remain embedded within plaque deposition,
adopt-ing a different morphology than cells in APPSWE/PS1ΔE9
mice (Fig. 4f ). These findings suggest that ablation of
type-1 IFN signaling in APPSWE/PS1ΔE9 mice attenuates
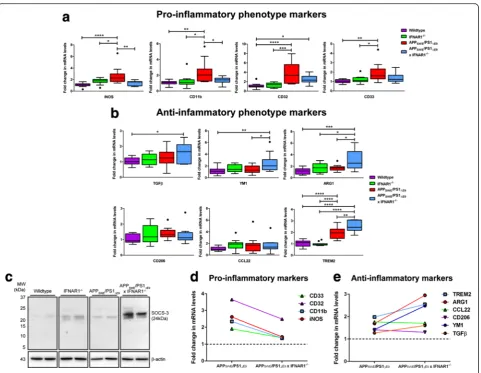
Removal of IFNAR1 shifts elevates expression of anti-inflammatory glial phenotypic markers in APPSWE/ PS1ΔE9 mice
It has been suggested that pro-inflammatory microglial phenotypes enhance are largely deleterious in AD whereas anti-inflammatory microglial activity can pro-mote beneficial inflammatory resolution [53]. We have shown that altered gliosis, decreased type-1 IFN re-sponses and altered pro-inflammatory cytokine secretion
is evident in APPSWE/PS1ΔE9x IFNAR1−/−mice, thus we
were interested in assessing expression of glial inflam-matory phenotypic markers. Cortical tissue from
wild-type, IFNAR1−/−, APPSWE/PS1ΔE9and APPSWE/PS1ΔE9x
IFNAR1−/− mice were analyzed by Q-PCR for pro- and
anti-inflammatory glial phenotype markers.
Elevation of iNOS pro-inflammatory marker
expres-sion was confirmed in APPSWE/PS1ΔE9 mice compared
to wildtype mice (Wildtype: 1.1 ± 0.1-fold vs. APPSWE/ PS1ΔE9: 2.6 ± 0.4-fold, p <0.0001, n= 9 per genotype,
Fig. 5a). Significantly, iNOS expression was decreased in
APPSWE/PS1ΔE9 x IFNAR1−/− mice compared to
APPSWE/PS1ΔE9 mice alone (APPSWE/PS1ΔE9: 2.6 ±
0.4-fold vs. APPSWE/PS1ΔE9x IFNAR1−/−: 1.4 ± 0.1-fold, p =
0.0053, n= 9 per genotype, Fig. 5a). Transcript levels of
the pro-inflammatory marker CD11b were elevated in
APPSWE/PS1ΔE9 mice compared to wildtype mice
(Wildtype: 1.0 ± 0.07-fold vs. APPSWE/PS1ΔE9: 2.4 ±
0.4-fold, p =0.0014,n= 9 per genotype, Fig. 5a). Similar to
the iNOS expression, CD11b transcript levels were
de-creased in APPSWE/PS1ΔE9 x IFNAR1−/− mice
com-pared to APPSWE/PS1ΔE9 mice alone (APPSWE/PS1ΔE9:
2.4 ± 0.4-fold vs. APPSWE/PS1ΔE9 x IFNAR1−/−: 1.4 ±
0.1-fold,p =0.0371,n= 9 per genotype, Fig. 5a).
Expres-sion of the CD32 pro-inflammatory marker was
ele-vated in APPSWE/PS1ΔE9 mice compared to wildtype,
however this elevation was not suppressed in APPSWE/
PS1ΔE9 x IFNAR1−/− mice (Wildtype: 1.1 ± 0.1-fold vs.
APPSWE/PS1ΔE9: 3.7 ± 0.6-fold, p <0.0001, n= 9 per
genotype, Fig. 5a). Indeed, CD32 levels in APPSWE/
PS1ΔE9 x IFNAR1−/− mice were elevated compared to
wildtype mice albeit not to the same levels as APPSWE/
PS1ΔE9 mice (Wildtype: 1.1 ± 0.1-fold vs. APPSWE/
PS1ΔE9x IFNAR1−/−: 2.5 ± 0.3-fold,p =0.0366,n= 9 per
genotype, Fig. 5a). Expression of the CD33
pro-inflammatory marker was elevated in APPSWE/PS1ΔE9
mice compared to wildtype, but this elevation was not
suppressed in APPSWE/PS1ΔE9 x IFNAR1−/− mice
(Wildtype: 1.0 ± 0.05-fold vs. APPSWE/PS1ΔE9: 1.9 ±
0.3-fold,p =0.0015,n= 9 per genotype, Fig. 5a).
Analysis of the anti-inflammatory marker TGFβ
re-vealed elevated expression levels in APPSWE/PS1ΔE9 x
IFNAR1−/− mice compared to wildtype mice (Wildtype:
1.0 ± 0.06-fold vs. APPSWE/PS1ΔE9 x IFNAR1−/−: 1.6 ±
0.2-fold, p =0.0189, n= 9 per genotype, Fig. 5b). This
elevation was not present in the APPSWE/PS1ΔE9cohort.
Transcript levels of the YM1 anti-inflammatory marker
were also elevated in APPSWE/PS1ΔE9x IFNAR1−/− mice
when compared to both wildtype and APPSWE/PS1ΔE9
mice (Wildtype: 1.2 ± 0.2-fold vs. APPSWE/PS1ΔE9 x
IFNAR1−/−: 2.5 ± 0.5-fold, p =0.0061; APPSWE/PS1ΔE9:
1.4 ± 0.2-fold vs. APPSWE/PS1ΔE9x IFNAR1−/−: 2.5 ±
0.5-fold,p =0.0490,n= 9 per genotype, Fig. 5b). ARG1
anti-inflammatory marker expression levels were elevated in
APPSWE/PS1ΔE9 x IFNAR1−/− mice when compared to
both wildtype and APPSWE/PS1ΔE9 cohorts (Wildtype:
1.2 ± 0.1-fold vs. APPSWE/PS1ΔE9x IFNAR1−/−: 3.0 ±
0.5-fold, p =0.0002; APPSWE/PS1ΔE9: 1.7 ± 0.2-fold vs.
APPSWE/PS1ΔE9 x IFNAR1−/−: 3.0 ± 0.5-fold, p =0.0141,
n= 9 per genotype, Fig. 5b). Expression levels of both
CD206 and CCL22 M2 markers remained constant
amongst all genotypes (n= 9 per genotype, Fig. 5b).
Transcript levels of the TREM2 anti-inflammatory
marker were elevated in APPSWE/PS1ΔE9 x IFNAR1−/−
mice when compared to both wildtype and APPSWE/
PS1ΔE9 mice (Wildtype: 1.0 ± 0.07-fold vs. APPSWE/
PS1ΔE9x IFNAR1−/−: 2.5 ± 0.2-fold, p <0.0001; APPSWE/
PS1ΔE9: 2.0 ± 0.1-fold vs. APPSWE/PS1ΔE9 x IFNAR1−/−:
2.5 ± 0.2-fold,p =0.0056,n= 9 per genotype, Fig. 5b). Of
interest is the finding that elevations in TREM2
expres-sion were not unique to the APPSWE/PS1ΔE9x IFNAR1
−/−
genotype but also observed in APPSWE/PS1ΔE9 mice
when compared to wildtype counterparts (Wildtype: 1.0
± 0.07-fold vs. APPSWE/PS1ΔE9: 2.0 ± 0.1-fold,p <0.0001,
n= 9 per genotype, Fig. 5b). Western blot analysis of the
anti-inflammatory marker SOCS-3, a negative regulator of type-1 IFN signaling and cytokine production [61,
(See figure on previous page.)
Fig. 4Astrocyte reactivity is elevated but microgliosis is dampened in APPSWE/PS1ΔE9x IFNAR1−
/−mice.aRepresentative cortical sections from 9 month old APPSWE/PS1ΔE9and APPSWE/PS1ΔE9x IFNAR1−
/−mice stained with anti-GFAP using fluorescence immunohistochemistry.bIntegrated density values of positive GFAP immunofluorescence were calculated from entire cortical regions of APPSWE/PS1ΔE9and APPSWE/PS1ΔE9x IFNAR1
−/−mice (3 sections per mouse).cHigh power magnification images of APP
SWE/PS1ΔE9and APPSWE/PS1ΔE9x IFNAR1−
/−mouse cortical sections triple-labelled with DAPI, anti-GFAP and anti-WO-2.dRepresentative cortical sections from 9 month old APPSWE/PS1ΔE9and APPSWE/PS1ΔE9x
IFNAR1−/−mice stained with anti-IBA-1 using fluorescence immunohistochemistry.eIntegrated density values of positive IBA-1 immunofluorescence were calculated from entire cortical regions of APPSWE/PS1ΔE9and APPSWE/PS1ΔE9x IFNAR1−
/−mice (3 sections per mouse).fHigh power magnification images of APPSWE/PS1ΔE9and APPSWE/PS1ΔE9x IFNAR1−
69], confirmed an up-regulation in APPSWE/PS1ΔE9 x
IFNAR1−/− mice compared to APPSWE/PS1ΔE9
counter-parts. This up-regulation was also confirmed in IFNAR1
−/−
mice alone when compared to wildtype mice (Fig. 5c).
From the summarized data depicting
pro-inflammatory (Fig. 5d) and anti-pro-inflammatory glial phenotypic marker expression (Fig. 5e), these findings implicate that removal of type-1 IFN signaling shifts the glial phenotype from a pro-inflammatory phenotype towards an anti-inflammatory and presumably
neuro-protective phenotype in APPSWE/PS1ΔE9mice.
Removal of IFNAR1 attenuates the type-1 IFN and pro-inflammatory cytokine response in response to Aβ1-42 in primary glial cultures
Astrocytes and microglia are key contributors to the in-flammatory phenotype in AD and are also sources of type-1 IFN production within the CNS [51]. To investigate the role of astroglial and microglial type-1 IFN production
in response to Aβ1-42, the predominant Aβspecies
over-produced in APPSWE/PS1ΔE9mice [30, 31], we adopted an
in vitro approach using primary cultured mixed glial
cul-tures. Wildtype and IFNAR1−/− glia were treated with
10μM Aβ1-42 for 24–96 h and Q-PCR was used to assess
Fig. 5Removal of IFNAR1 in APPSWE/PS1ΔE9mice shifts the microglial phenotype to an anti-inflammatory state.aQ-PCR of cortical tissue isolated
from 9 month old wildtype, IFNAR1−/−, APP
SWE/PS1ΔE9and APPSWE/PS1ΔE9x IFNAR1−/−littermate controls analyzing iNOS, CD11b, CD32 and CD33
pro-inflammatory glial marker expression levels.bQ-PCR of cortical tissue isolated from 9 month old wildtype, IFNAR1−/−, APP
SWE/PS1ΔE9and
APPSWE/PS1ΔE9x IFNAR1−/−littermate controls analyzing TGFβ, YM1, ARG1, CD206, CCL22 and TREM2 anti-inflammatory glial marker expression
levels.cImmunoblot of Tris–HCl soluble cortical protein lysates isolated from 9 month old wildtype, IFNAR1−/−, APP
SWE/PS1ΔE9and APPSWE/PS1ΔE9
x IFNAR1−/−mice using anti-SOCS-3. Comparative summaries ofdPro-inflammatory andeanti-inflammatory glial marker expression in APP
SWE/
PS1ΔE9and APPSWE/PS1ΔE9x IFNAR1−/−mice are displayed. For Q-PCR, all samples were normalized back to the Ct value of the housekeeping
IFNαand IFNβexpression. At 72 and 96 h post-treatment
IFNAR1−/− glia displayed reduced IFNα (72 h: Wildtype:
12.7 ± 1.8-fold vs. IFNAR1−/−: 1.4 ± 0.1-fold, p <0.0001;
96 h: Wildtype: 9.1 ± 4.4-fold vs. IFNAR1−/−: 1.3 ± 0.2-fold,
p =0.0007, n= 4–5 per genotype, Fig. 6a) and IFNβ
ex-pression (72 h: Wildtype: 6.4 ± 1.3-fold vs. IFNAR1−/−:
0.7 ± 0.2-fold, p =0.0006; 96 h: Wildtype: 6.3 ± 2.1-fold
vs. IFNAR1−/−: 0.9 ± 0.3-fold, p =0.0012, n= 4–5 per
genotype, Fig. 6a) compared to wildtype cultures. In contrast to our in vivo data, Western blotting and
sub-sequent densitometry revealed that Aβ1-42 treatment did
not induce a p-Stat-3 response in either wildtype or
IFNAR1−/− glial cultures, displaying a comparable
expres-sion level (Additional file 4: Figure S3). Overall these
find-ings identify a glial-derived type-1 IFN response to Aβ1-42.
Furthermore this type-1 IFN response is attenuated upon removal of IFNAR1, in line with the notion that IFNAR1 is critical in autocrine up-regulation of type-1 IFNs in re-sponse to inflammatory stimuli [13, 29].
To investigate if ablation of type-1 IFN signaling
de-creases the pro-inflammatory cytokine burden in Aβ
1-42-treated glial cultures, further Q-PCR analysis was
con-ducted. At 24 and 48 h post-treatment, the IL-1βresponse
to Aβ1-42 was decreased in IFNAR1−/−cultures compared
to wildtype glia (24 h: Wildtype: 10.9 ± 4.4-fold vs. IFNAR1
−/−
: 0.8 ± 0.4-fold,p =0.0105; 48 h: Wildtype: 10.8 ± 3.8-fold
vs. IFNAR1−/−: 0.4 ± 0.1-fold,p =0.0074,n= 4–5 per
geno-type, Fig. 6a). Wildtype glia generated an elevated IL-6
re-sponse upon Aβ1-42 insult that was attenuated in IFNAR1
−/−
cultures at 96 h (Wildtype: 2.7 ± 0.9-fold vs. IFNAR1−/−:
0.3 ± 0.04-fold, p =0.0259, n= 4–5 per genotype, Fig. 6a).
Expression of TNFαafter 24 and 96 h of Aβ1-42 treatment
was also reduced in IFNAR1−/− glia compared to wildtype
counterparts (24 h: Wildtype: 7.2 ± 2.6-fold vs. IFNAR1−/−:
0.6 ± 0.05-fold,p =0.0003; 96 h: Wildtype: 4.8 ± 0.4-fold vs.
IFNAR1−/−: 0.2 ± 0.09-fold, p =0.0034, n= 4–5 per
geno-type, Fig. 6a). These data suggest that type-1 IFN signaling regulates further pro-inflammatory cytokine production in
glial cells exposed to Aβ1-42.
Type-1 IFNs can regulate the activity of NFkB, which is required for robust immune responses [50, 65]. To ascer-tain if attenuation of the type-1 IFN and pro-inflammatory
cytokine response to Aβ1-42 observed in IFNAR1−/− glial
cultures resulted in reduced NFkB (p65) activation, further
western blotting was performed (n= 3 per genotype,
Fig. 6b). Densitometry quantification identified
phosphor-ylation of NFkB (p65) was decreased in Aβ1-42-treated
IFNAR1−/− glia across the entire treatment course when
compared to wildtype cultures (24 h: Wildtype: 2.2 ±
0.2-fold vs. IFNAR1−/−: 0.9 ± 0.08-fold,p =0.0001; 48 h:
Wild-type: 2.1 ± 0.1-fold vs. IFNAR1−/−: 1.2 ± 0.08-fold, p =
0.0007; 72 h: Wildtype: 1.8 ± 0.2-fold vs. IFNAR1−/−: 0.8 ±
0.06-fold,p =0.0002,n= 3 per genotype, Fig. 6c).
Collect-ively this data suggests that type-1 IFN signaling regulates
the pro-inflammatory glial response to Aβ1-42.
Wildtype glia adopt a pro-inflammatory phenotype in response to Aβ1-42, whereas IFNAR1−/−cultures display enhanced expression of anti-inflammatory phenotypic markers
Within the current study we have demonstrated that removal of IFNAR1 confers an anti-inflammatory glial
response in APPSWE/PS1ΔE9 mice. Thus we were
inter-ested in confirming this phenotype in Aβ1-42-treated
IFNAR1−/− glial cultures that display attenuated
pro-inflammatory responses. To analyze the polarization
phenotype in response to Aβ1-42, wildtype and IFNAR1
−/−
glial cultures were treated with 10 μM Aβ1-42 for
24–96 h and analyzed by Q-PCR.
Significantly, expression of the iNOS pro-inflammatory
marker was elevated in wildtype but not IFNAR1−/− glial
cultures in response to Aβ1-42 (24 h: Wildtype: 5.4 ±
2.8-fold vs. IFNAR1−/−: 1.1 ± 0.3-fold, p =0.0195; 48 h:
Wild-type: 5.9 ± 2.3-fold vs. IFNAR1−/−: 0.6 ± 0.06-fold, p =
0.0032,n= 4–5 per genotype, Fig. 7a). Transcript levels of
the CD11b pro-inflammatory marker were also elevated in
Aβ1-42-treated wildtype cultures but not when IFNAR1
was absent (72 h: Wildtype: 3.6 ± 0.9-fold vs. IFNAR1−/−:
0.7 ± 0.2-fold, p =0.0274; 96 h: Wildtype: 4.1 ± 1.2-fold vs.
IFNAR1−/−: 0.8 ± 0.2-fold,p =0.0083,n= 4–5 per genotype,
Fig. 7a). Expression levels of the CD32 pro-inflammatory
marker were also reduced in IFNAR1−/−glial cultures when
compared to wildtype counterparts upon Aβ1-42 insult
(96 h: Wildtype: 4.6 ± 1.4-fold vs. IFNAR1−/−: 1.4 ± 0.2-fold,
p =0.0054,n= 4–5 per genotype, Fig. 7a).
Analysis of the ARG1 anti-inflammatory marker
re-vealed elevated expression levels in Aβ1-42-treated
IFNAR1−/− glia but not wildtype cultures (72 h:
Wild-type: 0.8 ± 0.5-fold vs. IFNAR1−/−: 2.9 ± 0.9-fold, p =
0.0252; 96 h: Wildtype: 1.3 ± 0.7-fold vs. IFNAR1−/−: 3.5
± 0.5-fold, p =0.0163, n= 4–5 per genotype, Fig. 7b).
CCL22 anti-inflammatory marker expression levels were
also elevated in Aβ1-42-treated IFNAR1−/− glia but not
wildtype cultures (24 h: Wildtype: 1.0 ± 0.3-fold vs.
IFNAR1−/−: 2.5 ± 0.5-fold, p =0.0089, n= 4–5 per
geno-type, Fig. 7b). Expression levels of the anti-inflammatory
markers YM1 and TGF-β remained constant across all
time points and between genotypes (n= 4–5 per genotype,
Fig. 7b). Expression levels of the CD206
anti-inflammatory marker were elevated in response to Aβ1-42
treatment but no difference between culture genotype was
detected (n= 4–5 per genotype, Fig. 7b). Expression levels
of the TGFβanti-inflammatory marker remained constant
across all time points and between genotypes (n= 4–5 per
genotype, Fig. 7b). Collectively these data suggest that wildtype glia adopt a mixed inflammatory polarization phenotype in response to amyloid insult. Removal of IFNAR1 shifts this mixed population towards a predomin-antly anti-inflammatory polarization state.
Conditioned media from Aβ1-42-treated IFNAR1−/−primary glia is less toxic to primary cultured neurons than wildtype media
To investigate the contribution of the glial polarized
in-flammatory response to Aβ1-42 on neuronal viability,
were treated with 10μM Aβ1-42 for 24–48 h and media was collected. Primary wildtype neuronal cultures were then supplemented with this media for 48 h and an MTS assay was performed to assess cellular viability. Significantly, treatment of neurons with wildtype glial conditioned media induced severe cytotoxicity that was attenuated when the same neurons were supplemented
with IFNAR1−/− glial conditioned media (24 h media:
Wildtype: 28.9 ± 1.2 % vs. IFNAR1−/−: 77.8 ± 5.7 %, p =
0.0003; 48 h media: Wildtype: 18.4 ± 1.9 % vs. IFNAR1
−/−
: 85.1 ± 7.1 %, p =0.0001, n= 3 individual neuronal
and glial cultures per genotype, Fig. 8). Both genotypes showed equal susceptibility to staurosporine-induced
apoptosis. This data implies that the reduced Aβ
1-42-induced pro-inflammatory cytokine burden and
anti-inflammatory activity identified in IFNAR1−/−glia is
pro-tective to neurons in vitro.
Discussion
The precise mechanism of how Aβ drives neurotoxicity
and exacerbation of AD remains largely unknown. Neuro-inflammation has been routinely implicated in AD and is gaining credence as a major facilitator of dis-ease progression [25, 41, 46, 47]. Type-1 IFNs are master regulators of the innate immune response [33] regulating
IL-1β, IL-6 and TNFα cytokine secretion that remain
influences neuro-inflammation and subsequent
path-ology in the APPSWE/PS1ΔE9 mouse model of AD. To
address this hypothesis we generated APPSWE/PS1ΔE9 x
IFNAR1−/− mice lacking type-1 IFN signaling. We
iden-tified that these mice were protected from spatial learn-ing and memory deficits demonstrated by APPSWE/
PS1ΔE9 mice. Interestingly, this phenotypic rescue did
not correlate with alterations in Aβ plaque burden and
only modest reductions in soluble cortical Aβmonomers
were detected. Additionally, removal IFNAR1 in the
APPSWE/PS1ΔE9 mouse promoted cortical astrocyte
re-activity, decreased total microgliosis, and conferred a largely anti-inflammatory glial phenotype. These findings
were corroborated with IFNAR1−/− glial cultures
initiat-ing a predominantly anti-inflammatory response to
in vitro Aβ1-42 insult (Fig. 9).
Our observation that removal of IFNAR1 in APPSWE/
PS1ΔE9 mice alters many aspects of the
neuro-inflammatory response, improves performance in the MWM behavioural test paradigm, but does not signifi-cantly alter amyloid pathology is notable. Whilst it is clear that amelioration of amyloidosis in the majority of preclinical AD models results cognitive benefit, we speculate that alleviating the pro-inflammatory burden on the CNS alone is sufficient to rescue at least some of the cognitive impairment demonstrated in these models.
We demonstrate that IFNαand IRF7 are up-regulated in
APPSWE/PS1ΔE9 mice and this expression is attenuated
upon removal of IFNAR1. Crucially, IRF7 is considered a central mediator of the deleterious type-1 IFN re-sponse on neurogenesis and cognition in old mice that lack amyloid deposition; a phenotype rescued upon anti-IFNAR1 monoclonal antibody treatment [3]. Thus modulation of the type-1 IFN signalling system and sub-sequent neuro-inflammatory responses may be sufficient
in providing cognitive benefit irrespective of the
clear-ance of Aβ. However, we cannot rule out the modest,
al-beit significant, reduction in Aβ monomer levels
observed in the APPSWE/PS1ΔE9 x IFNAR1−/− mice and
its potential effect on cognition. Indeed, targeted
re-moval of soluble Aβ production in aged
tetracycline-inducible APPSWE(Tg2576) mice reverts spatial learning
and memory impairments in the MWM without affect-ing plaque burden [21]. Thus further studies involvaffect-ing mass spectrometry profiles and electron microscopy of
Aβ species produced in APPSWE/PS1ΔE9 x IFNAR1−/−
may provide insight on the mechanisms by which type-1
IFN signalling potentially influences Aβoligomerization
and cognition.
The identification of attenuated plaque-localised
microgliosis, a predominant anti-inflammatory glial phenotype combined with enhanced plaque-localised
astrocytic reactivity in APPSWE/PS1ΔE9 x IFNAR1−/−
mice is also of interest. We confirm downregulated ex-pression of pro-inflammatory (iNOS, CD11b and CD33) and up-regulations of anti-inflammatory glial phenotypic
markers (TGFβ, YM1, ARG1 and TREM2) upon
re-moval of IFNAR1 in APPSWE/PS1ΔE9mice. Many studies
suggest that this glial phenotypic shift results in
en-hanced Aβ phagocytosis and clearance, yet we do not
observe this. One possible explanation is that the anti-inflammatory microglial activity may be counteracted by
enhanced astrocyte reactivity and elevated IL-1β
secre-tion, known to promote amyloidosis in APPSWE/PS1ΔE9
mice [26]. Indeed type-1 IFNs are pleiotropic in nature and induce cell-type specific functions [49]. Whilst this study focuses on the pro-inflammatory role of these cy-tokines it is equally feasible that type-1 IFNs are also exhibiting beneficial anti-inflammatory activity in
spe-cific cell types. There are currently 14 known IFNα
subtypes produced in mice, 13 in humans and a singular
IFNβ isoform, that in the majority of cases require
IFNAR1 for signalling. Thus the mixed inflammatory phenotype we observe in our global IFNAR1 knockout
approach in APPSWE/PS1ΔE9mice is likely due to
signal-ling elimination of these type-1 IFN subtypes and their pleiotropic effects in multiple cell types. Further studies identifying specific type-1 IFN subtypes and their contri-bution to neuro-inflammatory cascades and potential impact on amyloidosis will be beneficial in understand-ing the progression of AD.
Stimulation of primary mixed glial cultures lacking
IFNAR1 with Aβ1-42 results in a predominantly
anti-inflammatory response as observed in vivo. We
demon-strate that the IFNAR1−/− glial response to Aβ1-42
challenge is neuro-protective compared to the wildtype pro-inflammatory response in our conditioned media paradigm. We propose two alternative explanations for
the protection observed in this assay: 1) IFNAR1−/− glia
are more effective at removing Aβ1-42 from the media
than wildtype cultures, resulting in less Aβ1-42 transfer
to neuronal cultures and subsequent reduction in
neuro-toxicity. 2) Aβ1-42 insult triggers a reduced
pro-inflammatory response from IFNAR1−/− glia compared
to wildtype cultures, meaning that cytokine concentra-tions are reduced when transferred onto neurons result-ing in neuroprotection. Indeed, the phenotype observed may be resultant from a combination of these two expla-nations and warrants further experimentation to explore this neuro-protective mechanism.
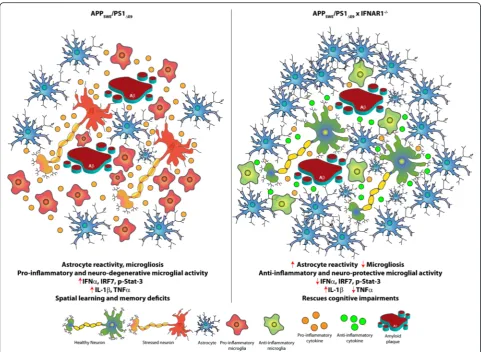
Fig. 9Schematic of the modulated neuro-inflammatory environment in APPSWE/PS1ΔE9x IFNAR1−
/−mice. The current study provides evidence that a type-1 IFN response contributes to the neuro-inflammation observed in AD. Amyloid plaques and soluble Aβ1-42 within the plaque microenvironment triggers pro-inflammatory microglial activation and secretion of pro-inflammatory cytokines, initiating the neuro-inflammatory process. The pro-inflammatory cues within the plaque microenvironment further enhance gliosis, exacerbating inflammation. In AD, excessive Aβ production maintains the stimulus for a pro-inflammatory response, compromising resolution, and contributes to a self-perpetuating neuro-degenerative inflammatory cycle. The current study demonstrates that type-1 IFN signaling intricately controls this neuro-inflammation. Removal of IFNAR1 in APPSWE/PS1ΔE9mice reduced type-1 IFN production, TNFαexpression and conferred an anti-inflammatory and neuro-protective