© 2019 IAU, Majlesi Branch
The Effect of Type and Location
of a Phase Change Material
(PCM) Layer in a Building Wall
on Energy Consumption using
Numerical Simulation
Arezoo Soleimani Dashtaki
Engineering Faculty, Shahrekord University, Iran E-mail: [email protected]
Afshin Ahmadi Nadooshan
*Associate Professor, Engineering Faculty, Shahrekord University, Iran E-mail: [email protected]
*Corresponding author
Afshin Abedi
Department of Mechanical Engineering
Islamic Azad University, Majlesi Branch, Isfahan, Iran E-mail: [email protected]
Received: 5 April 2019, Revised: 14 July 2019, Accepted: 15 September 2019
Abstract: Phase Change Materials (PCMs) have been the subject of many researches in recent years due to the storage and release of energy at low temperature ranges. PCMs store or releasing a large amount of energy at a constant temperature range leads to saving energy. In this paper, the numerical modelling of a multilayer composite wall including PCM located on the southern side of a building is carried out using an implicit method. The data correspond the fifteenth day of each month in Tehran. The governing equations are discretized by the implicit Crank Nicolson method and solved by iteration method using MATLAB software. Finally, the location and volume fraction of PCM in the wall of the building are studied to achieve maximum efficiency. The results show that the effect of latent and sensible heat results in a reduction in the input heat flux and thermal load to the building. The optimum location for the PCM layer is the middle layer of the composite wall to reduce the heat transfer rate inside the building. In addition, it is found that the PCM volume fraction in gypsum does not have a significant effect on the thermal performance of the multi-layer composite wall. Hence, low volume fraction reduces the costs without affecting the thermal performance of the building.
Keywords: Building, Composite Wall, Fluid Volume Fraction, Implicit Method, Latent Heat, PCM
Reference: Soleimani Dashtaki, A., Ahmadi Nadooshan, A., and Abedi, A., “The Effect of Type and Location of a Phase Change Material (PCM) Layer in a Building Wall on Energy Consumption using Numerical Simulationˮ, Int J of Advanced Design and Manufacturing Technology, Vol. 12/No. 4, 2019, pp. 33–46.
© 2019 IAU, Majlesi Branch
1 INTRODUCTION
One of the effective strategies to save energy is the use of PCMs. These materials absorb or release a large amount of energy by changing the phase at a constant temperature. PCMs have been widely used in many industries such as solar power stations and buildings (to increase thermal mass). By application of PCMs in the buildings, solar energy is stored in different components of the buildings throughout the day and is gradually released with the sunset and reduction in the temperature. It is effective in controlling the temperature of buildings and reducing the energy consumption. The high heat capacity of PCMs in the energy storage per unit mass of the material indicates that the thermal storage systems that use PCMs require less material compared to the conventional systems. Most PCMs have low conduction heat transfer coefficients that cause their charge and discharge rates to decrease. Hence, heat transfer enhancement methods are needed for latent storage systems using PCMs.
Some of the methods used to increase the heat transfer rate are using finned tubes with different geometries, stimulating of the bubbles, inserting a metal matrix inside the PCM, using PCM dispersed with high thermal conductivity particles, microcapsuletion of PCMs and using shell-and-tube arrangement and etc. The building industry is one of the largest energy consumers, which in some societies even accounts for about half of the total energy consumption. The reduction and optimization of energy consumption in buildings has become one of the major concerns for governments by rapid growth of living standards in buildings and, consequently, more energy consumption. One of the important properties of PCMs is the energy storage and phase change at a relatively constant temperature, which can be used to store and optimize energy consumption in buildings. So that the use of PCMs in coatings and building materials is increasing. There are many methods to use PCMs in building materials. One of the most commonly used is the composite walls of gypsum and cement. Approximately 41% of the gypsum composite wall is formed by air cavities. After saturation, the gypsum structure transfers the heat to the saturated PCM in matrix porosities.
However, this method has a saturated PCM leakage problem in the gypsum matrix during the thermal cycle [1-2]. Another method is to use micro and macro PCM capsules that can be used in building materials. This method eliminates the PCM leakage problem by putting the PCMs inside the capsules. The microencapsulation of PCMs in polyurethane is described by Kim [3]. Another method is shape-stabilized PCMs. This method also eliminates the problem of PCM leakage in the gypsum wall. In this method, PCM is suspended in a supportive phase such as high density polyurethane and
forms a composite material. The shape-stabilized PCM can be made by using 74% paraffin and 26% high density polyurethane [4]. This method has attracted the attention of many researchers due to its high specific heat, good thermal conductivity, the ability to maintain a stable PCM shape in the phase change process and good performance in multiple thermal cycles over time. Zhang [5] studied the stable PCM sheets and studied the optimal application of this method in the interior walls, roof and floor of the buildings. Pasupathy and Velraj [6] studied the effect of PCM panels on the roof of a building in terms of panel position and thickness. They proposed the use of dual-layer PCM panels on the ceiling for small variations in indoor temperature and suitability for all seasons.
Hawes and Feldman [7] and Bentz and Turpin [8] revealed that concrete modification and the use of PCM in it significantly affect the heat capacity and thermal performance of the concrete, and significantly reduces its strength. Cabeza et al. [9] conducted studies on a new type of concrete with PCM, without reduction in the mechanical strength. They also studied the effect of PCM on the thermal performance of the building. Baetens [10] demonstrated that it is better to use PCM in building walls due to the increase in the thermal mass of concrete using PCM in a building, although the high cost of PCM is a significant issue. Another method for using PCMs in the building materials is to use PCM in the rectangular holes in the brick, which was studied by Silva [11] and Vicente [12]. These hollow bricks are made of PCM that its blank space is filled with aluminium macro-capsules, which are filled with Rubimater® RT18 free shaped PCMs. Their experimental results indicated that the maximum peak energy consumption is delayed by using this type of bricks in the buildings.
© 2019 IAU, Majlesi Branch Diaconu [15] studied the potential for storage and
release of building heat with a composite PCM wall numerically. In this study, the wall contains two different layers of PCMs. The structure of this type of wall consists of three layers sandwiched together with an insulating panel, the outer layer of which consists of a PCM substrate and insulated in the middle layer. The PCM layer substrates have different properties: the outer layer has PCM with a higher melting point that is activated in the heat season and the inner layer contains PCM with a melting point close to the temperature of the room in the cold season. The simulation of the building was done for all seasons, and the effect of PCM on the structure and function of the wall was investigated. He also studied the effect of melting point of two types of PCM on the maximum energy storage. According to his findings, energy is stored throughout the year and the peak of thermal and cooling loads decreases using this new type of wall. Halford [16] modelled the peak shifting in a building using capsules containing PCMs. These materials are used in ceilings and insulated walls in order to delay in cooling peak at specific times. In order to properly understand the behaviour of this type of material, an ideal model including the one-dimensional heat diffusion equation and temperature function at different times is applied to the boundary conditions. In this model, the phase change temperature is an important parameter, which is considered as a latent melting heat. Other variables include ambient temperature and thermostat temperature that depend on the temperature of the PCM change. In addition, the cooling load peak of the building was compared in the absence and presence of PCM. Kuznik et al. [17] numerically modelled the heat stored in a PCM composite wall in order to achieve optimal storage energy in the building. He used the TRNSYS model 260 and compared his results with the experimental data. Although his model has good agreement with the experimental results, it does not have the ability to predict the phase change of microcapsules containing PCMs. Sharifi et al. [18] numerically studied the efficiency of PCM in gypsum composite walls to improve the thermal performance of buildings and reduce the energy consumption. According to their results, the use of PCMs in the gypsum composite wall in the building reduces energy consumption. They have also shown that the use of PCMs with a melting point near the comfort temperature in the building reduces the energy consumption and the energy costs. According to the results, the efficiency of PCMs depends on the input temperature profile. They used a sinusoidal input temperature profile with different amplitudes to obtain the proper location of the PCM layer and its proper percentage in the composite wall. Ramakrishnana et al. [19] investigated the design of a building using PCMs to optimize the latent heat capacity. The goal of this study
was to improve the indoor temperature control of a residential building in Melbourne, Australia during the summer. Two performance indicators were investigated in this work including efficiency coefficient, which indicates the optimal use of the latent heat capacity, and the efficiency coefficient which indicates the improvement of the interior comfort of the building. They identified the parameters that affect the efficiency and coefficient of performance and formulated these parameters to improve the design. Their results indicated that the performance index is effective in choosing the optimal PCM structure. It was also found that the use of PCMs leads to a reduction in the building's peak temperature by 1 to 2.5 ℃ during two days. Harald [20] concluded that the temperature of the room could be reduced by 2 ℃ using an envelope contains PCM and the maximum temperature of the envelope was delayed by about three hours.
In this paper, the heat transfer is modelled mathematically in the south wall of the building in Tehran at 24 hours on the fifteenth day of each month. The following assumptions are also considered to simplify the modelling:
1. Heat transfer in the wall is one dimensional.
2. Natural convection heat transfer capacity is considered as an average value on the surface. 3. The temperature of the sky and the environment are
assumed to be the same.
4. The thermophysical properties of the liquid and solid phases of PCM are constant and equal to the average of thermophysical properties of solid and liquid states.
This study aims to measure the thermal performance of the wall at the peak hour of energy consumption to reduce the energy of the building. Furthermore, the effect of latent and sensible heat storage on the reduction of input heat flux to the building is determined. In addition, the optimum location and volume fraction of the PCM layer in the composite are calculated.
2 GOVERNING EQUATIONS
The heat transfer in multilayer walls is defined by the equation of one-dimensional conduction heat transfer as follows [21]:
(1)
ρc
p∂T∂t=
∂x∂(k
∂T∂x)
© 2019 IAU, Majlesi Branch
(2)
ρc
p∂T∂t=
∂x∂(k
∂T∂x)
– Lρ
pcm ∂gl∂t
Where, L is the latent heat, ρpcm is the density of PCM and gl is the liquid phase volume fraction. Phase change occurs at a temperature range and phase volume fraction is a function of temperature reversal [22]:
gl = F(T) (3)
𝑔𝑙=
{
0 𝑇 < 𝑇𝑙 𝑇−𝑇𝑠
𝑇𝑙−𝑇𝑠 𝑇𝑠 ≤ 𝑇 ≤ 𝑇𝑙
1 𝑇 > 𝑇𝑙
(4)
For a PCM wall composition, the material properties include cp, ρ and k that are defined as follows [21]:
(5) ρ= (1 – wpcm) ρgyp + wpcm ρpcm
(6) Cp,c = (1 – wpcm) cp,gyp + wpcm cp,pcm
Where, Wpcm is the mass fraction of PCM in the composition. cp,gyp is the specific heat of the gypsum and cp,pcm is the specific heat of PCM. ρp,gyp and ρp,pcm are the density of the gypsum and PCM, respectively.
The thermal conductivity of the wall contains PCM and is determined using the Maxwell equation [21]:
(1 + 3𝜑
(𝑘𝑝𝑐𝑚+2𝑘𝑔𝑦𝑝
𝑘𝑝𝑐𝑚−𝑘𝑔𝑦𝑝)−𝜑
)
gyp
k = k (7)
Where, Kpcm is thermal conductivity of PCM and kgyp is the thermal conductivity of the gypsum. The volume fraction φ is obtained from equation (8):
𝜌 ρpcm
pcm W =
𝜑 (8)
The phase volume fraction of gl is known at the simulation time t = 0.
3 BOUNDARY CONDITIONS
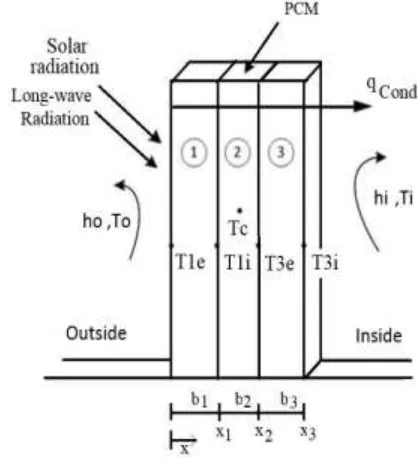
The boundary conditions are necessary for solving equations (1) and (2). Figure 1 shows the boundary conditions for the studied model. Exterior surfaces are affected by natural convection and radiation heat transfer with the surrounding air.
Fig. 1 Schematic of the multilayer wall and the governing boundary conditions.
According to “Fig. 1ˮ, the Neumann boundary condition is applied at x = x0 [21]:
(9) -k𝜕𝑇
𝜕𝑥|𝑥0= hr,sky (Tsky – T1e) + hr,air (Tair – T1e) +
hr,gnd (Tgnd – T1e) + αQsun+h0 (To – T1e)
Where, hr,air, hr,gnd and hr,sky are the radiation heat transfer coefficients of air, ground and sky, respectively, that are obtained from equations (10), (11) and (12) [21]:
ℎ𝑟.𝑎𝑖𝑟= 𝜀𝜎𝑓𝑠𝑘𝑦(1 − 𝛽)(𝑇𝑎𝑖𝑟2 + 𝑇1𝑒2)(𝑇𝑎𝑖𝑟
+ 𝑇1𝑒) (10)
ℎ𝑟.𝑔𝑛𝑑 = 𝜀𝜎𝑓𝑔𝑛𝑑(𝑇𝑔𝑛𝑑2 + 𝑇1𝑒2)(𝑇𝑔𝑛𝑑+ 𝑇1𝑒) (11)
ℎ𝑟.𝑠𝑘𝑦= 𝜀𝜎𝑓𝑠𝑘𝑦(𝛽)(𝑇𝑠𝑘𝑦2 + 𝑇1𝑒2)(𝑇𝑠𝑘𝑦+ 𝑇1𝑒) (12)
Where, α is the absorptivity, ε is the emissivity, 𝜎 is Stefan-Boltzmann constant. f and β are the shape factor and the air-sky damping factor, respectively. The Qsun value in this study is equal to the amount of solar radiation emitted by the sun on the fifteenth day of the month during the 24-hour period. 𝑇𝑂 is the temperature
at 24 hours of the fifteenth day of a month in Tehran that is calculated using equation (13) [23]:
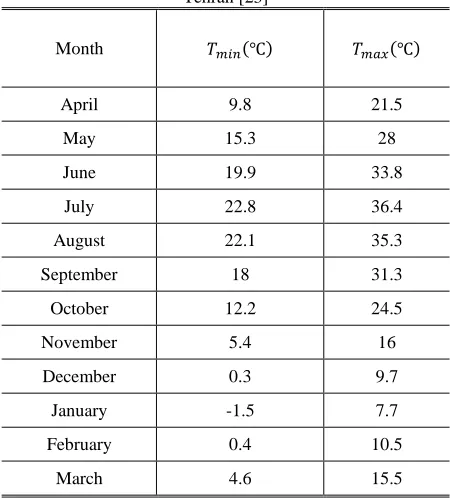
© 2019 IAU, Majlesi Branch The values of 𝑇𝑚𝑎𝑥 and 𝑇𝑚𝑖𝑛 for different months in
Tehran are presented in “Table 1ˮ. Information about the weather in Tehran can be obtained from the software calculations of the facility.
Table 1 The values of 𝑇𝑚𝑎𝑥 and 𝑇𝑚𝑖𝑛 for different months in Tehran [23]
𝑇𝑚𝑎𝑥(℃) 𝑇𝑚𝑖𝑛(℃)
Month
21.5 9.8
April
28 15.3
May
33.8 19.9
June
36.4 22.8
July
35.3 22.1
August
31.3 18
September
24.5 12.2
October
16 5.4
November
9.7 0.3
December
7.7 -1.5
January
10.5 0.4
February
15.5 4.6
March
h0 is mixed convection heat transfer coefficient, which is obtained according to the reference [24] and equation (9). To calculate mixed convection heat transfer coefficient, it is necessary to first compute the forced and natural convection coefficients. Relationships for forced convection in flat surfaces at constant temperature and natural convection in flat surfaces at constant temperature with vertical and semi-vertical directions (up to 2 degrees of inclination) are obtained according to reference [25]:
(14)
𝑁𝑢𝑛= 𝑁𝑢
𝑓𝑛 + 𝑁𝑢𝑁𝑛
Where, Nu is the Nusselt number on the wall, Nuf is the Nusselt number which is related to forced convection, NuN corresponds to natural convection and n=3:
(15)
𝑁𝑢𝑓= 0.3387𝑅𝑒
1/2𝑃𝑟1/3
[1+(0.0468𝑃𝑟 )2/3]
1/4 , Re.Pr>100
(16)
𝑁𝑢𝑁1/2 = 0.825 + 0.387𝑅𝑎1/6
[1+(0.492𝑃𝑟)9/16]8/27 ,0
-1<Ra<1012
Finally, total convection coefficient is as follows:
(17)
ℎ = 𝑁𝑢.𝑘𝐿
Where, h is the total convection heat transfer coefficient and L is the length of the wall. Specific behavior is required for the cross-section between a PCM layer and a regular layer (without PCM). According to “Fig. 1ˮ, Layer 1 is a regular layer and Layer 2 is a PCM layer. If the phase change does not occur in the PCM layer, the equilibrium energy equation for the x1 interface is expressed as follows [21]:
(18) -k𝜕𝑇
𝜕𝑥|𝑥1𝑙𝑎𝑦𝑒𝑟1= -k 𝜕𝑇
𝜕𝑥|𝑥1𝑙𝑎𝑦𝑒𝑟2
If the phase change occurs in layer 2, the energy stability equation is expressed as equation (19) [21]:
(19) -k𝜕𝑇
𝜕𝑥|𝑥1𝑙𝑎𝑦𝑒𝑟1= -k 𝜕𝑇
𝜕𝑥|𝑥1𝑙𝑎𝑦𝑒𝑟2
The inner surface at x = x3 is affected by the heat transfer in the room, which is expressed by the following equation:
(20) -k𝜕𝑇
𝜕𝑥|𝑥3= hi(Ti-Tзi)
Where, hi is obtained using relationships for isothermal flat surfaces. Ti is the room temperature that changes in different seasons. Ti is 20 °C in winter and 24 °C in summer. In order to calculate the solar energy, a non-isentropic sky model of Duffie and Beckman is used [26]. To calculate the total radiative energy on an inclined surface, the following equation is used:
(21)
𝐼𝑇 = (𝐼𝑏+ 𝐼𝑑𝐴𝑖)𝑅𝑏+ 𝐼𝑑(1 −
𝐴𝑖)(1+𝑐𝑜𝑠𝛽2 )[1 + 𝑓𝑠𝑖𝑛3(𝛽2)] + 𝐼𝜌𝑔(1−𝑐𝑜𝑠𝛽2 )
Where, Ib is the radiation of a beam shining on a horizontal surface, Id is a distributed radiation on a horizontal surface, Ai is a non-isotropic index, β is the inclination angle with respect to the horizon, f is the modulus factor, I is the total radiation on a horizontal surface and fg is the reflection of the ground. The total amount of radiation on the horizontal surface (I) and radiation emitted on the horizontal surface (Id) are obtained from the meteorological data. Radiation beam is calculated from equation (22):
(22)
𝐼𝑏= 𝐼 − 𝐼𝑑
The non-isotropic index is expressed as:
(23)
𝐴𝑖=𝐼𝐼𝑏
© 2019 IAU, Majlesi Branch
Where, Io is the beam spun on a horizontal surface outside the atmosphere and is calculated as follows:
(24)
𝐼𝑜 =12×3600𝜋 𝐺𝑠𝑐(1 + 0.033𝑐𝑜𝑠360𝑛365) ×
[𝑐𝑜𝑠𝜑𝑐𝑜𝑠𝑟(𝑠𝑖𝑛𝜔2− 𝑠𝑖𝑛𝜔1) + 𝜋(𝜔2−𝜔1)
180 𝑠𝑖𝑛𝑟𝑠𝑖𝑛𝛿]
Where, Gsc is the solar constant, n is the number of day per year, r is the geographic latitude of the region, δ is the slip angle and ω is the hour angle. The slip angle δ can be calculated as follows:
(25)
𝛿 = 23.45𝑠𝑖𝑛 (360 ×284+𝑛365 )
The following calculation are performed to calculate ω:
(26)
𝐸 = 229.2(0.000075 + 0.001868𝑐𝑜𝑠𝐵 − 0.032077𝑠𝑖𝑛𝐵 − 0.014615𝑐𝑜𝑠2𝐵 − 0.04089𝑠𝑖𝑛𝐵)
(27)
𝐵 = (𝑛 − 1)360365
The solar clock can be calculated using equation (28):
(28)
𝑆𝑜𝑙𝑎𝑟 𝑡𝑖𝑚𝑒 = 𝑠𝑡𝑎𝑛𝑑𝑎𝑟𝑑 𝑡𝑖𝑚𝑒 + 4(𝐿𝑠𝑡−
𝐿𝑙𝑜𝑐) + 𝐸
Where Lst is the origin meridian for the local geographic area and Lloc is the geographic longitude of the region. Finally, ω can be obtained from the following equation:
(29)
𝜔 = (𝑠𝑜𝑙𝑎𝑟 𝑡𝑖𝑚𝑒 − 12) × 15°
Where, Rb is the radiation ratio that is obtained using equation (30):
(30)
𝑅𝑏=𝑐𝑜𝑠𝜃𝑐𝑜𝑠𝜃
𝑧
Where,θ is the angle of interaction between the surface and the beam radiation and 𝜃𝑧is the angle of the beam radiation on a horizontal surface. The angle θ is obtained from equation (31):
(31)
𝑐𝑜𝑠𝜃 = 𝑠𝑖𝑛𝛿 𝑠𝑖𝑛𝜑 𝑐𝑜𝑠𝛽 − 𝑠𝑖𝑛𝛿 𝑐𝑜𝑠𝜑 𝑠𝑖𝑛𝛽 𝑐𝑜𝑠𝛾 + 𝑐𝑜𝑠𝛿 𝑠𝑖𝑛𝜑 𝑐𝑜𝑠𝛽 𝑐𝑜𝑠𝜔 + 𝑐𝑜𝑠𝛿 𝑠𝑖𝑛𝜑 𝑠𝑖𝑛𝛽 𝑐𝑜𝑠𝛾 𝑐𝑜𝑠𝜔 + 𝑐𝑜𝑠𝛿 𝑠𝑖𝑛𝛽 𝑠𝑖𝑛𝛾 𝑠𝑖𝑛𝜔
(32)
𝑐𝑜𝑠𝜃𝑧= 𝑐𝑜𝑠𝜑 𝑐𝑜𝑠𝛿 𝑐𝑜𝑠𝜔 + 𝑠𝑖𝑛𝜑 𝑠𝑖𝑛𝛿
In (31), β = 90 and γ = 0 is the angle of the ridge side with the surface. Finally, the module factor f is obtained from equation (33):
(33)
𝑓 = √𝐼𝑏 𝐼
4 NUMERICAL METHOD
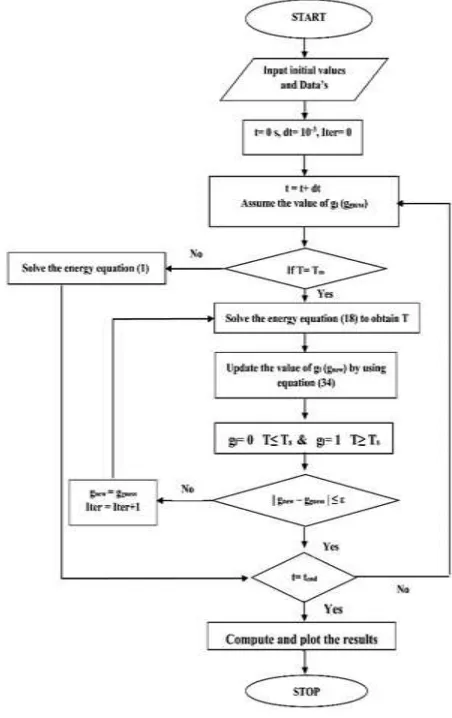
Figure 2 shows the flowchart of the numerical method used in this study. Algebraic equations are implicitly discretized and solved by MATLAB software [27].
Fig. 2 Numerical method flowchart.
In this study, the repetition process continues until the convergence criterion presented in equation (34) is obtained. In addition, the time step is assumed to be
10−5.
(34)
© 2019 IAU, Majlesi Branch
5 VALIDATION
In this paper, numerical modeling of PCM multilayer composite walls located on the southern side of a building is performed implicitly. The data are related to the fifteenth day of 12 months in Tehran. The governing equations are implicitly discretized and solved using the MATLAB software. The numerical results obtained from this study are compared with the results of Solomon analytical model [28]. It is found that the present method is valid for the simulations. The geometry studied by Solomon [28] was a semi-finite wall with a constant initial temperature of 21 °C and a constant temperature boundary condition (95 °C) at x = 0. “Table 2ˮ describes the parameters used in the Solomon study.
Table 2 Parameters used in the Solomon study [28] N-Eicosene Paraffin
Wax PCM
6.8 cm Length of the wall
21 ℃ Initial temperature of the wall
95 ℃ Temperature at x=0
36.7 ℃ )
m Melting temperature (T
247 KJ/Kg Enthalpy (L)
817 kg/m3 The density of PCM (ρ)
2.1 KJ/Kg.k )
p Specific heat (c
0.21 w/m.k Thermal conductivity (k)
The results are presented for one hour after the beginning of the heat transfer. As shown in “Fig. 3ˮ, the present results are in good agreement with the Solomon results.
Fig. 3 Comparison between the present results and the ones of Solomon [28].
The thermophysical properties and thickness of the other layers are shown in “Table 3ˮ. In this study, wall consists of two layers of lightweight prefabricated concrete and a layer saturated with PCM in gypsum. PCM melting occurs at 30 °C and its latent melting heat is 247 KJ/Kg. the characteristics of the layers used in the composite wall and the characteristics of PCM are presented in “Tables 4 and 5ˮ.
Table 3 Characteristics of the layers used in the compound wall for validation [21-22]
ρ ) 3 kg/m ( p C (KJ/Kg.k) K (w/m.k) Thickness (mm) 43 1.21 0.03 25.4 Insulation 800 1.09 0.16 15.9 Gypsum 817 2.1 0.15 12.7 PCM
Table 4 Characteristics of the layers used in the composite wall in this study
ρ ) 3 kg/m ( Cp (kJ/kg.k) K (w/m.k) Thickness (mm) 850 0.96 0.076 101.6 Prefabricated concrete 850 0.96 0.076 101.6 Prefabricated concrete 817 2.1 0.15 12.7 PCM
Table 5 Properties of PCM
N-Eicosene Paraffin Wax PCM
30 ℃ )
m Melting temperature (T
247 KJ/Kg Enthalpy (L)
0.17 w/m.k Thermal conductivity (k)
778 kg/m3 )
l The density of liquid phase PCM (ρ
856 kg/m3 )
s The density of solid phase PCM (ρ
2.01 KJ/Kg.k )
pl Specific heat of liquid phase (c
2.21 KJ/Kg.k )
ps Specific heat of solid phase (c
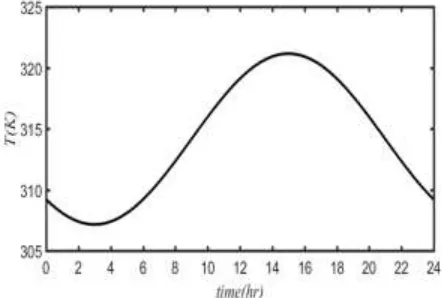
Figure 4 shows the temperature variations and “Fig. 5ˮ shows the radiation variations at 24 hours of the fifteenth day of July, which are applied as external boundary conditions. Room temperature, which is considered as an internal boundary condition, changes between seasons, which is 20 °C in winter and 24 °C in summer.
© 2019 IAU, Majlesi Branch
Fig. 5 The variations of radiation for fifteenth of July.
Fig. 6 Comparison of the heat flux for the wall containing a PCM layer with and without phase change and the wall
without PCM.
6 RESULTS
6.1. Comparison of the Effect of Latent and Sensible Heat Storage in Reducing the Input Heat Flux to The Building
Figure 6 shows the thermal performance and input heat flux for three cases: the wall without PCM layer, the wall containing the PCM layer by considering the phase change and the wall with the PCM layer without the phase change. In this condition, the heat flux is calculated after 24 hours at the peak temperature in the fifteenth of July at the interface between the inner layer and the interior of the building. As shown in Fig. 6, in spite of the PCM layer, considering the phase change in this layer, the input heat flux and consequently the cooling load at the peak energy consumption decrease compared to the wall without PCM. Moreover, due to the fact that the sensible heat storage effect in the presence of a PCM layer without phase changes and in the absence of the PCM layer, it is clear that the sensible heat storage significantly decreases the input heat flux and cooling load of the building at peak energy
consumption. In addition, the presence of another layer in the composite wall creates a thermal resistance in the interface between the two layers of the wall, which reduces the input heat flux.
The comparison between the heat flux diagram with and without the phase change show that the effect of phase change and latent heat storage significantly reduces the input heat flux compared to the case of PCM layer without phase change. The heat flux reduction is due to the latent heat storage at the phase change temperature and heat flux reduction results from the sensible heat storage at the temperatures other than the phase change one. “Table 6ˮ shows the average heat flux and heat flux reduction percent for three cases. It is concluded that the use of a PCM layer in both cases (with and without phase change) leads to a reduction in the input heat flux. The presence of phase change in the PCM layer results in a reduction in heat flux effectively.
Table 6 The average heat flux and the heat flux reduction percent for three cases considered in the present study.
Heat flux reduction percent relative to the
case "without PCM" Average
heat flux 2 w/m Case
0% 2.240746
Without PCM
2.77% 2.1887
With PCM without phase change
7.9565% 2. 06243
With PCM with phase change
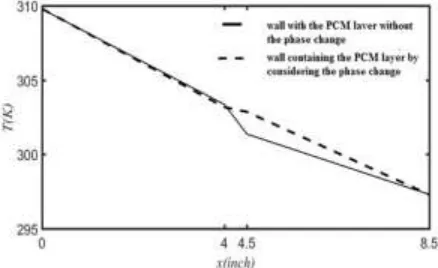
Figure 7 shows the temperature profile for the wall containing a PCM layer with the phase change after 24 hours. As shown in this figure, the temperature gradient and thus the heat penetration into the internal layers of the wall are higher for the case of wall with the PCM without phase change than those for the other cases, which indicates the higher input heat flux into the building.
Fig. 7 The temperature profile along the composite wall containing a PCM layer with and without the phase change.
© 2019 IAU, Majlesi Branch
Fig. 8 The temperature distribution at the interface between the composite wall layers, regardless of the effect of phase
change
Figure 9 shows the distribution of temperature in the interface wall layers considering the effect of phase change in the PCM.
Fig. 9 The temperature distribution in the interface wall layers considering the effect of phase change in the PCM.
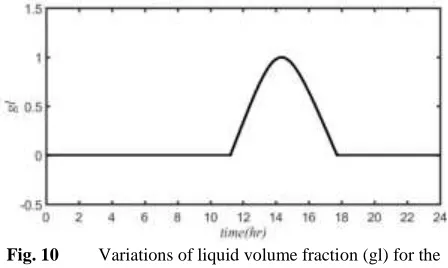
In both figures, the boundary 1 is the interface wall between the concrete layer and the surrounding. The boundary 2 is the interface wall between the concrete layer and the PCM layer, the boundary 3 is the interface wall between the inner concrete layer and the PCM layer and the boundary 4 is the interface wall between the inner concrete layer and the interior room environment. In “Fig. 10ˮ, the changes of the liquid phase volume fraction (gl) are shown versus the time. The liquid phase fraction is a criterion of the amount of latent heat stored in the wall.
Fig. 10 Variations of liquid volume fraction (gl) for the layer containing PCM.
6.2. Thermal Performance of the Wall for Different Position of Pcm Layer
In order to obtain the optimal position of the PCM layer to minimize the input heat flux and reduce the cooling load in the summer and the energy consumption peak, three conditions are considered. Figure 1 shows the different positions for the PCM layer in the composite wall: the PCM layer in the middle of the wall (case 1), in the interior of the wall (case 2), and in the outer surface in contact with the surrounding (case 3).
case 1
case 2
case 3
Fig. 11 Different positions of the PCM layer in the composite wall.
Figure 12 shows the input heat flux after 24 hours for three cases 1, 2 and 3. It can be concluded that the heat flux for the case 1 is lower than that for other cases, which indicates a decrease in the input cooling load to the building at the energy consumption peak. Cases 2 and 3 have relatively similar heat fluxes. Therefore, case 1 has the best arrangement of layers in a three-layer composite wall to reduce the cooling load of the building in the summer.
© 2019 IAU, Majlesi Branch
Figure 13 also shows the temperature distribution in the wall per hour in the temperature peak for different cases 1, 2 and 3.
Fig. 13 Temperature distribution for three positions of the PCM layer.
According to the temperature profiles, the temperature loss is observed at the interface of each layer, which reduces the heat flux and thermal penetration to the layers and internal parts of the wall. The slope of diagrams along the wall for the cases 2 and 3 are almost equal, which indicates a nearly equal heat flux these cases. The liquid phase fraction indicates the amount of latent heat stored in the wall. The liquid phase fraction in the wall is shown in “Fig. 14ˮ for the cases of 1 and 3. It can be concluded that the case 1 with the highest change in the liquid phase fraction has the highest amount of latent heat storage and thus the lowest amount of input heat flux to the building compared to other case (as shown in “Fig. 12ˮ). For the case 2, there is no phase change after 24 hours, in which case the sensible heat storage is dominant in reducing the heat flux of the wall. Case 3 also has relatively low variations in the liquid phase fraction. Sensible heat storage is dominant in reducing the heat flux of the wall.
Fig. 14 Liquid phase fraction for two cases of 1 and 3.
“Table 7ˮ compares the average heat flux and heat flux reduction percent for three different cases compared to the wall without PCM layer. It can be concluded that case 1 has the highest percentage of reduction of input heat flux by 5.04% compared to two other cases. Hence,
it is the optimal position of PCM layer in the composite wall in the present study.
Table 7 Comparison of the average heat flux, liquid phase fraction and heat flux reduction percent for different cases
Heat flux reduction percent compared to the wall without PCM
layer Average
heat flux 2 w/m Case
0% 2.240746
The wall without PCM layer
7.09565% 2.06240
Case 1
5.277% 2.1225
Case 2
2.7689% 2.178746
Case 3
6.3. The Effect of PCM Volume Fraction
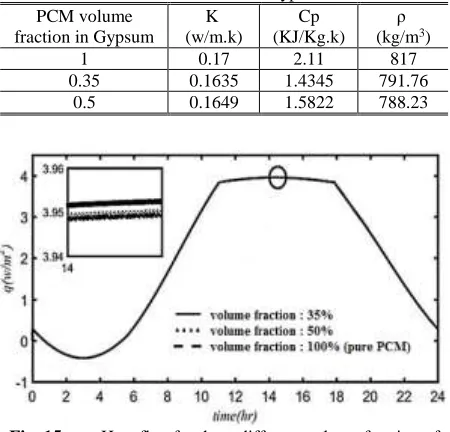
In order to study the effect of PCM volume fraction in gypsum, the thermal performance of the wall is investigated for three different volume fraction of 35%, 50% and 100% (pure PCM). The PCM layer is considered in the middle of the two wall layers. By changing the volume fraction of PCM, the thermophysical properties of the PCM layer are changed. For this purpose, using the equations (5) to (7), the thermophysical properties of the PCM layer are calculated and shown in “Table 8ˮ. It is observed that the change in the PCM volume fraction does not change the thermophysical properties of this layer, especially its thermal conductivity. Hence, according to “Figs. 15 and 16ˮ, it is observed that the input heat flux and the distribution of the temperature in the wall do not change with the volume fraction.
Table 8 Thermophysical properties for different volume fractions of PCM in Gypsum
ρ ) 3 kg/m ( Cp (KJ/Kg.k) K
(w/m.k) PCM volume
fraction in Gypsum
817 2.11
0.17 1
791.76 1.4345
0.1635 0.35
788.23 1.5822
0.1649 0.5
© 2019 IAU, Majlesi Branch
Fig. 16 Temperature distribution for three different volume fraction of 35%, 50% and 100% (pure PCM).
“Table 9ˮ presents the average heat flux, liquid phase fraction and heat flux reduction percent compared for different volume fractions.
Table 9 Comparison of the average heat flux, liquid phase fraction and heat flux reduction percent for different volume
fractions
heat flux reduction percent
compared to the wall without
PCM average
heat flux (w/m2) Average
liquid phase fraction (gl) Case
0% 2.240746
wall without PCM
7.9566% 2.06246
0.2309 φ
= 100%
7.7222% 2.06301
0.2254 φ
= 35%
7.932% 2.06771
0.2296 φ
= 50%
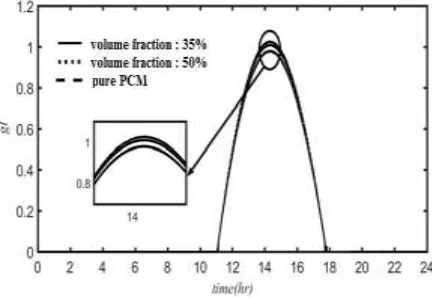
It is found that there is no significant change in the input heat flux, the liquid phase fraction, and the percentage of heat flux reduction with the volume fraction. Figure 17 also concludes that while the pure PCM has higher phase change compared to other volume fractions, it is not sufficient to cause a significant change in latent heat storage compared to other cases.
Fig. 17 The liquid phase fraction in the PCM layer for different volume fractions of PCM.
In “Fig. 17ˮ, the liquid phase fraction is shown for different volume fractions of PCM. According to this figure, more amount of the PCM layer is completely melted for the case of pure PCM layer. However, this amount is not so much and it absorbs more latent heat in this layer and significantly reduces the input heat flux. This is due to negligible changes in thermophysical properties.
6.4. Effect of Using PCM on Energy Consumption throughout the Year
Now, after finding the optimum position of v layer in the composite wall and the appropriate volume fraction of 0.35, “Figs. 18 to 29ˮ illustrate the input energy into the building on the fifteenth day of each month for two cases: the wall with and without PCM.
Fig. 18 Heat flux for the composite wall with and without PCM for 15th April
Fig. 19 Heat flux for the composite wall with and without PCM for 15th May.
© 2019 IAU, Majlesi Branch
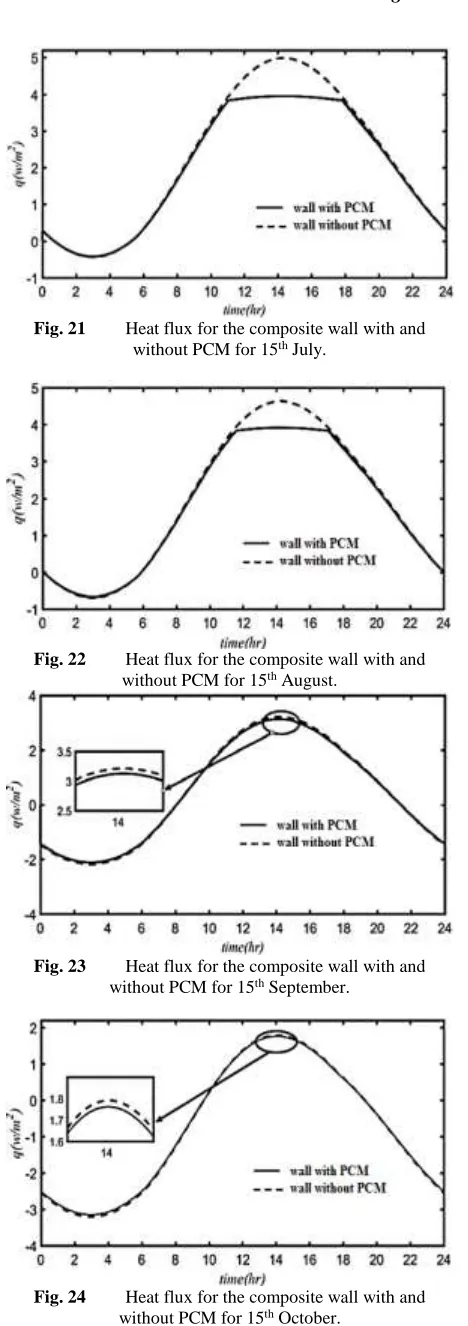
Fig. 21 Heat flux for the composite wall with and without PCM for 15th July.
Fig. 22 Heat flux for the composite wall with and without PCM for 15th August.
Fig. 23 Heat flux for the composite wall with and without PCM for 15th September.
Fig. 24 Heat flux for the composite wall with and without PCM for 15th October.
Fig. 25 Heat flux for the composite wall with and without PCM for 15th November.
Fig. 26 Heat flux for the composite wall with and without PCM for 15th December.
Fig. 27 Heat flux for the composite wall with and without PCM for 15th January.
© 2019 IAU, Majlesi Branch
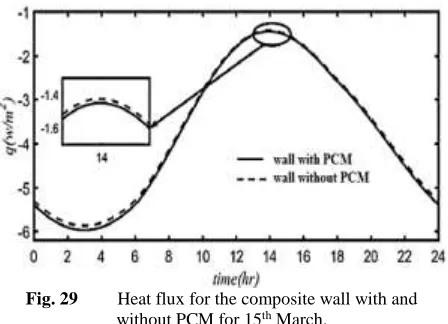
Fig. 29 Heat flux for the composite wall with and without PCM for 15th March.
As shown in Table 10, the use of a PCM layer has a significant effect on reducing the input heat flux. In the months of July and August, PCM phase change reduces energy consumption. In other months of the year that phase change does not occur, PCM acts like a thermal insulation.
Table 10 Input heat flux reduction using the PCM layer in the composite wall on the fifteenth day of each month
Average heat flux of
the wall without PCM layer Average
heat flux of the wall with PCM
layer Heat flux
reduction percent of the
wall with PCM layer Month -2.8220 -2.7742 1.6938 April -0.6373 -0.6268 1.6460 May 1.1727 1.0421 3.8526 June 2.0624 2.2407 7.9565 July 1.7681 1.6558 4.6547 August 0.4634 0.4506 2.7671 September 0.9978 -0.9772 2.0645 October -3.8706 -3.8041 1.7180 November -6.0145 -5.9111 1.7191 December -6.7278 -6.6121 1.7197 January -5.8439 -5.7435 1.7180 February -4.1143 -4.0435 1.7208 March
7 CONCLUSION
1. Use of the PCM layer in composite layers significantly reduces the input heat flux to the building.
2. The latent and sensible heat storage lead to a reduction in the input heat flux and thermal load to the building.
3. Storage of latent heat has a more effect on reducing the heat flux of the building.
4. In order to increase the thermal performance of the composite wall, the PCM must be selected according to the temperature of the PCM phase change, the climate conditions and temperature of the city.
5. Case 1 is the best arrangement of layers in a three-layer composite wall to reduce the cooling load of the building in the summer.
6. The PCM volume fraction in the gypsum has no significant effect on the thermal performance of the multi-layer composite wall. Hence, the choice of low volume fraction reduces the costs without affecting the thermal performance of the building.
8 APPENDIX OR NOMENCLATURE
L Liquid phase I Internal M Iteration N Time numbering
O Outer
s Solid phase A Area (m2)
cp Specific heat at constant pressure (j/kg.k) g Liquid phase fraction
h Heat transfer coefficient (W/m2.K) K Thermal conductivity (W/m.K) T Temperature (K)
t Time (s) w Mass fraction x Displacement (m) Ra Rayleigh number Re Reynolds number Pr Prandtl number ρ Density (kg/m3) ϕ Volume fraction
9 ACKNOWLEDGMENTS
This research was financially supported by Shahrekord University.
REFERENCES
[1] Kuznik, F., David, D., Johannes, K., and Roux, J. J., A Review On Phase Change Materials Integrated in Building Walls, Renewable and Sustainable Energy Reviews, Vol. 15, No. 1, 2011, pp. 379-391.
[2] Farid, M. M., Khudhair, A. M., Razack, S. A. K., and Al-Hallaj, S., A Review On Phase Change Energy Storage: Materials and Applications, Energy conversion and management, Vol. 45, No. 9-10, 2004, pp. 1597-1615.
[3] Kim, E. Y., Kim, H. D., Preparation and Properties Of Microencapsulated Octadecane With Waterborne Polyurethane, Journal of Applied Polymer Science, Vol. 96, No. 5, 2005, pp. 1596-1604.
© 2019 IAU, Majlesi Branch
Materials, Heat Transfer Analysis and Applications, Applied Thermal Engineering, Vol. 23, No. 3, 2003, pp. 251-283.
[5] Zhang, Y. P., Lin, K. P., Yang, R., Di, H. F., and Jiang, Y., Preparation, Thermal Performance and Application of Shape-Stabilized Pcm in Energy Efficient Buildings, Energy and Buildings, Vol. 38, No. 10, 2006, pp. 1262-1269.
[6] Pasupathy, A., Velraj, R., Effect of Double Layer Phase Change Material in Building Roof for Year Round Thermal Management, Energy and Buildings, Vol. 40, No. 3, 2008, pp. 193-203.
[7] Hawes, D. W., Feldman, D., Absorption of Phase Change Materials in Concrete, Solar Energy Materials and Solar Cells, Vol. 27, No. 2, 1992, pp. 91-101.
[8] Bentz, D. P., Turpin, R., Potential Applications of Phase Change Materials in Concrete Technology, Cement and Concrete Composites, Vol. 29, No. 7, 2007, pp. 527-532.
[9] Cabeza, L. F., Castellon, C., Nogues, M., Medrano, M., Leppers, R. and Zubillaga, O., Use of Microencapsulated Pcm in Concrete Walls for Energy Savings, Energy and Buildings, Vol. 39, No. 2, 2007, pp. 113-119.
[10]Baetens, R., Jelle, B. P., and Gustavsen, A., Phase Change Materials for Building Applications: A State-Of-The-Art Review, Energy and buildings, Vol. 42, No. 9, 2010, pp. 1361-1368.
[11]Silva, T., Vicente, R., Soares, N., and Ferreira, V., Experimental Testing and Numerical Modelling of Masonry Wall Solution with Pcm Incorporation: A Passive Construction Solution, Energy and Buildings, Vol. 49, 2012, pp. 235-245.
[12]Vicente, R., Silva, T., Brick Masonry Walls with Pcm Macrocapsules: An Experimental Approach, Applied Thermal Engineering, Vol. 67, No.1-2, 2014, pp. 24-34.
[13]Soares, N. M. L., Thermal Energy Storage with Phase Change Materials (Pcms) For the Improvement of the Energy Performance of Buildings, Doctoral Dissertation, Mechanical Engineering Dept., University of Coimbra, 2015.
[14]D'Avignon, K., Modeling and Experimental Validation of the Performance of Phase Change Material Storage Tanks in Buildings, Doctoral dissertation, DÉPARTEMENT DE GÉNIE MÉCANIQUE, École Polytechnique de Montréal, 2015.
[15]Diaconu, B. M., Cruceru, M., Novel Concept of Composite Phase Change Material Wall System for Year-Round Thermal Energy Savings, Energy and Buildings, Vol. 42, No. 10, 2010, pp. 1759-1772.
[16]Halford, C. K., Boehm, R. F., Modeling of Phase Change Material Peak Load Shifting, Energy and Buildings, Vol. 39, No. 3, 2007, pp. 298-305.
[17]Kuznik, F., Virgone, J., and Johannes, K., Development and Validation of a New Trnsys Type for The Simulation of External Building Walls Containing PCM, Energy and Buildings, Vol. 42, No.7, 2010, pp. 1004-1009.
[18]Sharifi, N. P., Shaikh, A. A. N., and Sakulich, A. R., Application of Phase Change Materials in Gypsum Boards to Meet Building Energy Conservation Goals, Energy and Buildings, Vol. 138, 2017, pp. 455-467.
[19]Ramakrishnan, S., Wang, X., Alam, M., Sanjayan, J., and Wilson, J., Parametric Analysis for Performance Enhancement of Phase Change Materials in Naturally Ventilated Buildings, Energy and buildings, Vol. 124, 2016, pp. 35-45.
[20]Mehling, H., Strategic Project ‘Innovative PCM-Technology—Results and Future Perspectives’, 8th Expert Meeting and Work Shop, Kizkalesi, Turkey, April 2004.
[21]Zwanzig, S. D., Lian, Y., and Brehob, E. G., Numerical Simulation of Phase Change Material Composite Wallboard in A Multi-Layered Building Envelope, Energy Conversion and Management, Vol. 69, 2013, pp. 27-40.
[22]Ashrae, Ashrae Handbook of Fundamentals, American Society of Heating, Refrigeration and Air-Conditioning Engineers, Atlanta, Georgia, 2011, pp. 29.28
[23]Nadoushan, A. A., Abedi, A., and. Bahrami, A., Reducing Heating and Cooling Energy Consumption in The Building Using Ceiling Fans, Asia Power and Energy System, Phuket, Thailand, 2007.
[24]Bergman, T. L., Incropera, F. P., Lavine, A. S., and DeWitt, D. P., Introduction to Heat Transfer, John Wiley & Sons, 2011.
[25]Rohsenow, W. M., Hartnett, J. P., and Cho, Y. I., Handbook of Heat Transfer, McGraw-Hill., New York: 1998.
[26]Voller, V. R., Swaminathan, C. R., ERAL Source-Based Method for Solidification Phase Change, Numerical Heat Transfer, Part B Fundamentals, Vol. 19, No. 2, 1991, pp. 175-189.
[27]Lay, D. C., INSTRUCTOR’S MATLAB® MANUAL, 2012.