DOI: 10.22075/JRCE.2017.11579.1194
journal homepage: http://civiljournal.semnan.ac.ir/
Internal Structure Features of Asphalt Mixture for
Field Samples
M. R. Keymanesh1*, A.Nasrollahtabar1 and N.Shahriari1
1. Department of Civil, Payame Noor University, P.O. Box 19395-3697, Tehran, Iran.
Corresponding author:[email protected]
ARTICLE INFO ABSTRACT
Article history:
Received: 08 June 2017 Accepted: 03 August 2017
Asphalt mixture is heterogeneous in nature; consequently, macroscopic parameters alone cannot describe the mechanical behavior of the mixture. In recent years, the arrangement of the aggregate particles in terms of spatial and directional distributions, and contact points are contemplated as the internal structure of asphalt. The main purpose of this article is to examine the microstructural characteristics of asphalt cores applying 2-D images. Comparison between the internal structure features in the laboratory samples and the Field samples is indicated in this paper. The results reveal that the survey of microstructural characteristics of asphalt cores by image processing provides new and functional information. This finding indicates that the number of contact points in cores is close to the lab samples that have been made at 45 to 65 blows on each end of the sample.
Keywords:
Aggregate Particles, Internal Structure, Core Samples, Contact Points.
1. Introduction
A review of the literature on this subject indicates that the investigations of hot mix asphalt (HMA) have mainly concentrated on the macroscopic behavior of the material based on the assumption that the mixture is homogeneous. This assumption is mainly as a result of the extreme difficulty encountered in quantifying measurements of the internal structure of HMA and the random nature of the aggregate and the void distribution [1]. For instance, there are many mix design methods applied throughout the world with parameters such as specific gravity, Marshall
that the influence of voids on the properties of HMA correlated to the total void content (macroscopic parameter) and also the spatial distribution of the voids (microscopic parameter) [2].
The analysis of these components alone and in relation to each other can give effective information about the behavior of asphalt mixtures. Jing Hu et al. (2014), Hainian Wang et al. (2015), Xu Huining et al. (2015), Magdy Shaheen et al. (2016), N.A. Hassan et al. (2015) and M. Emin Kutaya et al. (2010) applied X-ray determined Tomography(CT) and image processing technology to evaluate the effect of the internal structure of asphalt mixture on high-temperature failure; fatigue damage and another parameter [3,4,5,6,7]. However, the processing of the 3D X-ray has challenges, such as segmentation of aggregates that are in close proximity and processing noisy or poor contrast images [8].
Some other researchers have applied two-dimensional image processing. Zhong Qi Yue, William Bekking and Isabelle Morin (1995) utilized a digital image-processing technique to quantify the distribution, orientation, and shape of coarse aggregates (≥2 mm) in HMA mixtures. The quantitative results of HMA microstructure clearly indicate that the microstructure characteristics of coarse aggregates in HMA mixtures can be accurately measured applying the digital image processing technique [1]. Qinglin Guo et al. (2015) identified aggregate gradation using the digital image of the asphalt mixture. The planar gradation was transformed into the three-dimensional gradation by the stereological method. There was a good agreement between the estimated and the control gradations [9]. Leonardo Bruno et al. (2011) tried to finalize an effective analysis
of asphalt section image for automatically extracting aggregate gradation. They claimed that thanks to the synergic use of different segmentation methods of the digital images taken on slices of cores from the pavement, it is possible to acquire a reliable gradation of the mineral skeleton of the mixture [10]. Zhong Qi Yue, William Bekking, and Isabelle Morin indicated that the microstructure characteristics of coarse aggregates in HMA mixtures could be accurately measured applying the digital image-processing technique [11].
The analysis of the mixtures with the same gradation but different binders possess shows that the initial spatial characteristic of mixtures (spatial and directional distributions, and contact points) is determined by the gradations and compaction methods, but has nothing to do with binders [15, 16]. In previous studies, field samples are considered less. The main objective of this study is to evaluate the relationships between contact points, spatial distribution, as well as directional distribution and the volumetric properties of asphalt pavement field samples (core samples).
To determine the aggregate skeleton, computers and software advances are applied. 2D digital image processing techniques are used to analyze.
2. Tests Design and Material
This process involves the following:
- Obtaining laboratory samples
- Obtaining core samples
- Obtaining digital images and microstructure analysis
2.1. Obtaining Laboratory and Core Samples
In this study, laboratory and field core samples were applied. In order to remove a core sample of the compacted bituminous mixture from the pavement for laboratory testing, ASTM D5361 was utilized. Cores were taken at 21 points. The nominal maximum aggregate size (NMAS) was 9.5 mm for 13 cores, while the rest of the cores were 12.5 mm. For 16 points (8 samples for each size), laboratory samples were made. To make laboratory samples, hot mix asphalt (HMA) was sampled from behind the laydown machine where the loose mixture
was available (AASHTO T168). All samples were 4 inches in diameter. The PG 64-22 asphalt binder was utilized in all the samples.
2.2. Obtaining Digital Images and Microstructure Analysis
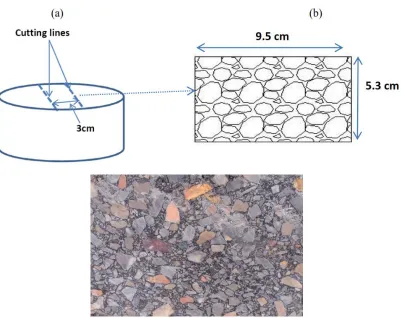
In this study, samples were cut with a circular masonry saw into multiple rectangular plane cross-sections. The two opposing faces of each cut were then scanned, providing images per specimen for processing and analysis for comparison with the mechanical testing samples. The minimum resolution of a digital photo is 27 pixels per mm (.037mm/pixel). A range of 53mm plus 95mm was selected for calculation (as illustrated in Figure 1).
Image processing and quantification of the internal structure features of asphalt mixture are performed using a 2-D image processing software named ipas2. Ipas2 is a significant improvement of the previous version of iPas. This software has functions correlated to image processing and microstructure analysis.
Fig. 1. (a) Sample cutting method. (b) Dimensions for digital image analysis.
3. Test Results and Discussion
In continuation, the results have been characterized.
3.1. Micro Parameter in the Skeleton
The aggregate skeleton is the structure of aggregates that are connected in the loading direction (from top to bottom of the sample in this case). As previously discussed, the following parameters have more effect on the performance of asphalt mixtures, specially rutting resistance:
- The number of contact points (N)
- Contact Length (CL)
- Contact Orientation
Fig. 2. The number of contact point and contact length [14].
Fig. 3. Contact orientation [14].
Theoretically, the contact threshold should be zero for the two particles. However, due to some errors in the image processing and thickness of slices, the two aggregates are presumed to correlate with their distance less than the threshold value [2]. Some researchers such as Coenen et al. (2012), Hong et al. (2010, 2011) and Xu Cai. (2013) suggested that the threshold value is equal to a quarter of the minimum aggregate analysis size [16].
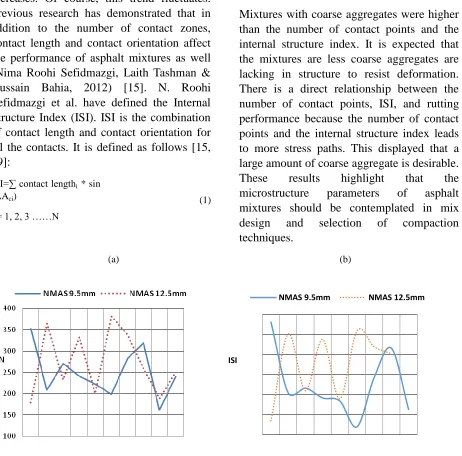
stone contact, which is essential , refers to the coarse stones retained on the sieve No. 8 (NCHRP report 673) [1415 ,16 ,17, 18]. In this paper, 2.36 mm is set to be the minimum aggregate analysis size. The number of contact points in the samples for each NMAS (9.5 mm or 12.5 mm) is presented in Figure 4.a. The general trend is that with a growth in NMAS, the number of contact points increases. Of course, this trend fluctuates. Previous research has demonstrated that in addition to the number of contact zones, contact length and contact orientation affect the performance of asphalt mixtures as well (Nima Roohi Sefidmazgi, Laith Tashman & Hussain Bahia, 2012) [15]. N. Roohi Sefidmazgi et al. have defined the Internal Structure Index (ISI). ISI is the combination of contact length and contact orientation for all the contacts. It is defined as follows [15, 19]:
ISI=∑ contact lengthi * sin
(AAci)
i = 1, 2, 3 ……N
(1)
N is the number of contacts in the skeleton, and contact lengthi and AAci are the contact length and orientation of the ith contact.
The Values of ISI in the samples for each NMAS (9.5 mm or 12.5 mm) are illustrated in Figure 4.b. The general trend is that with an increase in NMAS, the ISI increases. In comparison with the number of contact points, there is low fluctuation.
Mixtures with coarse aggregates were higher than the number of contact points and the internal structure index. It is expected that the mixtures are less coarse aggregates are lacking in structure to resist deformation. There is a direct relationship between the number of contact points, ISI, and rutting performance because the number of contact points and the internal structure index leads to more stress paths. This displayed that a large amount of coarse aggregate is desirable. These results highlight that the microstructure parameters of asphalt mixtures should be contemplated in mix design and selection of compaction techniques.
(a) (b)
Fig. 4. (a) The number of contact points in the samples for each NMAS (9.5 mm and 12.5 mm) (b) The ISI of the samples for each NMAS (9.5 mm and 12.5 mm).
ISI
ISI is the combination of contact length and contact orientation for all the contacts. N is the number of contacts in the skeleton. The performance of mixtures can be better computed by the combination of the internal structure indices. But, the advantage of the number of contacts is that it indicates the spread of the contact in the skeleton.
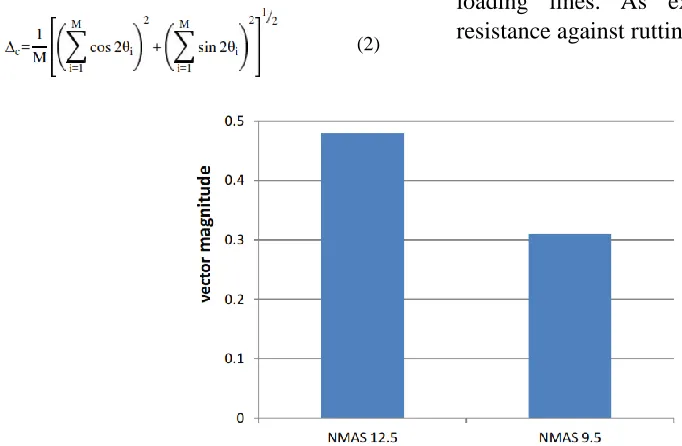
Recently, many researchers have reviewed the vector magnitude index [13, 15]. The vector magnitude (∆c) is an internal structure index which quantifies the average anisotropy of contact orientation distribution on a 2-D section image as below:
(2)
θi is the contact orientation on the 2-D image ranging from −90◦ to 90◦ , and M is the total number of contacts. Theoretically, the vector magnitude ranges from 0, as a completely random distribution of contacts orientation, to 100 (unity), for contacts orientation to be perfectly aligned in one direction.
For the value of the vector magnitude of the 9.5mm NMAS and 12.5mm NMAS, 0.31 and 0.48 respectively have been acquired , which indicates that the orientation of contact is more uniform by increasing the aggregate size (Figure 5). Consequently, coarse-grained mixes provide more contact lengths along loading lines. As expected, have more resistance against rutting.
Fig. 5. The vector magnitude index in the samples for each NMAS (9.5 mm and 12.5 mm)
3.2. Directional Distribution
The directional distribution of contact lengths in the core samples for each NMAS (9.5 mm or 12.5 mm) is illustrated in Figure 6. This histogram represents the normal distribution. Centralization of data in the histogram is the outer region that indicates the most
Fig.6. The directional distribution contact length in the samples for each NMAS (9.5 mm and 12.5 mm).
3.3. Spatial Distribution
To calculate the spatial distribution, the images are classified into three groups (Figure 7). These three regions are G1 (aggregate within upper third), G2 (aggregate within middle third) and G3 (aggregate within lower third).
As presented in Figure 8, the distribution of coarse aggregates in 12.5mm NMAS samples has greater dispersion. Furthermore, in the lower third (G3), somewhat coarse aggregate
content was higher. For the 9.5mm NMAS samples, spatial distribution was uniform in depth.
Fig.7.Divide images to review the spatial distribution.
3.4. Compaction Energy
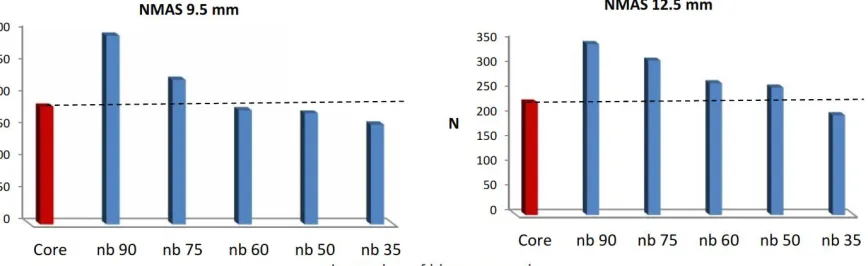
To make Marshall Samples, hot mix asphalt (HMA) was sampled from behind the laydown machine. For 16 points, laboratory samples were made at 35, 50, 60, 75, and 90 blows on each end of the sample. Processing and analysis of images indicate that by
increasing the number of blows (increasing compaction energy), the number of contact points in the samples increases (Figure 9). In this growing trend, the rate of slope fluctuates. The number of contact points in cores is close to the samples that have been made at 45 to 65 blows on each end of the sample.
Fig. 9. The number of contact points for each lab samples and field core samples.
The Marshall method is applied for primary lab mix design of field core samples (Number of blows = 75 on each side for heavy traffic loading). But, as Figure 6 illustrates the number of contact points is different on core samples and primary lab samples. Aa a result of the effect of parameters such as the number of contact points on the performance of asphalt mixtures, it can expect that the performance of core samples and primary lab samples is different. The number of contact points of field core samples was more similar to lab samples that were made based on medium traffic ((Number of blows = 50 on each side).
Of course, this is the expected result. Because the sampling of pavements takes
place in the first years of use. It may be suggested that laboratory samples that are designed to control the rutting should be constructed with fewer blows to make them closer to reality.
3.5. Volumetric Property
Fig.10.Variation in the air voids with the number of contact points.
4. Summary and Conclusions
The aim of this paper is to examine the microstructural characteristics of asphalt cores, applying image processing. The number of contact points, internal structure index, vector magnitude, directional distribution, and spatial distribution in this regard was taken into account.
The general trend is that with a growth in NMAS, the number of contact points and ISI increases. In comparison with the number of contact points, ISI has low fluctuation. Based on the vector magnitude, the orientation of contact is more uniform by increasing the aggregate size. The histogram of the directional distribution indicated the most orientation of aggregate particles, not along the loading direction. The distribution of coarse aggregate in 12.5mm NMAS samples had greater dispersion in depth.
By increasing compaction energy, the number of contact points in the samples increases. The number of contact points in cores is close to the lab samples that have been made at 45 to 65 blows on each end of the sample. Moreover, by reducing the air voids (with increasing energy), the number of contact points in the cores increases. The results appeal that the survey of the microstructural characteristics of asphalt
cores by image processing provides new and useful information.
REFERENCES
[1] E. Masad, B. Muhunthan, N. Shashidhar, T. Harman “Application of Digital Image Processing to Quantitative Study of Asphalt Concrete Microstructure” Transportation Research Record 1492/ 1995 p.53–60.
[2] Linbing Wang “Mechanics of Asphalt Microstructure and Micromechanics” The McGraw-Hill Companies, Inc, 2011. [3] Jing Hu, Zhendong Qian, Yang Liu, Meng
Zhang “High-temperature failure in asphalt mixtures using micro-structural investigation and image analysis” Construction and Building Materials 84 (2015) 136–145.
[4] Hainian Wang, Ran Zhang, Yu Chen, Zhanping You, Jun Fang “Study on microstructure of rubberized recycled hot mix asphalt based X-ray CT technology” Construction and Building Materials 121 (2016) 177–184.
[5] Xu Huining, Tan Yiqiu, Yao Xingao “X-ray computed tomography in hydraulics of asphalt mixtures: Procedure, accuracy, and application” Construction and Building Materials 108 (2016) 10–21.
[6] Magdy Shaheen, Adil Al-Mayah, Susan Tighe “A novel method for evaluating hot mix asphalt fatigue damage: X-ray computed tomography” Construction and Building Materials 113 (2016) 121–133.
y = 138.64x2 - 1845.5x + 6344.5
R² = 0.4458 N
[7] N.A. Hassan, R. Khan, J. Raaberg, D. Lo Presti “Effect of mixing time on reclaimed asphalt mixtures: An investigation by means of imaging techniques” Construction and Building Materials 99 (2015) 54–61.
[8] M. Emin Kutay, Edith Arambula, Nelson Gibson and Jack Youtcheff “Three-dimensional image processing methods to identify and characterize aggregates in compacted asphalt mixtures International Journal of Pavement Engineering” Vol. 11, No. 6, December 2010, 511–528.
[9] Qinglin Guo, Yanshan Bian, Lili Li, Yubo Jiao, Jinglin Tao, Chengxiu Xiang “Stereological estimation of aggregate gradation using digital image of asphalt mixture” Construction and Building Materials 94 (2015) 458–466.
[10] Leonardo Bruno, Giuseppe Parla, Clara Celauro “Image analysis for detecting aggregate gradation in asphalt mixture from planar images” Construction and Building Materials 28 (2012) 21–30. [11] E. Masad, B. Muhunthan, N. Shashidhar, T.
Harman “Internal Structure Characterization of Asphalt Concrete Using Image Analysis” journal of computing in civil engineering / April 1999 88–95.
[12] Eyad Masad, M. Emin Kutay, “Characterization of the Internal Structure of Asphalt Mixtures,” Transportation Research Circular E-C161, January 2012, pp2-16.
[13] Iuri S. Bessa, Veronica T.F. Castelo Branco, Jorge B. Soares, “Evaluation of different digital image processing software for aggregates and hot mix asphalt characterizations,” Construction and Building Materials 37, 2012, pp 370–378. [14] Aaron R. Coenen, M. Emin Kutay, Nima
Roohi Sefidmazgi & Hussain U. Bahia “Aggregate structure characterisation of asphalt mixtures using two-dimensional image analysis,” Road Materials and Pavement Design, Sep 2012, pp 433-454. [15] Nima Roohi Sefidmazgi, Laith Tashman &
Hussain Bahia, “Internal structure
characterization of asphalt mixtures for rutting performance using imaging analysis,” Road Materials and Pavement Design, 24 Apr 2012, pp 21-37.
[16] Xu Cai, Duanyi Wang, “Evaluation of rutting performance of asphalt mixture based on the granular media theory and aggregate contact characteristics” Road Materials and Pavement Design, May 2013, pp 325-340.
[17] A. T. Papagiannakis and E. A. Masad, “Pavement Design and Materials” The John Wiley & Sons, Inc, 552 pages, February 2008.
[18] “A Manual for Design of Hot Mix Asphalt with Commentary” NCHRP Report 673, Transportation Research Board Washington D.C. 2011.
[19] Nima Roohi Sefidmazgi, “Defining Effective Aggregate Skeleton in Asphalt Mixture Using Digital Imaging,” Master of Science Civil&Environmental Engineering, University of Wisconsin-Madison,2011.
![Fig. 2. The number of contact point and contact length [14].](https://thumb-us.123doks.com/thumbv2/123dok_us/8957746.1867114/5.612.195.405.293.528/fig-number-contact-point-contact-length.webp)