Please cite this article as: V. Alimirzaloo and V. Modanloo, Minimization of the Sheet Thinning in Hydraulic Deep Drawing Process Using Response Surface Methodology and Finite Element Method, International Journal of Engineering (IJE), TRANSACTIONS B: Applications Vol. 29, No. 2, (February 2016) 264-273
International Journal of Engineering
J o u r n a l H o m e p a g e : w w w . i j e . i rMinimization of the Sheet Thinning in Hydraulic Deep Drawing Process Using
Response Surface Methodology and Finite Element Method
V. Alimirzaloo*
,
V. ModanlooMechanical Engineering Department, Faculty of Engineering, Urmia University, Urmia, Iran
P A P E R I N F O
Paper history:
Received 17 November 2015
Received in revised form 05 January 2016 Accepted 26 January 2016
Keywords: Thinning Optimization Finite Element
Response Surface Methodology Hydraulic Deep Drawing
A B S T R A C T
In most of sheet forming processes, production of the final parts with minimum thickness variation and low required force is important. In this research, minimization of the sheet thinning and forming force in the hydraulic deep drawing process was studied. Firstly, the process was simulated using the finite element method (FEM) and the simulation model was verified compared to experimental results. Then the sheet thinning ratio and punch force were modeled as objective functions using the response surface methodology (RSM). In this model, process parameters including punch nose radius, die entrance radius and maximum fluid pressure were the input variables. Required experiments for the RSM were designed using the central composite design (CCD) method and performed by FEM. Finally, optimum point of the parameters was obtained by multi-objective optimization of the objective functions using the desirability function method based on response surface model and then evaluated. In addition, optimum ranges of the parameters were determined using overlying contour plots. Results showed that the response surface models had good adequacy. According to this model, increasing of the punch nose radius and die entrance radius lead to decreasing of thinning ratio and increasing the maximum punch force. Also the maximum punch force increases by increasing the maximum fluid pressure. Optimization results represent reduction of the thinning ratio almost 10% compared with conventional results.
doi: 10.5829/idosi.ije.2016.29.02b.16
1. INTRODUCTION1
Over recent years to preserve raw materials, the automotive industry has been to manufacture vehicles with lower fuel consumption. Production of lightweight parts using economical design is an important factor in achieving this purpose. One of the most important ways to reduce the weight of parts is substitution of deep drawing steels by lightweight materials such as magnesium and titanium alloys. One disadvantage of these materials is their lower forming limits. Another way to reduce parts weight is the integration of different functionalities within one part. If a consequent lightweight construction by lightweight materials and shape can be realized successfully, the number of components and joining operations can be reduced [1].
*Corresponding Author’s Email: [email protected] (V. Alimirzaloo)
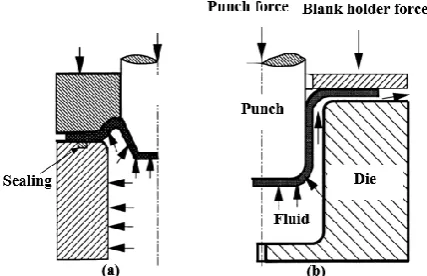
Hydraulic deep drawing is a technology for producing such parts that has been widely used in the automotive industry and is shown in Figure 1 schematically.
Figure 1. Schematic of hydraulic deep drawing process: (a) hydrostatic and (b) hydrodynamic representation
During the last few years, many studies have been carried out on the hydraulic deep drawing process. Pourboghrat et al. [5] investigated the LDR for deep drawing of AA5754 aluminum sheet. The aim of their study was to determine the limits and conditions in which the sheet hydroforming process provides a significant advantage over stamping in deep drawing of AA5754 aluminum sheets. The LDR for AA5754 aluminum sheet was found to be 1.33 and 2.21 for sharp and round die corner radii, respectively. Overall, it was concluded that hydroforming is most ideal for deep drawing of aluminum sheets with sharp radii features. Gorji et al. [6] studied the effect of maximum fluid pressure on bursting of conical–cylindrical cups in hydrodynamic deep drawing assisted by radial pressure experimentally and by FE simulation. They found that by applying a maximum fluid pressure less than a certain extent, the thinning ratio increases. Increasing the maximum fluid pressure to more than the special amount, does not have any effect on improvement of thickness distribution. Salahshoor et al. [7] investigated forming of concave-bottom cylindrical parts using hydrodynamic deep drawing assisted by radial pressure using the finite element simulation and experiment. In their work, the effects of pressure path and geometrical parameters of the punch on thickness distribution were examined. They found that after forming the concave profile of the work piece, by increasing the maximum fluid pressure, the critical regions thickness does not change. Also increasing the concavity height and punch corner radius affects the thickness reduction in critical regions. Azodi et al. [8] studied sheet rupturing in hydromechanical deep drawing process using the Barlat and Lian yield criterion. They also carried out experiment to validate their analytical results. They reported that maximum fluid pressure decreases by increasing the friction coefficient between the sheet and the punch. Lin et al. [9] experimentally studied the blank holder pressure, fluid pressure and thickness distribution of final part in hydromechanical deep
drawing. In their study, the hydraulic deep drawing experiment was conducted on 1.00 mm-thick 08Al steel, and a drawing ratio equal to 2.63 was obtained.
Despite of various investigations on hydraulic deep drawing process, few studies have been reported in the field of process optimization, especially multi-objective optimization. Likewise, improving the effective parameters always has been considered by researchers. As previously mentioned, conventional design methods usually are based on trial and error or experimental approaches that give rise to increase cost and time. Therefore using the optimization methods can prevent from wasting time and cost. This paper endeavors to understand the effect of punch nose radius, die entrance radius and maximum fluid pressure on sheet hydraulic deep drawing of cylindrical cups using RSM. Maximum sheet thinning and maximum punch force were considered as response functions. An experimentally verified FE model is used for performing parametric study.
2. RESPONSE SURFACE METHODOLOGY
Response surface method is used to evaluate the functions describing the relationship among some influencing factors and the process results. Box and Wilson introduced RSM in 1951 and then Montgomery and Myers [10] developed it. The most important purpose of RSM is to use a series of designed experiments to attain an optimal response. In many cases, a second-degree polynomial model is used in RSM. This model is only an approximation, but because of its flexibility, it is widely used [11]. This model is expressed as:
∑ ( ) ∑ ( ) ∑ ∑ ( ) (1)
where, y is the response, β0 , βi , βii , βij are unknown
constant coefficients and xi and xj, denote the
independent design variables, k is the number of the independent variables, and ε is the statistical error. The coefficients of the model equation are obtained using regression methods. The matrix notation of the regression model can be expressed as follows in which
β0, β1,…, βkare unknown constant coefficients.
[ ] [
][ ] [ ]
(2)
responses, respectively, the coefficients of β are as follows:
( ) (3)
The Minitab software was used to analyze the data. Each of the variables considered in two levels of minimum and maximum as input parameters that are shown in Table 1.
3. DESIGN AND PERFORM FE EXPERIMENTS
Performing the experimental tests often leads to high time and cost. Therefore, in this research rather than experimental test, FE analysis was used that is validated by experimental results. The blank is made of copper with a thickness of 2.5 mm and an initial diameter equal to 80 mm. The copper sheet properties are used based on reference [12] for FE analysis. The ABAQUS 6.9/Explicit was used for simulating the process. The tools and blank were modeled as analytical rigid and deformable, respectively.
Figure 2 shows the FE model before starting the process. Also geometric dimensions of tooling are shown in Table 2. The die and blank holder were fully constrained and the punch could move in the vertical direction. The friction coefficient was considered to be 0.14 for punch/sheet interface and it was considered 0.04 for other surfaces [7].
The element type of sheet was eight-node solid element (C3D8R). The number of elements along the thickness was selected five based on convergence of maximum punch force with respect to elements number. In order to verify the FE model, the simulation thickness distribution curve was compared with the experimental result that has been reported by firth author based on reference [12] that is shown in Figure 3. In this figure the articles A, B and C, imply the zones bottom, corner radius and wall of the final cup, respectively. As it can be seen from the figure, the FE results are in good agreement with the experimental results, hence the FE model was further used for performing the set of experiments designed by RSM.
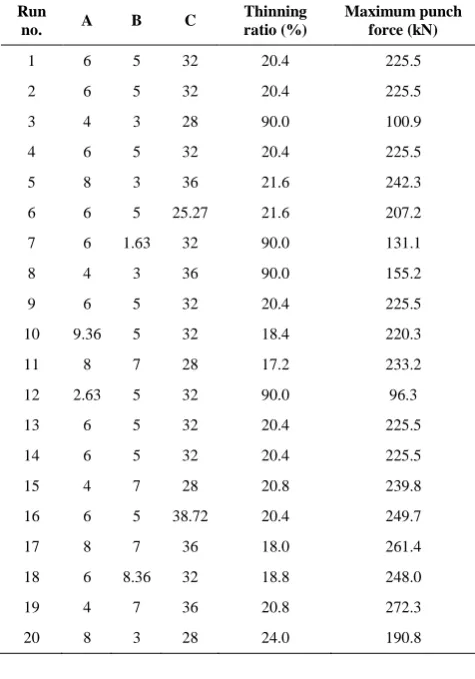
By implementing of the CCD method, design of experiments with 20 experiments would be done according to Table 3. Then output process parameters were extracted using FE analysis. Thinning ratio is one of the most important parameters in determining the quality of the final part. The thinning ratio was used for fracture criterion in the simulation. According to reference [13], major engineering strain (eθ) in plane strain condition is calculated by Equation (4):
( )( ) (4)
where; n is the strain hardening exponent and t0 is the
initial blank thickness.
TABLE 1. Input variable parameters with their levels
Parameter Designation Level
Minimum Maximum
Punch nose radius (mm) A 4 8
Die entrance radius (mm) B 3 7
Maximum fluid pressure
(MPa) C 28 36
TABLE 2. Geometrical dimensions of the die set [13]
Parameter Value (mm)
Punch diameter 38.5
Punch nose radius 6
Die inside diameter 44
Die entrance radius 5
Figure 2. FE model
Figure 3. Good agreement between simulation results and experimental results of reference [12]
The major true strain (εθ) and true strain in the thickness direction for plane strain condition are determined according to Equations (5) and (6).
( ) (5)
(6)
After calculating εθ and substituting it into Equation (7), the value of tf is obtained. By placing tf into Equation
(8), thinning ratio is obtained:
where; t0 is the initial thickness of the blank and tfis the
final thickness of the cup.
(8)
Thinning ratio was obtained 55% for the copper sheet that this amount will be used in the optimization of thinning ratio. It was also observed that the minimum thickness of cup occurs in the corner radius of the punch that is shown in Figure 4.
TABLE 3. Experiments design using CCD with outputs
Run
no. A B C
Thinning ratio (%)
Maximum punch force (kN)
1 6 5 32 20.4 225.5
2 6 5 32 20.4 225.5
3 4 3 28 90.0 100.9
4 6 5 32 20.4 225.5
5 8 3 36 21.6 242.3
6 6 5 25.27 21.6 207.2
7 6 1.63 32 90.0 131.1
8 4 3 36 90.0 155.2
9 6 5 32 20.4 225.5
10 9.36 5 32 18.4 220.3
11 8 7 28 17.2 233.2
12 2.63 5 32 90.0 96.3
13 6 5 32 20.4 225.5
14 6 5 32 20.4 225.5
15 4 7 28 20.8 239.8
16 6 5 38.72 20.4 249.7
17 8 7 36 18.0 261.4
18 6 8.36 32 18.8 248.0
19 4 7 36 20.8 272.3
20 8 3 28 24.0 190.8
Figure 4. Minimum thickness in final part
4. MULTI-OBJECTIVE OPTIMIZATION
4. 1. Desirability Function The purpose of optimization is to find one or several acceptable solutions to the critical values of one or more of the objective functions. Optimization methods are important in practice, especially in engineering design, experimental test and trading decisions [14]. When a problem involves more than one objective function, finding process of the optimal response is called multi-objective optimization. Desirability function is one of the multi-objective optimization methods that is used in this study. To optimize by using desirability function, firstly the individual desirability degree for each response should be calculated. If the aim is to minimize a response, the individual desirability is calculated using Equation (9). Also, Equation (10) is used for maximizing the response.
{
[( ( ))]
(9)
{
[( )
( )]
(10)
In Equations (9) and (10), di is the individual
desirability degree, yi represents the predicted value, Ti
is the target value, Ui denotes the maximum acceptable
value, Li is the minimum acceptable value and ri
represents the weight of desirability function for the ith
response. In this research, both response thinning ratio and maximum punch force should be minimum, therefore Equation (9) is used.
After calculating the individual desirability degree for each function, in order to use them to combine all the answers and finding overall proper conditions, the composite desirability is obtained using Equation (11) in which D is the composite desirability degree, wi
represents the importance of ith response and W is the overall weight.
(∏( )) (11)
Since the ultimate goal of this research is to achieve the less thinning ratio meanwhile decreasing maximum forming force, the importance for both objective function is considered one. Likewise the desirability function weight for each response is considered one. This is the default weight and is called linear desirability function [15]. Figure 5 shows the desirability function (minimizing case) with a weight of one.
range for the parameters is also important. To find the optimum range of the parameters, contour plots method is used. In this way, by using the contour plots for all functions and putting them together, the desired values of input variables for optimal range of objective functions is determined.
5. RESULTS AND DISCUSSION
5. 1. Modeling of the Thinning Ratio Response Function Normal probability plot for the thinning ratio is shown in Figure 6. Distribution points around the diagonal line represents that the distribution of data is normal. This model also indicates a good quality of the model. By using RSM, final model for thinning ratio according to the input parameters punch nose radius (A), die entrance radius (B) and maximum fluid pressure (C) will be expressed as Equation (12):
Thinning ratio = – 60.3197 A – 61.9054 B + 4.71079 C + 2.62968 A2 + 2.64736 B2 – 0.0762034 C2 + 4 A×B – 0.025 A×C + 0.05 B×C
(12)
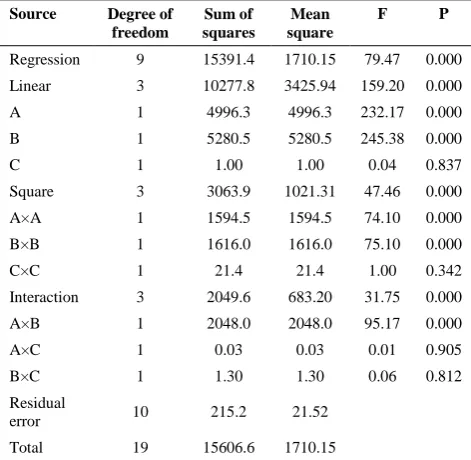
Analysis of variance (ANOVA) has been used in order to examine the effect of the parameters in the fitted regression model. The results of ANOVA for thinning ratio is presented in Table 4. The P values less than 0.05, indicates that the desired parameters are effective. It was observed that the terms linear, square and interaction are effective in the regression model.
The goodness of the response surface model (R2) can be determined as follow:
∑( ∑( )) (13)
where yi is the objective function value from the model,
is the real value and y is the average value. This value for thinning ratio was obtained as 98.62% that is desirable.
Figure 5. Desirability function with a weight of one
Figure 6. Normal probability plot of thinning ratio
TABLE 4. ANOVA table for thinning ratio
Source Degree of
freedom
Sum of squares
Mean square
F P
Regression 9 15391.4 1710.15 79.47 0.000
Linear 3 10277.8 3425.94 159.20 0.000
A 1 4996.3 4996.3 232.17 0.000
B 1 5280.5 5280.5 245.38 0.000
C 1 1.00 1.00 0.04 0.837
Square 3 3063.9 1021.31 47.46 0.000
A×A 1 1594.5 1594.5 74.10 0.000
B×B 1 1616.0 1616.0 75.10 0.000
C×C 1 21.4 21.4 1.00 0.342
Interaction 3 2049.6 683.20 31.75 0.000
A×B 1 2048.0 2048.0 95.17 0.000
A×C 1 0.03 0.03 0.01 0.905
B×C 1 1.30 1.30 0.06 0.812
Residual
error 10 215.2 21.52
Total 19 15606.6 1710.15
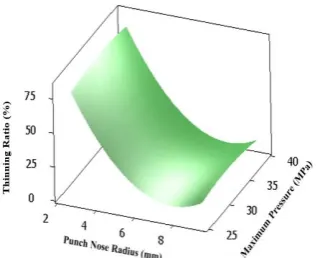
Figure 7 shows response surface of thinning ratio according to the punch nose radius and die entrance radius. In Figure 8 response surface of thinning ratio according to the punch nose radius and maximum fluid pressure is shown. Also Figure 9 shows the response surface of thinning ratio according to the die entrance radius and maximum fluid pressure.
According to Figures 7 to 9, it is clear that with increasing punch nose radius, thinning ratio is reduced. Simultaneously by moving down the punch and applying the fluid pressure onto the bottom surface of the sheet, the bending radius of the sheet will increase by increasing the punch nose radius. As a result, the thickness reduction at this zone is low. In the other words, by reduction of the tension in the sheet due increasing the bending and unbending in the corner radius of the punch, the thinning in this area will be reduced.
Figure 8. Response surface of thinning ratio according to punch nose radius and maximum fluid pressure
Figure 9. Response surface of thinning ratio according to die entrance radius and maximum fluid pressure
Also it can be seen that the effect of maximum pressure on the thinning ratio is not notable. This matter can be seen from ANOVA table of thinning ratio. Because the P value for maximum fluid pressure is greater than 0.05.
5. 2. Modeling of the Punch Force Response Function Figure 10 shows the normal probability plot for the punch force. Distribution points around the diagonal line indicates that the distribution of data is normal. By using RSM, final model for punch force according to the input parameters punch nose radius (A), die entrance radius (B) and maximum fluid pressure (C) will be expressed as Equation (14): Maximum punch force = 82.8479 A – 107.535 B – 9.41533 C – 4.19647 A2 – 2.36242 B2 + 0.268973 C2 – 5.39063 A×B + 0.232812 A×C – 1.04844 B×C
(14)
The results of ANOVA for punch force is tabulated in Table 5. It was observed that the terms linear, square and interaction are effective in the regression model.
The goodness of the response surface model (R2) was obtained as 97.25% that is desirable. Figure 11 shows response surface of punch force according to the punch nose radius and die entrance radius. Response surface of punch force according to the punch nose radius and maximum fluid pressure is shown in Figure 12.
Figure 10. Normal probability plot of punch force
TABLE 5. ANOVA table for punch force
Source Degree of
freedom
Sum of squares
Mean
square F P
Regression 9 40267.1 4474.1 39.35 0.000
Linear 3 30361.3 10120.4 89.01 0.000
A 1 9213.7 9213.7 81.03 0.000
B 1 17732.0 17732.0 155.95 0.000
C 1 3415.6 3415.6 30.04 0.000
Square 3 5595.8 1865.3 16.40 0.000
A×A 1 4060.6 4060.6 35.71 0.000
B×B 1 1286.9 1286.9 11.32 0.007
C×C 1 266.9 266.9 2.35 0.156
Interaction 3 4310.1 1436.7 12.64 0.001
A×B 1 3719.5 3719.5 32.71 0.000
A×C 1 27.8 27.8 0.24 0.632
B×C 1 562.8 562.8 4.95 0.050
Residual
error 10 1137.0 113.7
Total 19 41404.1 4474.1
Also Figure 13 shows the response surface of punch force according to the die entrance radius and maximum fluid pressure.
Figure 11. Response surface of punch force according to punch nose radius and die entrance radius
Figure 12. Response surface of punch force according to punch nose radius and maximum fluid pressure
Figure 13. Response surface of punch force according to die entrance radius and maximum fluid pressure
5. 3.Optimization Process In order to use the desirability function, an area should be specified to obtain optimum point. The thinning ratio and maximum punch force should become minimum. For this issue, first the target and the upper bound should be determined. For the response thinning ratio, the target value is selected zero. This means that the final piece is without thinning. Also the upper bound is selected 55 with respect to the maximum amount due to thinning ratio according to Equation (1). For the maximum punch force, the target value of 233.2 is selected. This value is considered from run number 11 of Table 3 in
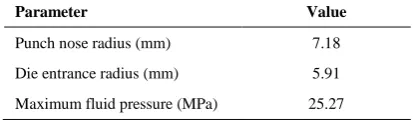
which the lowest thinning ratio is gained for this amount of force. The upper bound for the punch force is determined as 419 by multiplying the maximum fluid pressure from Table 1 (36 MPa) on the cross section of the bottom of final work piece. The optimization results using the mentioned information are shown in Figure 14. According to this figure, the composite desirability of the obtained point is 0.929. Because this amount is higher than 0.9, it can be selected as the accepted optimal point. Table 6 shows the optimal point values.
In order to evaluate the optimal point, the FE results of this point were compared with the results of the normal simulation. Normal simulation is considered as the run number 11 in which the thinning ratio is lower than other experiments (17.2%). In Table 7 the comparison results of the thinning ratio and maximum punch force between the optimum and normal mode is shown. The results show the improvement of the thinning ratio by almost 10% in optimal mode compared to the normal mode.
It is difficult to adjust the input variables in a certain amount in practice. Therefore, in the next step overlay contour plots were examined for extracting the optimum range of input variables of desired values of response functions. The optimal point of desirability function method was used to create the final contour. In this method, firstly the contour plots for two variables and each functions is drawn. For overall contour plots, the optimal range of variables for desired values of response functions is specified in the diagram.
Figure 14. Optimization curves using desirability function
TABLE 6. Optimal point values using desirability function
Parameter Value
Punch nose radius (mm) 7.18
Die entrance radius (mm) 5.91
TABLE 7. Optimal point values using desirability function
Experiment Thinning ratio (%) Maximum punch force
(kN)
Optimal mode 15.5 230.6
Normal mode 17.2 233.2
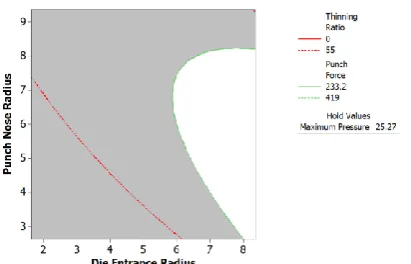
In the other words, this method achieves to the optimal response with assuming that other input variables are constant by comparing the pair of input variables. At first, an acceptable limit for the responses is specified and their upper and lower bounds are determined; somehow the responses be acceptable at these bounds. Then amongst the input variables, both of them are selected and others are assumed to be constant (at a minimum, maximum or average level). The final graph is plotted somehow that the solid line and the dash line imply the lower bound and upper bound of the responses, respectively. The area in which all the answers are common, would mark by white color (Figures 15 to 17). In this area, all the answers are in the accepted range and all points in this area will be optimal. In general, the white area is the overlap area for both variable of the optimum range. To find the optimal range of parameters using contour plots, the upper bound for thinning ratio is selected 55 (according to maximum thinning criteria) and the lower bound is considered zero. Upper and lower bounds for the maximum punch force were selected 419 and 233.2, respectively. In creating the contour plots, the constant parameter is considered as the obtained optimal point using the desirability function. Figure 15 shows the contour plot for two parameters punch nose radius and die entrance radius. Using the desirability function, the value of the maximum fluid pressure was determined to be 25.27 as the constant parameter. Also the contour plots of the punch nose radius/maximum fluid pressure and die entrance radius/ maximum fluid pressure are shown in Figures 16 and 17, respectively. White area shows the optimum range of parameters.
Figure 15. Overlying counter plot for punch nose radius and die entrance radius
Figure 16. Overlying counter plot for punch nose radius and maximum pressure
Figure 17. Overlying counter plot for die entrance radius and maximum pressure
For example, as it is shown in Figure 16, the punch nose radius approximately less than 6.4 mm and more than 7.2 mm within the fluid pressure of 25 MPa, cause sheet rupture. In addition, the optimal area of punch nose radius increases by increasing the maximum fluid pressure.
6. COCLUSIONS
maximum punch force indicated that the maximum punch force increases by increasing all of the three input variables. The results of the modeling showed that the response surface model investigates the effect of the input parameters on the response functions with a proper precision. The optimization results using the desirability function showed that thinning ratio reduced almost 10% compared to normal mode. Finally, optimal range of the input parameters were determined by putting together the contour plots for the desired amount of response functions using optimal point.
7. REFERENCES
1. Merklein, M. and Rösel, S., "Characterization of a magnetorheological fluid with respect to its suitability for hydroforming", International Journal of Material Forming, Vol. 3, No. 1, (2010), 283-286.
2. Koc, M., "Hydroforming for advanced manufacturing, Elsevier, (2008).
3. Zhang, S., Wang, Z., Xu, Y., Wang, Z. and Zhou, L., "Recent developments in sheet hydroforming technology", Journal of Materials Processing Technology, Vol. 151, No. 1, (2004), 237-241.
4. Salahshoor, M., Gorji, A. and Bakhshi-Jooybari, M., "Investigation of the effects of pressure path and tool parameters in hydrodynamic deep drawing", International Journal of Engineering-Transactions A: Basics, Vol. 27, No. 7, (2014), 1155-1166.
5. Pourboghrat, F., Venkatesan, S. and Carsley, J.E., "Ldr and hydroforming limit for deep drawing of aa5754 aluminum sheet", Journal of Manufacturing Processes, Vol. 15, No. 4, (2013), 600-615.
6. Gorji, A., Alavi-Hashemi, H., Bakhshi-Jooybari, M., Nourouzi, S. and Hosseinipour, S.J., "Investigation of hydrodynamic deep drawing for conical–cylindrical cups", The International Journal of Advanced Manufacturing Technology, Vol. 56, No. 9-12, (2011), 915-927.
7. Salahshoor, M., Gorji, A. and Bakhshi-Jooybari, M., "The study of forming concave-bottom cylindrical parts in hydroforming process", The International Journal of Advanced Manufacturing Technology, Vol. 79, No. 5-8, (2015), 1139-1151.
8. Azodi, H., Naeini, H.M., Parsa, M. and Liaghat, G., "Analysis of rupture instability in the hydromechanical deep drawing of cylindrical cups", The International Journal of Advanced Manufacturing Technology, Vol. 39, No. 7-8, (2008), 734-743. 9. Lin, J., Zhao, S., Zhang, Z. and Wang, Z., "Deep drawing using a novel hydromechanical tooling", International Journal of Machine Tools and Manufacture, Vol. 49, No. 1, (2009), 73-80.
10. Myers, W.R. and Montgomery, D.C., "Response surface methodology", Encycl Biopharm Stat, Vol. 1, (2003), 858-869. 11. Alimirzaloo, V., Sadeghi, M. and Biglari, F., "Optimization of the forging of aerofoil blade using the finite element method and fuzzy-pareto based genetic algorithm", Journal of mechanical science and technology, Vol. 26, No. 6, (2012), 1801-1810. 12. Modanloo, V., Gorji, A. and Bakhshi-Jooybari, M.,
"Experimental and numerical investigation of the forming of copper sheet using fluid pressure", in development of civil, architecture, electricity and mechanical engineering, Gorgan, Iran., (2014).
13. Aue-U-Lan, Y., Ngaile, G. and Altan, T., "Optimizing tube hydroforming using process simulation and experimental verification", Journal of Materials Processing Technology, Vol. 146, No. 1, (2004), 137-143.
14. Deb, K., "Multi-objective optimization using evolutionary algorithms, John Wiley & Sons, Vol. 16, (2001).340- 352 15. Candioti, L.V., De Zan, M.M., Camara, M.S. and Goicoechea,
Minimization of the Sheet Thinning in Hydraulic Deep Drawing Process Using
Response Surface Methodology and Finite Element Method
V. Alimirzaloo
,
V. ModanlooMechanical Engineering Department, Faculty of Engineering, Urmia University, Urmia, Iran
P A P E R I N F O
Paper history:
Received 17 November 2015
Received in revised form 05 January 2016 Accepted 26 January 2016
Keywords: Thinning Optimization Finite Element
Response Surface Methodology Hydraulic Deep Drawing
هديكچ
لکش یاهدنیآرف رتشیب رد نیرتمک اب ییاهن تاعطق دیلوت ،یقرو یهد
یم یرورض مک زاین دروم یورین و تماخض رییغت
-هنیمک ،قیقحت نیا رد .دشاب کزان یزاس
رارق هعلاطم دروم یکیلوردیه قیمع ششک دنیآرف رد مزلا یورین و قرو یگدش
هیبش جیاتن هسیاقم اب و هدش لیلحت دودحم یازجا شور اب دنیآرف ادتبا رد .تسا هتفرگ هیبش تحص ،یبرجت جیاتن اب یزاس
-س کزان تبسن ،خساپ هیور شور اب سپس .تسا هدش دییات یزا لدم خساپ عباوت ناونع هب هبنس یورین و قرو یگدش
یزاس
هدش یاهریغتم لایس هنیشیب راشف و سیرتام هشوگ عاعش ،هبنس هشوگ عاعش لماش دنیآرف یاهرتماراپ ،لدم نیا رد .دنا
،یزکرم بیکرت حرط شور اب روظنم نیدب .دنتسه یدورو شیامزآ
هدش لیلحت دودحم یازجا شور اب و یحارط مزلا یاه
-هنیهب ماجنا اب نایاپ رد .دنا اهرتماراپ هنیهب هطقن ،خساپ هیور لدم ساسا رب تیبولطم عبات شور زا هدافتسا اب هفده دنچ یزاس
تسا اب زین اهرتماراپ هنیهب هدودحم نینچمه .تسا هتفرگ رارق یبایزرا دروم سپس و هدمآ تسدب رارق مه یور شور زا هداف
یم ناشن جیاتن .تسا هدش نییعت یروتناک یاهرادومن نداد هیور هک دهد
یم رادروخرب یبوخ تیافک زا خساپ یاه قبط .دنشاب
کزان تبسن شهاک ثعاب سیرتام هشوگ عاعش و هبنس هشوگ عاعش شیازفا لدم نیا هبنس یورین هنیشیب شیازفا و یگدش
یم شیازفا نینچمه .دوش یم هبنس یورین هنیشیب شیازفا ثعاب ،لایس هنیشیب راشف
هنیهب جیاتن .دوش شهاک رگنایب یزاس
کزان تبسن نازیم هب یگدش 01
یم یلومعم تلاح هب تبسن % دشاب
.
![Figure 3. Good agreement between simulation results and experimental results of reference [12]](https://thumb-us.123doks.com/thumbv2/123dok_us/220683.2016580/3.595.317.528.202.571/figure-good-agreement-simulation-results-experimental-results-reference.webp)