progressive multiple sclerosis
Michael P. Pender, … , Alan Coulthard, Rajiv Khanna
JCI Insight.
2018;
3(22)
:e124714.
https://doi.org/10.1172/jci.insight.124714
.
BACKGROUND. Increasing evidence indicates a role for EBV in the pathogenesis of
multiple sclerosis (MS). EBV-infected autoreactive B cells might accumulate in the CNS
because of defective cytotoxic CD8
+T cell immunity. We sought to determine the feasibility
and safety of treating progressive MS patients with autologous EBV-specific T cell therapy.
METHODS. An open-label phase I trial was designed to treat 5 patients with secondary
progressive MS and 5 patients with primary progressive MS with 4 escalating doses of in
vitro–expanded autologous EBV-specific T cells targeting EBV nuclear antigen 1, latent
membrane protein 1 (LMP1), and LMP2A. Following adoptive immunotherapy, we
monitored the patients for safety and clinical responses.
RESULTS. Of the 13 recruited participants, 10 received the full course of T cell therapy.
There were no serious adverse events. Seven patients showed improvement, with 6
experiencing both symptomatic and objective neurological improvement, together with a
reduction in fatigue, improved quality of life, and, in 3 patients, reduced intrathecal IgG
production. All 6 patients receiving T cells with strong EBV reactivity showed clinical
improvement, whereas only 1 of the 4 patients receiving T cells with weak EBV reactivity
showed improvement […]
Clinical Medicine
Clinical trials
Neuroscience
Find the latest version:
Role of the funding source: The funders of the study had no role in the study design, data collection, data analysis, data interpretation, or the writing of the manuscript. The corresponding authors had full access to all the data in the study and had final responsibility for the decision to submit for publication.
Conflict of interest: MPP has received consulting fees and research funding from Atara Biotherapeutics and is a member of the Neurology Clinical Advisory Panel of Atara Biotherapeutics. CS has received consulting fees from Atara Biotherapeutics. SB is a member of the advisory boards of Roche, Sanofi Genzyme, Merck, and Teva. KAG has received personal fees from Roche and travel support from Sanofi Aventis. AS has received educational and travel support from Merck Serono Australia. KDH is a member of the advisory boards of Merck Serono Australia, Biogen Australia, and Roche Australia. BTA is an employee of, and owns equity shares in, Atara Biotherapeutics. SRB has received a license fee payment from Atara Biotherapeutics. AC has received a consulting fee from Sanofi Genzyme. RK is a consultant and member of the scientific advisory board of Atara Biotherapeutics and has received a license fee payment and research funding from Atara Biotherapeutics.
License: Copyright 2018, American Society for Clinical Investigation.
Submitted: September 11, 2018
Accepted: October 16, 2018
Published: November 15, 2018
Reference information:
JCI Insight. 2018;3(22):e124714. https://doi.org/10.1172/jci. insight.124714.
Epstein-Barr virus–specific T cell therapy
for progressive multiple sclerosis
Michael P. Pender,1,2,3 Peter A. Csurhes,1,4 Corey Smith,3 Nanette L. Douglas,1,2 Michelle A. Neller,3
Katherine K. Matthews,3 Leone Beagley,3 Sweera Rehan,3 Pauline Crooks,3 Tracey J. Hopkins,5
Stefan Blum,1,2 Kerryn A. Green,1,2 Zara A. Ioannides,1,2 Andrew Swayne,1,2 Blake T. Aftab,6
Kaye D. Hooper,1,2 Scott R. Burrows,1,3 Kate M. Thompson,7,8 Alan Coulthard,1,9 and Rajiv Khanna1,3
1Faculty of Medicine, The University of Queensland, Brisbane, Queensland, Australia. 2Department of Neurology, Royal
Brisbane and Women’s Hospital, Brisbane, Queensland, Australia. 3QIMR Berghofer Centre for Immunotherapy and
Vaccine Development, QIMR Berghofer Medical Research Institute, Brisbane, Queensland, Australia. 4The University
of Queensland Centre for Clinical Research, Brisbane, Queensland, Australia. 5Internal Medicine Day Treatment Unit,
Royal Brisbane and Women’s Hospital, Brisbane, Queensland, Australia. 6Preclinical Science and Translational Medicine,
Atara Biotherapeutics, South San Francisco, California, USA. 7Department of Psychology, Royal Brisbane and Women’s
Hospital, Brisbane, Queensland, Australia. 8Faculty of Health and Behavioural Sciences, The University of Queensland,
Brisbane, Queensland, Australia. 9Department of Medical Imaging, Royal Brisbane and Women’s Hospital, Brisbane,
Queensland, Australia.
Introduction
Multiple sclerosis (MS) is a chronic inflammatory demyelinating disease of the CNS causing progres-sive disability. Genetic and environmental factors both contribute to the risk of developing MS. Over the last 40 years there has been steadily increasing evidence that infection with EBV has a role in the development of MS (1, 2). Multiple independent studies have confirmed the universality of EBV infec-tion in MS (3) and the presence of high titers of anti-EBV antibodies in the sera both during the clinical course of MS (4) and before the clinical onset of MS (5).
BACKGROUND. Increasing evidence indicates a role for EBV in the pathogenesis of multiple sclerosis (MS). EBV-infected autoreactive B cells might accumulate in the CNS because of defective cytotoxic CD8+ T cell immunity. We sought to determine the feasibility and safety of treating progressive MS
patients with autologous EBV-specific T cell therapy.
METHODS. An open-label phase I trial was designed to treat 5 patients with secondary progressive MS and 5 patients with primary progressive MS with 4 escalating doses of in vitro–expanded autologous EBV-specific T cells targeting EBV nuclear antigen 1, latent membrane protein 1 (LMP1), and LMP2A. Following adoptive immunotherapy, we monitored the patients for safety and clinical responses.
RESULTS. Of the 13 recruited participants, 10 received the full course of T cell therapy. There were no serious adverse events. Seven patients showed improvement, with 6 experiencing both symptomatic and objective neurological improvement, together with a reduction in fatigue, improved quality of life, and, in 3 patients, reduced intrathecal IgG production. All 6 patients receiving T cells with strong EBV reactivity showed clinical improvement, whereas only 1 of the 4 patients receiving T cells with weak EBV reactivity showed improvement (P = 0.033, Fisher’s exact test).
CONCLUSION. EBV-specific adoptive T cell therapy was well tolerated. Clinical improvement following treatment was associated with the potency of EBV-specific reactivity of the administered T cells. Further clinical trials are warranted to determine the efficacy of EBV-specific T cell therapy in MS.
TRIAL REGISTRATION. Australian New Zealand Clinical Trials Registry, ACTRN12615000422527.
EBV is unique among the viruses infecting humans in its ability to infect, activate, and clonally expand B lymphocytes and then persist as a latent infection within these cells. It infects ≈90% of the adult population worldwide and persists for the lifetime of the infected individual, with latency in B cells and reactivation as a lytic infection in plasma cells and tonsillar epithelial cells, whence it is shed into saliva for transmission to new hosts. In health, the number of EBV-infected cells is kept under stringent immune control, particularly by EBV-specific cytotoxic CD8+ T cells, which kill proliferating and lytically infected cells (6). The vital role
of immune surveillance in the control of EBV infection is demonstrated by the occurrence of EBV-positive B cell lymphoproliferative disorders in the immunosuppressed. In 2003, we proposed the hypothesis that a defect in the CD8+ T cell control of EBV predisposes to MS by allowing EBV-infected autoreactive B cells and
plasma cells to accumulate in the CNS (7). This hypothesis is supported by reports of an accumulation of EBV- infected B cells and plasma cells in the brain in MS (8–11); however, other studies have failed to detect evidence of EBV infection in the brain (12, 13). A crucial prediction derived from this hypothesis is that EBV-specific T cell therapy should kill EBV-infected B cells in the CNS and thereby prevent disease progression and lead to clinical improvement (7, 14). We have shown that, despite the quantitative deficiency of EBV-specific CD8+ T
cells in MS patients (15, 16), it is possible to generate EBV-specific CD8+ T cell lines from these patients by in
vitro stimulation with EBV antigens (15), suggesting that EBV-specific T cell therapy might be feasible. AdE1-LMPpoly is a novel adenoviral vector encoding CD8+ T cell epitopes from EBV nuclear antigen 1
(EBNA1), latent membrane protein 1 (LMP1), and LMP2A, which has been used to stimulate and expand EBV-specific CD8+ T cells in patients with nasopharyngeal carcinoma, where the cancer cells express these
3 EBV proteins (17, 18). Because EBV-infected B cells in the brain in MS express the same 3 EBV proteins (8, 19), we considered that T cells expanded with AdE1-LMPpoly might kill EBV-infected B cells in the CNS and thereby benefit patients with MS. In 2013, we first treated an MS patient with EBV-specific T cell therapy through the Special Access Scheme of the Australian Government Therapeutic Goods Adminis-tration (20). The patient was a 42-year-old man with secondary progressive MS (SPMS) and an Expanded Disability Status Scale (EDSS) score (21) of 8.0. Treatment with 4 escalating doses of autologous EBV-spe-cific T cells was followed by clinical improvement and decreased cerebrospinal fluid (CSF) IgG production, both of which were sustained for 3.5 years after T cell therapy.
In this investigator-led phase I clinical trial, we sought to expand on this single-patient finding to deter-mine whether autologous LMP/EBNA1-specific T cells can be generated to clinical scale from the blood of patients with progressive MS and to assess the safety and tolerability of adoptive transfer of LMP/ EBNA1-specific T cells into patients with progressive MS. Our plan was to treat 10 patients, 5 with SPMS and 5 with primary progressive MS (PPMS).
Results
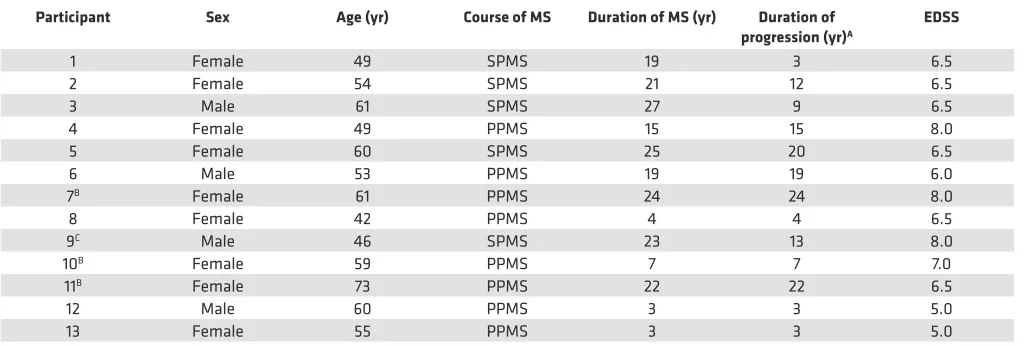
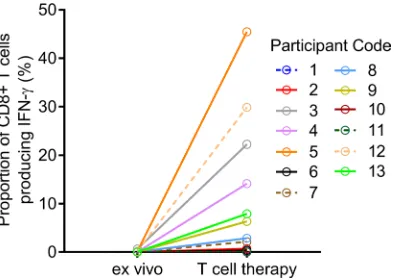
Adoptive T cell therapy characterization and clinical safety. Thirteen participants were enrolled (Figure 1 and Table 1). The mean duration of disease progression was 11.8 ± 7.7 years. For 11 of the 13 participants, EBV-specific T cells were successfully produced to clinical scale from their peripheral blood mononuclear cells (PBMCs) following in vitro expansion (Figure 2), with a median specificity of 6.3% (range, 0.34%– 45.45%) of CD8+ T cells in patients with detectable antigen-specific T cells. The HLA restriction and
anti-gen specificity of the patient-specific T cell responses are provided in Table 2. The failure to anti-generate T cells in 2 participants (participants 10 and 11) is likely due to a lack of HLA matching of the patients with T cell epitopes encoded in the vector. Ten patients (5 with SPMS and 5 with PPMS) each received 4 escalating doses of T cells in accordance with the protocol, including 1 SPMS patient (participant 9) who had been treated 4 years earlier through the Special Access Scheme (20). The remaining 3 patients (participants 7, 10, and 11) were withdrawn prior to receiving cell therapy: 1 for an unrelated diagnosis of malignancy and 2 owing to an inability to generate EBV-specific T cells (Figure 1).
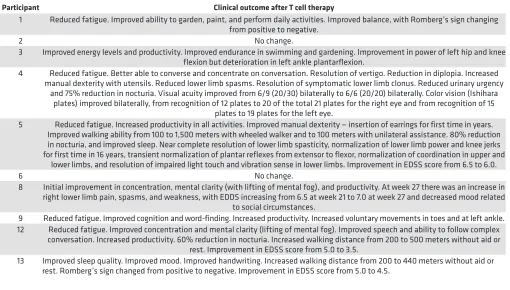
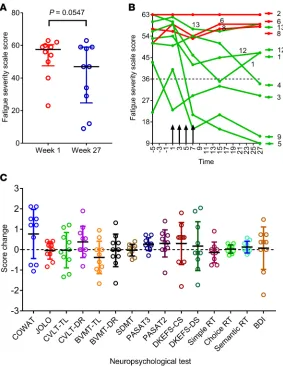
Clinical outcomes following T cell therapy. Seven participants (participants 1, 3, 4, 5, 9, 12, and 13) showed clinical improvement. Six (participants 1, 4, 5, 9, 12, and 13) experienced both symptomatic and objective neurological improvement, which commenced 2–14 weeks after the first infusion (Table 4) and which was accompanied by a reduction in EDSS score in 3 patients (participants 5, 12, and 13). Another patient (partici-pant 3) also had symptomatic improvement but without objective neurological improvement. Of the 3 patients not showing improvement, 2 (participants 2 and 6) remained stable throughout the observation period and 1 (participant 8) had initial symptomatic improvement but deterioration with an increase in EDSS score at the end of the monitoring period in the setting of heightened psychosocial stressors. The median Fatigue Severity Scale score (22) for the combined group of 10 treated patients was lower at week 27 than at week 1 (P = 0.0547; Wilcoxon matched-pairs signed-rank test) (Figure 3A). This score was also lower at week 7 and at week 15 compared with week 1, although not significantly so (P = 0.0742 and P =0.1797, respectively). Reduction in fatigue was a prominent feature in 5 of the patients experiencing neurological improvement (participants 1, 4, 5, 9, and 12) (Figure 3B). Furthermore, the patients showing improvement also reported improved quality of life (QOL) (23). The Montreal Cognitive Assessment score (24) was not helpful in monitoring the response to treatment because it increased after the first two iterations of the assessment at weeks 1 and 7, likely indicative of item-specific practice effects related to participant familiarity with the test material.
Figure 3C shows the results of the 15 components of the comprehensive neuropsychological assess-ment (25) before and after T cell therapy. Importantly, the performances after T cell therapy were highly comparable to those observed at baseline, suggesting that T cell therapy did not lead to cognitive deteri-oration. Statistically significant, or nearly significant, increases in attainment were observed at week 27 across two measures, the Controlled Oral Word Association Test (COWAT, a verbal fluency test) and the
Paced Auditory Serial Addition Test (PASAT3, a working memory/processing speed task) (P = 0.074 and P = 0.0235 respectively, paired 2-tailed t test); however, after applying the Bonferroni correction for mul-tiple comparisons, these P values no longer reached significance. Finally, 2 participants (participants 2 and 8) exhibited an increase in depressive symptomatology, both on formal psychometric testing with the Beck Depression Inventory (26) and the 2 screening questions for depression (27), arising in the context of heightened psychosocial stressors.
The MRI brain scan findings are presented in Table 5. Five of the ten patients receiving T cell therapy (participants 1, 4, 6, 8, and 9) had 1 gadolinium-enhancing MRI brain lesion at baseline. In participant 6, the enhancing lesion did not change throughout the observation period and was thought to be unrelated to MS. In addition to participant 6, 4 patients (participants 1, 4, 9, and 12) had 1–4 enhancing lesions at week 15. Compared with baseline, the number of enhancing lesions at week 15 increased in 3 participants (participants 4, 9, and 12) and decreased in 1 participant (participant 8); each of the 3 participants with increased enhancing lesions showed neurological improvement. Two patients (participants 4 and 9) had 1–2 enhancing lesions at week 27.
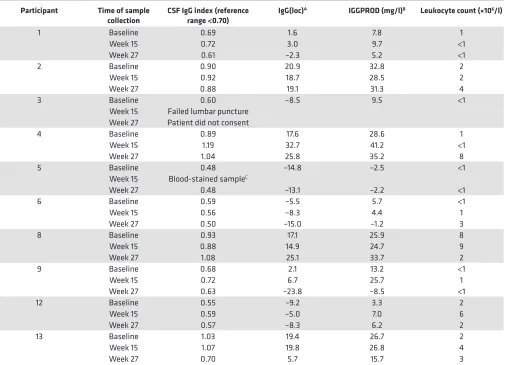
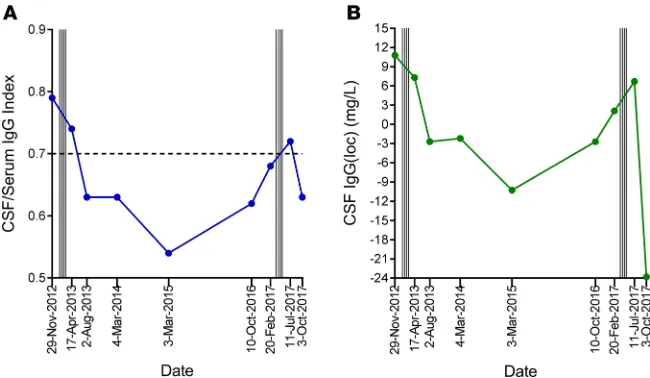
CSF IgG analysis was performed before and after T cell therapy in 9 patients; 1 patient declined fol-low-up lumbar puncture (Table 6). The CSF IgG index and intrathecal IgG synthesis had decreased at week 27 compared with baseline in 4 of the 9 patients (participants 1, 6, 9, and 13), 3 of whom showed neurolog-ical improvement (participants 1, 9, and 13). There was no detectable change in the pattern of CSF oligo-clonal IgG bands after T cell therapy. Notably, in participant 9, whom we first treated with EBV-specific T cell therapy in 2013 and treated again in 2017 in this trial, the CSF IgG index and intrathecal IgG synthesis decreased after the first course of treatment in association with clinical improvement (20), increased 3.5 years after treatment in association with worsening symptoms, and again decreased after retreatment, in association with clinical improvement (Figure 4).
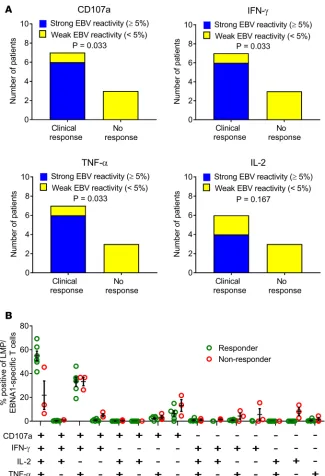
Relationship between adoptive T cell therapy and clinical response. To assess the role of T cell specificity in disease control, we assessed the frequency and polyfunctional activity of EBV-specific T cells gener-ated for adoptive immunotherapy. Neither the patients nor the examining neurologists were aware of the level of EBV reactivity within the T cell product, thus minimizing the potential for bias. Clinical improvement was associated with a higher frequency of EBV-specific CD8+ T cells in the administered
product (Figure 5A). All 6 patients receiving T cells with strong EBV reactivity (frequency >5% of
CD8+ T cells) showed clinical improvement, with 3 patients showing an improvement in EDSS score,
whereas only 1 of the 4 patients receiving T cells with weak EBV reactivity (frequency <5% of CD8+ T
cells) showed improvement and no change in EDSS score (P = 0.033 for CD107a, IFN-γ, and TNF-α;
P = 0.167 for IL-2, Fisher’s exact test). QOL significantly improved in patients receiving T cells with strong EBV reactivity compared with those receiving T cells with weak EBV reactivity (P = 0.0381,
Table 1. Characteristics of patients at enrollment in this study
Participant Sex Age (yr) Course of MS Duration of MS (yr) Duration of
progression (yr)A EDSS
1 Female 49 SPMS 19 3 6.5
2 Female 54 SPMS 21 12 6.5
3 Male 61 SPMS 27 9 6.5
4 Female 49 PPMS 15 15 8.0
5 Female 60 SPMS 25 20 6.5
6 Male 53 PPMS 19 19 6.0
7B Female 61 PPMS 24 24 8.0
8 Female 42 PPMS 4 4 6.5
9C Male 46 SPMS 23 13 8.0
10B Female 59 PPMS 7 7 7.0
11B Female 73 PPMS 22 22 6.5
12 Male 60 PPMS 3 3 5.0
13 Female 55 PPMS 3 3 5.0
ADuration of progressive phase of MS. BThese participants did not receive EBV-specific T cell therapy. CTreated with EBV-specific T cell therapy 4 years
Mann–Whitney test). These observations were supported by the presence of a higher proportion of EBV-specific polyfunctional T cells (expressing CD107a, IFN-γ, TNF-α, and IL-2) in the T cell therapy administered to participants showing clinical improvement than in the therapy administered to par-ticipants not showing clinical improvement (Figure 5B) (P < 0.0001, multiple 2-tailed t test with the Holm-Sidak correction for multiple comparisons). This polyfunctional T cell profile, particularly the coexpression of IL-2, is associated with improved viral control in other settings.
Discussion
This is the first report to our knowledge of a prospective clinical trial of autologous EBV-specific T cell thera-py in MS. Autologous T cell therathera-py for MS patients in this study was safe and well tolerated, with no serious AEs, and the only AE definitely related to treatment was transient dysgeusia in 1 participant. Despite the fact that all the treated participants had progressive MS, only 1 patient had neurological deterioration during the study, and this occurred at the end of the observation period in the setting of psychosocial stress. Seven patients experienced clinical improvement. Although this was an uncontrolled study, our finding of a substan-tial relationship between clinical response and EBV reactivity and polyfunctionality of the T cell product, of which both the patients and examining neurologists were unaware, suggests that the clinical benefit might be due to the T cell therapy. All 6 participants receiving T cells with strong EBV reactivity experienced clinical improvement, with 3 patients showing an improvement in EDSS score, whereas only 1 of the 4 participants receiving T cells with weak EBV reactivity showed improvement and no change in EDSS score. The clinical improvements occurred in patients who had experienced progressive neurological deterioration for a mean of 10.1 ± 6.7 years prior to T cell therapy and did not represent resolution of acute MS relapses.
Figure 2. Expansion of EBV-specific T cells from MS patients. PBMCs (ex vivo) or T cells stimulated with AdE1-LMPpoly (T cell therapy) were assessed for the intracellular production of IFN-γ following recall with a peptide pool of CD8+ T cell epitopes encoded by EBNA1,
LMP1, and LMP2A. Data represent the proportions of CD8+ T lymphocytes producing IFN-γ.
Table 2. EBV-specific reactivity of in vitro–expanded T cells from MS patients
Participant Proportion of CD8+ T cells producing IFN-γ
(%) Antigen specificity of T cell therapy HLA restriction of T cell therapy
1 0.4 EBNA1 N.A.
2 0.72 LMP2A B*14:02
3 22.25 LMP2A A*25:01
4 14.16 EBNA1, LMP2A B*07:02, B*27:05 5 45.45 EBNA1, LMP1, LMP2A A*02:01, B*57:01
6 0.34 LMP2A A*24:02
7 2.15 EBNA1, LMP1 B*57:01
8 2.87 LMP2A A*02:01
9 6.34 LMP1, LMP2A A*02:01
10 0.01 N.A. N.A.
11 0.06 N.A. N.A.
12 29.85 EBNA1 B*07:02, B*35:01
13 7.90 EBNA1, LMP1, LMP2A A*02:01, B*07:02
Reduction in fatigue, although clearly subjective, was a consistent and prominent feature in patients showing neurological improvement. Fatigue is the most frequent and disabling symptom of MS and is refractory to current disease-modifying therapies. The fact that fatigue may herald the onset of MS, often by years (28), and that it is also a frequent and disabling symptom of acute infectious mononucleosis due to primary EBV infection suggest that fatigue in MS is directly related to poorly controlled EBV infection, which is supported by our observation of a reduction in fatigue following EBV-specific T cell therapy. Although the improvements in the COWAT and PASAT3 components of the neuropsychological test battery might be explained by practice effects, these components warrant further scrutiny in a controlled trial.
Clinical improvement occurred in patients with PPMS as well as in patients with SPMS; 3 of the 5 participants with PPMS and 4 of the 5 participants with SPMS showed improvement. We postulate that clinical improvement results from the killing of EBV-infected B cells in the CNS by the
adoptive-ly transferred CD8+ T cells, thereby preventing further autoimmune attack on the CNS and allowing
Table 3. Treatment-related adverse events
Adverse event Causality No. of events by CTCAE grade Total no. of SAEs
1 2 3 4 5
Altered taste Definite 3A 0
Nausea Possible 1A 1 0
Dizziness Possible 1A 0
Insomnia Possible 1A 0
This table includes all adverse events judged to be possibly related, probably related, or definitely related to T cell therapy. AAll these events occurred in the
same participant (participant 1). CTCAE, Common Terminology Criteria for Adverse Events version 4.03 (1, mild; 2, moderate; 3, severe; 4, life-threatening; 5, death); SAEs, serious adverse events.
Table 4. Clinical response to T cell therapy
Participant Clinical outcome after T cell therapy
1 Reduced fatigue. Improved ability to garden, paint, and perform daily activities. Improved balance, with Romberg’s sign changing from positive to negative.
2 No change.
3 Improved energy levels and productivity. Improved endurance in swimming and gardening. Improvement in power of left hip and knee flexion but deterioration in left ankle plantarflexion.
4 Reduced fatigue. Better able to converse and concentrate on conversation. Resolution of vertigo. Reduction in diplopia. Increased manual dexterity with utensils. Reduced lower limb spasms. Resolution of symptomatic lower limb clonus. Reduced urinary urgency
and 75% reduction in nocturia. Visual acuity improved from 6/9 (20/30) bilaterally to 6/6 (20/20) bilaterally. Color vision (Ishihara plates) improved bilaterally, from recognition of 12 plates to 20 of the total 21 plates for the right eye and from recognition of 15
plates to 19 plates for the left eye.
5 Reduced fatigue. Increased productivity in all activities. Improved manual dexterity — insertion of earrings for first time in years. Improved walking ability from 100 to 1,500 meters with wheeled walker and to 100 meters with unilateral assistance. 80% reduction in nocturia, and improved sleep. Near complete resolution of lower limb spasticity, normalization of lower limb power and knee jerks for first time in 16 years, transient normalization of plantar reflexes from extensor to flexor, normalization of coordination in upper and
lower limbs, and resolution of impaired light touch and vibration sense in lower limbs. Improvement in EDSS score from 6.5 to 6.0.
6 No change.
8 Initial improvement in concentration, mental clarity (with lifting of mental fog), and productivity. At week 27 there was an increase in right lower limb pain, spasms, and weakness, with EDDS increasing from 6.5 at week 21 to 7.0 at week 27 and decreased mood related
to social circumstances.
9 Reduced fatigue. Improved cognition and word-finding. Increased productivity. Increased voluntary movements in toes and at left ankle. 12 Reduced fatigue. Improved concentration and mental clarity (lifting of mental fog). Improved speech and ability to follow complex
conversation. Increased productivity. 60% reduction in nocturia. Increased walking distance from 200 to 500 meters without aid or rest. Improvement in EDSS score from 5.0 to 3.5.
neurological recovery through mechanisms, such as remyelination, dendritic and axonal sprouting, and synaptic remodeling. However, it is uncertain whether these recovery mechanisms could have occurred quickly enough to account for the neurological improvement we observed commencing 2–14 weeks after the first T cell infusion. Killing of EBV-infected B cells in lymphoid tissue, including the cervical lymph nodes, where EBV-infected B cells also accumulate in MS (29), might also contribute to the beneficial effect of T cell therapy. The patients experiencing the greatest degree of clinical improvement
Figure 3. Fatigue score and cognitive function after T cell therapy. (A) Fatigue Severity Scale (FSS) (ref. 22) score at week 1, immediately before the first T cell infusion, and at week 27 (n = 10). A total score of 36 (indicated by dot-ted horizontal line in B) or more suggests that a person is suffering from fatigue. The maximum score is 63 and the minimum score is 9. Horizontal bars indicate the medians and interquartile range. P = 0.0547, Wilcoxon matched-pairs signed-rank test. (B) FSS score over time in each of the treated patients. Vertical arrows indicate successive T cell infusions of 5 × 10⁶, 1 × 10⁷, 1.5 × 10⁷, and 2 × 10⁷ cells. Red lines indicate patients showing no symptomatic
improve-ment (participants 2, 6, and 8) and green lines indicate patients showing symptomatic improveimprove-ment (participants 1, 3, 4, 5, 9, 12, and 13). The participant showing the greatest reduction in fatigue (participant 5) received T cells with the highest degree of EBV reactivity (45.45% of CD8+ T cells). (C) Standardized change in scores (means with standard
(participants 5, 12, and 13), as indicated by reduction in EDSS score, had a baseline EDSS of ≤6.5 and received T cells with strong EBV reactivity. In contrast, the patients who received T cells with strong EBV reactivity and had an EDSS score of 8.0 (participants 4 and 9) experienced clinical improvement without a decrease in the EDSS score. This suggests that, in patients with severe neurological disability, irreversible axonal degeneration and neuronal loss limit the capacity for neurological improvement, even if further autoimmune attack on the CNS can be prevented by EBV-specific T cell therapy. Clinical improvement after T cell therapy was also associated with a decrease in intrathecal IgG production in 3 of 6 patients, which can be explained by the killing of EBV-infected B cells and possibly plasma cells in the CNS by the adoptively transferred CD8+ T cells.
Our data add to the mounting evidence for a pathogenic role of EBV infection in MS. Because T cells access all CNS compartments, T cell therapy targeting only EBV-infected B cells is a treatment modality that could offer favorable safety and durable efficacy. Our work sets the stage for further clinical trials with autologous and allogeneic EBV-targeted T cell therapy in MS.
Methods
Study design and participant recruitment. This was an open-label phase I clinical trial. The objectives were (a) to determine if autologous LMP/EBNA1-specific T cells can be generated to clinical scale from the blood of patients with progressive MS and (b) to assess the safety and tolerability of adoptive transfer of LMP/ EBNA1-specific T cells into patients with progressive MS. Participants were recruited through the MS Clin-ic at the Royal Brisbane and Women’s Hospital. Recruitment commenced on 27 November 2015.
The inclusion criteria were as follows: primary progressive or SPMS as defined by the revised McDonald Criteria (30); progressive neurological deterioration due to MS for at least 2 years; positive EBV serology; age 18 years or above; provision of informed consent; EDSS score of 5.0–8.0 (21); and life expectancy of at least 6 months. The exclusion criteria were as follows: serology or nucleic acid testing, indicating infection with human immunodeficiency virus, hepatitis B or C virus, syphilis, or human T cell lymphotropic virus; significant other disease; uncontrolled psychosis, uncontrolled depression, substance dependence, or any other psychiatric condition that might compromise the abil-ity to participate in the trial; inabilabil-ity to provide informed consent; clinically significant abnormalities of full blood count, renal function, or hepatic function; any contraindication to MRI; prior cancers, except those diagnosed >5 years ago with no evidence of disease recurrence and with a clinical expec-tation of recurrence of <5%, or successfully treated nonmelanoma skin cancer, or carcinoma in situ of the cervix; immunomodulatory therapy (apart from short courses of corticosteroids) within the past year; and pregnancy, lactation, or unwillingness to use adequate contraception. Supportive and symp-tomatic care was continued during the trial.
Manufacturing and infusion of adoptive T cell therapy. Following the confirmation of eligibility, 400 ml blood was collected from each participant by venesection (venesection visit) to generate the investigational
Table 5. Brain MRI scan findings after T cell therapy
Participant No. of enhancing T1
lesions at baseline No. of enhancing T1 lesions at week 15 No. of new T2 lesions at week 15 compared with baseline
No. of enhancing T1
lesions at week 27 No. of new T2 lesions at week 27 compared with baseline
1 1 1A 0 0 1
2 0 0 0 0 0
3 0 0 0 0 0
4 1 2 2 2 4
5 0 0 0 0 0
6 1B 1B 0 1B 0
8 1 0 0 0 0
9 1 4 3 1 4
12 0 1 1 0 2
13 0 0 1 0 1
ANewly enhancing lesion in previously existing T2 lesion. BThis lesion was unchanged throughout the trial and was thought to be unrelated to MS and most
product (Figure 1). This product consisted of autologous LMP- and EBNA1-specific T cells in saline and was produced in the Q-Gen Cell Therapeutics facility at QIMR Berghofer Medical Research Institute, utilizing the recombinant adenoviral vector AdE1-LMPpoly. This vector contains multiple LMP1- and
LMP2A-encoded CD8+ T cell epitopes fused to the EBNA1 gene with the glycine-alanine repeat deleted
(17). To generate the T cell product, PBMCs were cocultured with autologous PBMCs (irradiated at 25 gray) infected with AdE1-LMPpoly (multiplicity of infection of 10:1) at a responder-to-stimulator ratio of 2:1, in RPMI 1640 containing 10% fetal bovine serum (growth medium; Thermo Fisher Scientific). On days 2, 5, 8, and 11, the cultures were supplemented with growth medium containing recombinant IL-2 (Proleukin, Novartis Vaccines and Diagnostics Inc.). On day 14, these T cell cultures were assessed for cell yield, viability, and T cell frequency. Specifications for release of the investigational product were (a) favorable sterility and adenovirus test results (analyzed at time of cryopreservation); (b) sufficient cells for 4 infusions; (c) cell viability ≥50%; and (d) proportion of CD3+ T cells ≥50%. Cryovials of the investigational
product (1-ml aliquots) were stored in vapor-phase nitrogen.
Immediately prior to adoptive transfer, a single aliquot of cells was thawed rapidly using a 37°C water bath and then diluted in 19 ml 0.9% sodium chloride for intravenous infusion (Baxter Healthcare). The diluted cells were drawn into a 20-ml syringe and administered intravenously by a research nurse to the
Table 6. CSF IgG analysis and leukocyte count after T cell therapy
Participant Time of sample
collection CSF IgG index (reference range <0.70) IgG(loc)
A IGGPROD (mg/l)B Leukocyte count (×106/l)
1 Baseline 0.69 1.6 7.8 1
Week 15 0.72 3.0 9.7 <1
Week 27 0.61 –2.3 5.2 <1
2 Baseline 0.90 20.9 32.8 2
Week 15 0.92 18.7 28.5 2
Week 27 0.88 19.1 31.3 4
3 Baseline 0.60 –8.5 9.5 <1
Week 15 Failed lumbar puncture Week 27 Patient did not consent
4 Baseline 0.89 17.6 28.6 1
Week 15 1.19 32.7 41.2 <1
Week 27 1.04 25.8 35.2 8
5 Baseline 0.48 –14.8 –2.5 <1
Week 15 Blood-stained sampleC
Week 27 0.48 –13.1 –2.2 <1
6 Baseline 0.59 –5.5 5.7 <1
Week 15 0.56 –8.3 4.4 1
Week 27 0.50 –15.0 –1.2 3
8 Baseline 0.93 17.1 25.9 8
Week 15 0.88 14.9 24.7 9
Week 27 1.08 25.1 33.7 2
9 Baseline 0.68 2.1 13.2 <1
Week 15 0.72 6.7 25.7 1
Week 27 0.63 –23.8 –8.5 <1
12 Baseline 0.55 –9.2 3.3 2
Week 15 0.59 –5.0 7.0 6
Week 27 0.57 –8.3 6.2 2
13 Baseline 1.03 19.4 26.7 2
Week 15 1.07 19.8 26.8 4
Week 27 0.70 5.7 15.7 3
AIntrathecal IgG production [IgG(loc)] was calculated by the formula of Reiber and Felgenhauer (31): IgG(loc) (mg/l) = {(CSF IgG ÷ serum IgG) − [0.8 ×
(√((CSF albumin ÷ serum albumin)2 + 15))] + 1.8} × serum IgG. BIntrathecal IgG production (IGGPROD) was calculated by the formula of Blennow and
colleagues (32): CSF-IgG – [(0.51× CSF albumin × serum-IgG)/serum albumin]. CThe results of this sample were disregarded because the CSF was
patient over 10–15 minutes within 4 hours of thawing. After the infusion of T cells was completed, a 20-ml saline flush was administered to minimize the number of cells remaining in the intravenous line. To reduce the risk of aggravating CNS inflammation, we chose an initial dose of 5 × 10⁶ T cells, which was 25% of
the median dose used to treat nasopharyngeal carcinoma (18), and escalated the dose gradually over the following 3 infusions to 1 × 10⁷, 1.5 × 10⁷, and 2 × 10⁷ cells administered at 2-week intervals (weeks 1, 3,
5, and 7), as in the original patient we treated through the Special Access Scheme (20). The patients were admitted to the Royal Brisbane and Women’s Hospital and closely monitored for 24 hours after each infu-sion. We treated participants consecutively to allow time to detect treatment-related serious AEs. The stop-ping rule for the trial was as follows: If more than 1 grade IV or V AE or more than 1 EDSS deterioration ≥2.0 occurs in the first 4 patients that is directly related to the adoptive transfer of autologous T cells, the trial will be ceased. There was no interim analysis. We monitored the participants for 26 weeks after the first T cell infusion. Neither the patients nor the examining neurologists were aware of the level of EBV reac-tivity within the T cell product, thus minimizing the potential for bias. The follow-up of the last participant was completed on 17 January 2018.
Clinical assessments before and after T cell therapy. We assessed the patients at the venesection visit and at weeks 1, 3, 5, 7, 11, 15, 21, and 27. At the venesection visit we performed the following baseline assess-ments: clinical history and physical examination, including neurological examination and assessment of EDSS score; cognitive assessment; fatigue assessment; screening for depression; QOL assessment; blood testing; brain and spinal cord MRI acquired at 3 Tesla before and after the intravenous injection of gadolinium-containing contrast material (including 3-dimensional T1 and 3-dimensional T2 fluid-at-tenuated inversion recovery sequences for assessment of enhancing lesions and T2 lesions); and lumbar puncture for CSF analysis of intrathecal IgG production. Immediately prior to each adoptive transfer of T cells, O2 saturation, heart rate, blood pressure, temperature, and respiratory rate were recorded. These observations were repeated every 5 minutes for the duration of the infusion, then hourly for 4 hours, and then every 4 hours until discharge, 24 hours after infusion.
Patients were asked about neurological symptoms in a face-to-face interview with a neurologist at all visits following enrollment. At these visits, the neurologist performed a clinical examination, including a detailed neurological examination, and assessed the EDSS score. To evaluate cognitive function, a clini-cal neuropsychologist used a comprehensive neuropsychologiclini-cal test battery to assess the patients at the venesection visit and at week 27. The main component of this test battery was the Minimal Assessment of Cognitive Function in MS, a reliable and validated approach for neuropsychological assessment of MS patients (25). The clinical neuropsychologist also administered the Computerized Test of Information
Figure 5. Relationship between EBV-specific CD8+ T cell reactivity of T cell product and clinical response to T
cell therapy. (A) Relationship between clinical response and the frequency of LMP/EBNA1-specific CD8+ T cells
in the T cell product. Participants were grouped into those receiving T cell therapy with >5% of CD8+ T cells
expressing a given individual cytokine (CD107a, IFN-γ, TNF-α, or IL-2) after recall with a peptide pool of CD8+ T
cell epitopes encoded by EBNA1, LMP1, and LMP2A (strong reactivity) and those receiving T cell therapy with <5% reactivity (weak reactivity). A clinical response to T cell therapy was defined as clinical improvement at week 27 (the last clinical assessment in the study) compared with week 1 (immediately prior to the first T cell infusion). IL-2 expression was not assessed in the cells for participant 12. P values were calculated with Fisher’s exact test; n = 10 for CD107a, IFN-γ, and TNF-α; n = 9 for IL-2. (B) Proportion of LMP/EBNA1-specific CD8+ T cells expressing all
the different combinations of the 4 cytokines (CD107a, IFN-γ, TNF-α, and IL-2) in the participants showing clinical improvement (Responder) compared with the participants not showing clinical improvement (Non-responder). This analysis was not able to be performed on the cells for participant 1 (n = 9). There was a higher proportion of EBV-specific polyfunctional T cells (expressing CD107a, IFN-γ, TNF-α, and IL-2) in the CD8+ T cells within the
Processing, which precisely measures reaction time. Because mood can affect cognition, the clinical neu-ropsychologist assessed depression with the Beck Depression Inventory – Fast Screen for Medical Patients questionnaire (26). In addition, we used the much briefer Montreal Cognitive Assessment (24) to measure cognitive function at the venesection visit and at weeks 1, 7, 15, and 27. To assess fatigue at the same time points, we utilized the Fatigue Severity Scale (22), a self-report scale commonly used to measure fatigue in MS, because it is relatively short, has good psychometric properties, and is sensitive to changes in fatigue. At all visits following enrollment we screened for depression by asking the patients the 2 questions used by Mohr et al. (27), namely, (a) “During the past 2 weeks, have you often been bothered by feeling down, depressed, or hopeless?” and (b) “During the past 2 weeks, have you often been bothered by little interest or pleasure in doing things?” We assessed QOL at the venesection visit and at weeks 1, 7, 15, and 27 with a single question from the MS QOL Instrument; this question asks “Overall, how would you rate your own quality of life?” on a scale from 0 (worst — as bad or worse than being dead) to 10 (best), as used by Cosio et al. (23). MRI of the brain and spinal cord before and after gadolinium and CSF analysis were repeated at the week 15 and week 27 follow-up visits.
The MRI scans were assessed for the number of gadolinium-enhancing lesions and for the develop-ment of new T2 lesions compared with baseline. Blood was collected for full blood count and serum bio-chemistry at all visits. This trial is registered with the Australian New Zealand Clinical Trials Registry (ACTRN12615000422527).
Statistics. All statistical analyses were performed using GraphPad Prism version 7.04. Differences were considered significant at a level of P < 0.05. Changes in the Fatigue Severity Scale score after T cell therapy were statistically analyzed by the Wilcoxon matched-pairs signed-rank test to compare scores before and after T cell therapy (Figure 3A). To analyze changes in the scores for the individual components of the com-prehensive neuropsychological test battery after T cell therapy, the scores for each component before and after T cell therapy were compared using either the paired 2-tailed t test or Wilcoxon matched-pairs signed-rank test, according to formal testing of data distribution using the D’Agostino and Pearson normality test. P values were then corrected for multiple comparisons using the Bonferroni correction. To display the chang-es in scorchang-es for all 15 components in the one graph (Figure 3C), the change in tchang-est score from week 1 to week 27 for each component was standardized by dividing the change in test score by the standard deviation of the week 1 group mean. This enabled the change to be expressed in standard deviations. To analyze the rela-tionship between the clinical response to T cell therapy and the frequency of LMP/EBNA1-specific CD8+
T cells for each of the 4 cytokines (CD107a, IFN-γ, TNF-α, or IL-2) in the administered T cell product (Fig-ure 5A) we used Fisher’s exact test. To assess the relationship between the clinical response to T cell therapy and the polyfunctionality of LMP/EBNA1-specific CD8+ T cells in the administered T cell product (Figure
5B) a multiple 2-tailed t test with the Holm-Sidak correction for multiple comparisons was used.
Study approval. The study was approved by the QIMR Berghofer Human Research Ethics Commit-tee, the Royal Brisbane and Women’s Hospital Human Research Ethics CommitCommit-tee, and The University of Queensland Medical Research Ethics Committee. Participants provided written informed consent.
Author contributions
MPP, MAN, RK, SB, KDH, KKM, and SRB designed the study. MPP, KAG, and KDH recruited the partic-ipants. MPP wrote the first draft of the manuscript. TJH and NLD collected the blood to generate the T cell product. CS, LB, SR, and RK prepared the T cell products. PAC thawed the T cell product prior to adminis-tration and helped analyze the results. NLD coordinated the patient visits and assessments and administered the T cell products. MAN, NLD, and KKM provided oversight of the safety monitoring. ZAI, AS, and KAG obtained the clinical histories and performed the neurological examinations. KMT performed and analyzed the neuropsychological assessments. AC analyzed the MRI brain scans. CS, RK, PC, and BTA analyzed the T cell product. All authors contributed to the conduct of the study and read and approved the final manuscript.
Acknowledgments
Address correspondence to: Michael P. Pender, Faculty of Medicine, The University of Queensland, Level 9, Health Sciences Building, Royal Brisbane and Women’s Hospital, Queensland 4029, Australia. Phone: 61.7.3365.5132; Email: [email protected]. Or to: Rajiv Khanna, QIMR Berghofer Medical Research Institute, Tumour Immunology Laboratory, Department of Immunology, 300 Herston Road, Brisbane, Australia 4006. Phone: 61.7.3362.0385; Email: [email protected].
1. Ascherio A, Munger KL, Lünemann JD. The initiation and prevention of multiple sclerosis. Nat Rev Neurol. 2012;8(11):602–612. 2. Pender MP, Burrows SR. Epstein-Barr virus and multiple sclerosis: potential opportunities for immunotherapy. Clin Transl
Immunology. 2014;3(10):e27.
3. Pakpoor J, et al. The risk of developing multiple sclerosis in individuals seronegative for Epstein-Barr virus: a meta-analysis.
Mult Scler. 2013;19(2):162–166.
4. Sumaya CV, Myers LW, Ellison GW. Epstein-Barr virus antibodies in multiple sclerosis. Arch Neurol. 1980;37(2):94–96. 5. Levin LI, Munger KL, O’Reilly EJ, Falk KI, Ascherio A. Primary infection with the Epstein-Barr virus and risk of multiple
scle-rosis. Ann Neurol. 2010;67(6):824–830.
6. Khanna R, Burrows SR. Role of cytotoxic T lymphocytes in Epstein-Barr virus-associated diseases. Annu Rev Microbiol. 2000;54:19–48.
7. Pender MP. Infection of autoreactive B lymphocytes with EBV, causing chronic autoimmune diseases. Trends Immunol. 2003;24(11):584–588.
8. Serafini B, et al. Dysregulated Epstein-Barr virus infection in the multiple sclerosis brain. J Exp Med. 2007;204(12):2899–2912. 9. Tzartos JS, et al. Association of innate immune activation with latent Epstein-Barr virus in active MS lesions. Neurology.
2012;78(1):15–23.
10. Hassani A, Corboy JR, Al-Salam S, Khan G. Epstein-Barr virus is present in the brain of most cases of multiple sclerosis and may engage more than just B cells. PLoS One. 2018;13(2):e0192109.
11. Moreno MA, et al. Molecular signature of Epstein-Barr virus infection in MS brain lesions. Neurol Neuroimmunol Neuroinflamm. 2018;5(4):e466.
12. Willis SN, et al. Epstein-Barr virus infection is not a characteristic feature of multiple sclerosis brain. Brain. 2009;132(Pt 12):3318–3328.
13. Peferoen LA, et al. Epstein Barr virus is not a characteristic feature in the central nervous system in established multiple sclerosis.
Brain. 2010;133(Pt 5):e137.
14. Pender MP. The essential role of Epstein-Barr virus in the pathogenesis of multiple sclerosis. Neuroscientist. 2011;17(4):351–367. 15. Pender MP, Csurhes PA, Lenarczyk A, Pfluger CM, Burrows SR. Decreased T cell reactivity to Epstein-Barr virus infected
lym-phoblastoid cell lines in multiple sclerosis. J Neurol Neurosurg Psychiatry. 2009;80(5):498–505.
16. Pender MP, Csurhes PA, Burrows JM, Burrows SR. Defective T-cell control of Epstein-Barr virus infection in multiple sclerosis.
Clin Transl Immunology. 2017;6(1):e126.
17. Smith C, et al. Functional reversion of antigen-specific CD8+ T cells from patients with Hodgkin lymphoma following in vitro stimulation with recombinant polyepitope. J Immunol. 2006;177(7):4897–4906.
18. Smith C, et al. Effective treatment of metastatic forms of Epstein-Barr virus-associated nasopharyngeal carcinoma with a novel adenovirus-based adoptive immunotherapy. Cancer Res. 2012;72(5):1116–1125.
19. Serafini B, et al. Epstein-Barr virus latent infection and BAFF expression in B cells in the multiple sclerosis brain: implications for viral persistence and intrathecal B-cell activation. J Neuropathol Exp Neurol. 2010;69(7):677–693.
20. Pender MP, et al. Epstein-Barr virus-specific adoptive immunotherapy for progressive multiple sclerosis. Mult Scler. 2014;20(11):1541–1544.
21. Kurtzke JF. Rating neurologic impairment in multiple sclerosis: an expanded disability status scale (EDSS). Neurology. 1983;33(11):1444–1452.
22. Krupp LB, LaRocca NG, Muir-Nash J, Steinberg AD. The fatigue severity scale. Application to patients with multiple sclerosis and systemic lupus erythematosus. Arch Neurol. 1989;46(10):1121–1123.
23. Cosio D, Jin L, Siddique J, Mohr DC. The effect of telephone-administered cognitive-behavioral therapy on quality of life among patients with multiple sclerosis. Ann Behav Med. 2011;41(2):227–234.
24. Dagenais E, et al. Value of the MoCA test as a screening instrument in multiple sclerosis. Can J Neurol Sci. 2013;40(3):410–415. 25. Migliore S, et al. Validity of the minimal assessment of cognitive function in multiple sclerosis (MACFIMS) in the Italian
popu-lation. Neurol Sci. 2016;37(8):1261–1270.
26. Beck A, Steer R, Brown G. BDI-Fast Screen for Medical Patients: Manual. Pearson Clinical. https://www.pearsonclinical.com/ psychology/products/100000173/bdi--fastscreen-for-medical-patients-bdi.html. Accessed October 25, 2018.
27. Mohr DC, Hart SL, Julian L, Tasch ES. Screening for depression among patients with multiple sclerosis: two questions may be enough. Mult Scler. 2007;13(2):215–219.
28. Berger JR, Pocoski J, Preblick R, Boklage S. Fatigue heralding multiple sclerosis. Mult Scler. 2013;19(11):1526–1532. 29. Serafini B, Rosicarelli B, Aloisi F, Stigliano E. Epstein-Barr virus in the central nervous system and cervical lymph node of a
patient with primary progressive multiple sclerosis. J Neuropathol Exp Neurol. 2014;73(7):729–731.
30. Polman CH, et al. Diagnostic criteria for multiple sclerosis: 2010 revisions to the McDonald criteria. Ann Neurol. 2011;69(2):292–302.
31. Reiber H, Felgenhauer K. Protein transfer at the blood cerebrospinal fluid barrier and the quantitation of the humoral immune response within the central nervous system. Clin Chim Acta. 1987;163(3):319–328.