SHort queStIoNS for SurVeyS ABout BreAd ANd
CereAl INtAke: CoMPArINg MeASureS of quANtIty
VerSuS frequeNCy
Anna Rangan, Tim Gill and Karen Webb NSW Centre for Public Health Nutrition The University of Sydney
The use of short questions in population surveys can provide valuable information on food habits and how these habits change. In order to monitor trends in diet and make comparisons, standardised survey questions must be maintained over time. However, occasionally it may be desirable to replace older questions with improved ones. This study was commissioned by the NSW Adult Health Survey Program to compare the responses provided to older and more recent versions of questions to improve the data collected in health surveys on food habits.
INtroduCtIoN
Information about population food consumption patterns and how these are changing is important for planning and improving nutrition-related health programs and services. Although a national system of on-going nutrition surveillance, based on detailed assessment of dietary intakes, has been recommended for Australia, standardised short questions about food habits, which can be included in population surveys at minimal cost, can provide valuable information on some indicators of diet relevant to dietary guidelines and other nutrition policies.1 The advantages of using these types of questions are:
they impose a low respondent burden and yield higher response rates than other dietary assessment methods they can be administered by telephone or mail responses can be readily and rapidly analysed and reported.2
However, short questions supply only limited information on aspects of food consumption and they are therefore used mainly to classify people into broad groups of ‘higher’ and ‘lower’ intakes and ‘frequent’ or ‘infrequent’ consumption, and to classify types of foods within a category. Short questions cannot provide accurate quantitative estimates of food or nutrient intake; they are mainly useful for surveying groups, not individuals; and they may not be sensitive enough to detect small but important changes over time.2 Short questions are increasingly being used by state and territory health departments, national data collection and information agencies, community dieticians, public health nutritionists and epidemiologists.
The validity of several short questions about food habits has been evaluated in adults.2,3 Among short questions relating to bread and cereal intake, only those about frequency (but not quantity) have been previously validity-tested.3 The results showed that, compared to 3-day weighed records, reported frequency of intake was relatively accurate, •
• •
although subjects at the upper end of the distribution for quantity tended to overestimate their frequency of consumption while subjects at the lower end tended to underestimate their frequency of intake.
An important principle in monitoring trends in diet is to maintain standardised survey questions, so as to enable comparisons over time.2 However, experience suggests that some survey questions are more difficult for respondents to answer than others, and therefore it is necessary, on occasions, to revise the questions. When replacing one short question with another, it is recommended there be a period of overlap so that the agency doing the survey can obtain comparable data, while calibrating the old question to the new.
Information about bread and cereal consumption is useful in monitoring population adherence to the Australian Dietary Guideline that recommends ‘eating plenty of cereals (including bread, rice, pasta and noodles)’.4 The 1995 National Nutrition Survey, using a more detailed dietary assessment, found that only a small proportion of people met the recommended number of serves (adjusted for age, sex and energy intake) of bread and cereals.5 It is therefore appropriate that health surveys include short questions in an attempt to monitor the direction of change in habits relating to these foods.
Prior to 2002, the NSW Adult Health Survey Program6 assessed bread and cereal intake using three short questions relating to the quantity consumed. These questions were replaced after a period of overlap with three new short questions relating to frequency of intake (Box 1). The reason for changing the questions was that frequency questions appeared easier for respondents to answer, and would not compromise validity, given study results showing a correlation between frequency and quantity of intake.3 This paper reports on the comparison of the responses to three short survey questions on the frequency and quantity of bread and cereal consumption used in the 2002 NSW Adult Health Survey.
MetHodS
bread, breakfast cereals or cooked cereals (see Box 1). Direct comparisons were made for each pair of questions dealing with quantity and frequency of bread, breakfast cereal and cooked cereal intake.
The distribution of responses for each short question was determined, using SPSS to recode the responses, to
Box 1
SHort SurVey queStIoNS ABout tHe quANtIty ANd frequeNCy of BreAd ANd CereAl CoNSuMPtIoN uSed IN tHe New SoutH wAleS Adult HeAltH SurVey 2002
‘old’ queStIoNS relAtINg to quANtIty of INtAke
How many slices of bread do you usually eat each day? (one slice of bread is equal to 1 small bread roll or 1 bagel or ½ a large bread roll or ½ bread muffin or 1 scone or ½ a pita bread)
How many cups of breakfast cereal do you usually eat each day? (one cup is equal to 1 cup of cornflakes or other flake-based muesli; 2 weetbix; ½ cup of cooked porridge; 1/3 cup of oat-based muesli or ½ cup of allbran) How many cups of cooked pasta, rice, noodles or other cooked cereals do you usually eat each week? (not including cooked breakfast cereals)
response options:
Number of slices/cups per day Number of slices/cups per week
Don’t eat bread/breakfast cereal/cooked cereal Don’t know
Refused
‘New’ queStIoNS relAtINg to frequeNCy of INtAke
How often do you usually eat bread? (include bread rolls, flat breads, crumpets, bagels, English or bread type muffins)
How often do you eat breakfast cereal? (ready-made, home-made or cooked) How often do you eat pasta, rice, noodles or other cooked cereals? (not including cooked breakfast cereals)
response options:
Number of times per day Number of times per week Times per month
Rarely or never Don’t know Refused 1.
2.
3.
1.
2.
3.
provide daily (for bread and breakfast cereal) or weekly (for cooked cereal foods) estimates of the frequency or number of serves. Spearman’s correlation coefficients were used to assess the relationships between the non-parametric continuous data on quantity and frequency of intake. To assess agreement between categories on both questions a weighted kappa was calculated for each of the three comparisons. A weighted kappa is used for ordinal data, with higher weights given to categories furthest away from perfect agreement. For this analysis, responses for each of the quantity and frequency questions were classified into four groups using cut-points based on standard serves (quantity) and suggested by the distribution (frequency). Subgroup analyses were conducted for males and females and three age groups (16–34 years, 35–54 years, and 55 years and over).
SPSS 12.0.1 for Windows (SPSS Inc) was used for all statistical analyses except weighted kappas, which were calculated usingSAS version 8 (SAS Institute).
reSultS
The study population consisted of a total of 12,622 adult respondents, aged between 17 and 95 years (mean age was 52 years). Males were slightly under-represented (42.1 per cent) and females over-represented (57.9 per cent) in the survey sample, compared to 49.7 per cent males and 50.3 per cent females in the NSW population.6 The sample was older than the NSW population with 46.5 per cent aged 55 years or over compared with 21.9 per cent, but the number of people born in Australia was similar (74 per cent and 70.5 per cent, respectively). The sample characteristics are further described in the Adult Health Survey 2002 report. 6
The ‘new’ short questions on frequency of bread and cereal consumption were answered by 12,491 adults, giving an item-response rate of 99.0 per cent. Of these people, 12,389 also responded to one of the ‘old’ survey questions about quantity of consumption: 4074 for bread consumption, 4172 for breakfast cereal consumption, and 4143 for cooked cereal consumption.
Bread consumption
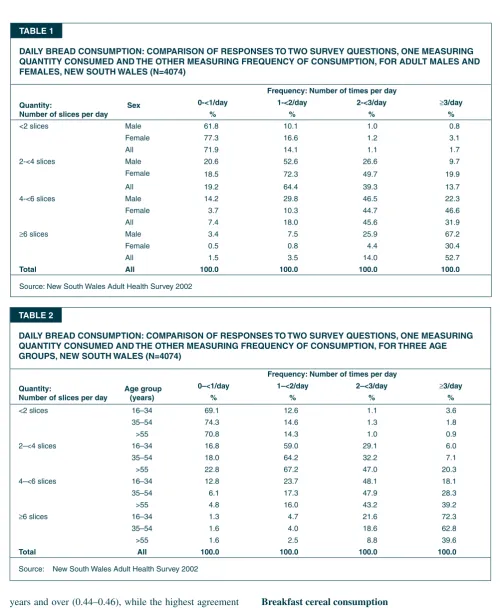
The comparison between reported quantity and frequency of daily bread consumption is presented in Table 1. The following examples illustrate how to interpret this table. Among respondents who consumed bread less than once a day, 71.9 per cent consumed less than two slices per day. Among those who reported consuming bread three or more times a day, 52.7 per cent consumed six or more slices per day.
years and over (0.44–0.46), while the highest agreement was found for those in the younger age groups (0.53–0.55). In the age group 55 years and over, respondents who consumed bread three or more times a day, ate fewer slices of bread than those in younger age groups (Table 2). The Spearman’s correlation coefficient was 0.67 for all persons, and ranged between 0.62 (males) and 0.72 (35-54 years) for subgroup analysis.
Breakfast cereal consumption
The comparison between reported quantity and frequency of daily consumption of breakfast cereal is presented in Table 3. The weighted kappa for all persons was 0.77, with the lowest agreement (kappa values) being for those aged 16–34 years (0.71) and the highest for females (0.79).These kappa values suggest good agreement between the two tABle 1
dAIly BreAd CoNSuMPtIoN: CoMPArISoN of reSPoNSeS to two SurVey queStIoNS, oNe MeASurINg quANtIty CoNSuMed ANd tHe otHer MeASurINg frequeNCy of CoNSuMPtIoN, for Adult MAleS ANd feMAleS, New SoutH wAleS (N=4074)
quantity:
Number of slices per day Sex
frequency: Number of times per day
0-<1/day 1-<2/day 2-<3/day ≥3/day
% % % %
<2 slices Male 61.8 10.1 1.0 0.8
Female 77.3 16.6 1.2 3.1
All 71.9 14.1 1.1 1.7
2-<4 slices Male 20.6 52.6 26.6 9.7
Female 18.5 72.3 49.7 19.9
All 19.2 64.4 39.3 13.7
4-<6 slices Male 14.2 29.8 46.5 22.3
Female 3.7 10.3 44.7 46.6
All 7.4 18.0 45.6 31.9
≥6 slices Male 3.4 7.5 25.9 67.2
Female 0.5 0.8 4.4 30.4
All 1.5 3.5 14.0 52.7
total All 100.0 100.0 100.0 100.0
Source: New South Wales Adult Health Survey 2002
tABle 2
dAIly BreAd CoNSuMPtIoN: CoMPArISoN of reSPoNSeS to two SurVey queStIoNS, oNe MeASurINg quANtIty CoNSuMed ANd tHe otHer MeASurINg frequeNCy of CoNSuMPtIoN, for tHree Age grouPS, New SoutH wAleS (N=4074)
quantity:
Number of slices per day Age group (years)
frequency: Number of times per day
0–<1/day 1–<2/day 2–<3/day ≥3/day
% % % %
<2 slices 16–34 69.1 12.6 1.1 3.6
35–54 74.3 14.6 1.3 1.8
>55 70.8 14.3 1.0 0.9
2–<4 slices 16–34 16.8 59.0 29.1 6.0
35–54 18.0 64.2 32.2 7.1
>55 22.8 67.2 47.0 20.3
4–<6 slices 16–34 12.8 23.7 48.1 18.1
35–54 6.1 17.3 47.9 28.3
>55 4.8 16.0 43.2 39.2
≥6 slices 16–34 1.3 4.7 21.6 72.3
35–54 1.6 4.0 18.6 62.8
>55 1.6 2.5 8.8 39.6
total All 100.0 100.0 100.0 100.0
questions.7 The Spearman’s correlation coefficients ranged from 0.85 (55 years and over) to 0.91 (35–54 years). Cooked cereal foods consumption (pasta, rice, noodles, other)
The agreement between the reported quantity and frequency of cooked cereal foods consumed was similar to that of the
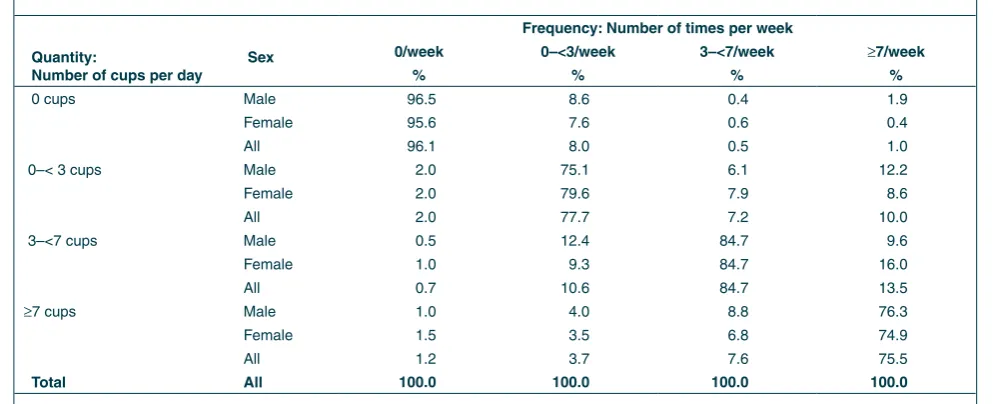
breakfast cereal consumption, with an overall weighted kappa of 0.75 (Table 4). Weighted kappas were similar (0.73–0.76) for males and females and all three age groups. Spearman’s correlation coefficient was 0.84 for all persons, and ranged between 0.81 (16–34 years and 35–54 years) and 0.85 (55 years and over and all females) for subgroup analyses.
tABle 3
dAIly BreAkfASt CereAl CoNSuMPtIoN: CoMPArISoN of reSPoNSeS to two SurVey queStIoNS, oNe MeASurINg quANtIty CoNSuMed ANd tHe otHer MeASurINg frequeNCy of CoNSuMPtIoN, for Adult MAleS ANd feMAleS, New SoutH wAleS (N=4172)
quantity: Number of cups
Sex
frequency: Number of times per day
0/day 0–<1/day 1–<2/day ≥2/day
% % % %
0 cups Male 99.9 10.4 0.1 0.0
Female 98.4 9.5 0.0 0.0
All 98.7 9.8 0.0 0.0
0–< 1cup Male 0.8 52.1 2.6 7.7
Female 0.9 56.8 6.3 0.0
All 0.8 55.0 4.8 5.6
1–<2 cups Male 0.2 29.3 66.1 7.7
Female 0.7 29.7 80.6 60.0
All 0.5 29.5 74.6 22.2
≥2 cups Male 0.0 8.2 31.1 84.6
Female 0.0 4.0 13.1 40.0
All 0.0 5.7 20.6 72.2
total All 100.0 100.0 100.0 100.0
Source: New South Wales Adult Health Survey 2002
tABle 4
dAIly Cooked CereAl CoNSuMPtIoN: CoMPArISoN of reSPoNSeS to two SurVey queStIoNS, oNe MeASurINg quANtIty CoNSuMed ANd tHe otHer MeASurINg frequeNCy of CoNSuMPtIoN, for Adult MAleS ANd feMAleS, New SoutH wAleS (N=4143)
quantity:
Number of cups per day
Sex
frequency: Number of times per week
0/week 0–<3/week 3–<7/week ≥7/week
% % % %
0 cups Male 96.5 8.6 0.4 1.9
Female 95.6 7.6 0.6 0.4
All 96.1 8.0 0.5 1.0
0–< 3 cups Male 2.0 75.1 6.1 12.2
Female 2.0 79.6 7.9 8.6
All 2.0 77.7 7.2 10.0
3–<7 cups Male 0.5 12.4 84.7 9.6
Female 1.0 9.3 84.7 16.0
All 0.7 10.6 84.7 13.5
≥7 cups Male 1.0 4.0 8.8 76.3
Female 1.5 3.5 6.8 74.9
All 1.2 3.7 7.6 75.5
total All 100.0 100.0 100.0 100.0
dISCuSSIoN
This study found moderate to good agreement between responses to the three short survey questions about the quantity and frequency of consumption of breads and cereals that were included in the New South Wales Adult Health Survey 2002. Those who reported higher frequency of intake also reported eating greater quantities. The sub-group analysis showed a similar pattern of moderate to good agreement for both males and females and for the three age groups. Agreement between responses to the quantity and frequency questions was generally higher for females than males, and higher for younger compared with older respondents. This was most pronounced for the questions about bread. This finding may reflect real differences in consumption patterns. For example, males reported consuming more slices of bread per eating occasion than females, and respondents aged 55 years and older tended to eat bread more frequently but in smaller amounts, than younger respondents. Thus, some measurement error will be introduced by substituting a short question about quantity with a question about frequency of bread intake for these sub-groups. Extrapolation about quantities should be made with caution and separate estimates made for males and females and for people aged over 55 years. Agreement between quantity and frequency was higher for the breakfast cereals and cooked cereals questions than for the bread question among sex and age subgroups. A limitation of the analysis was that we could not compare the total number of bread and cereal serves. Respondents were asked only one of the three ‘quantity’ questions about breads and cereals because the survey team was concerned about respondent fatigue. Another limitation of this study was the absence of a gold standard to enable simultaneous validity-testing of both the quantity and frequency questions. However, the validation study by Riley et al3 comparing frequency and quantity of bread and cereal consumption, measured by short survey question and 3-day weighed food records, provides support for the use of frequency questions as a proxy for questions about quantity. Their findings suggest that frequency and quantity are related and that short questions about frequency can discriminate between higher and lower consumers, but the point estimates should not be interpreted literally. Notable difficulties in quantifying bread and cereal intake are that people find it difficult to identify all the foods they consume that belong to the breads and cereals group (for example bagels, pizza and pie crust, risotto, etc), and that usual portion sizes consumed are difficult to estimate with accuracy.8
Based on the findings of this study, we recommend that the three frequency questions be used as the standard short
questions for assessing bread and cereal consumption among adults. Further validity-testing of short questions relating to bread and cereal consumption, along with questions about other food groups of public health interest, is recommended. In particular, we suggest that the short questions on frequency of intake be tested for validity with more detailed dietary intake assessments to quantify the extent of measurement error at various levels of consumption. This is particularly relevant due to the sex and age differences in the relationship between frequency and quantity measurement of bread consumption. It is likely that short survey questions will not provide accurate quantitative estimates of bread and cereal consumption for individuals, but may be able to provide interim information between detailed dietary surveys about changes in the frequency of consumption, and an indication of the direction of change in quantities.
ACkNowledgMeNtS
This study was funded by the Centre for Epidemiology and Research, NSW Department of Health. The data from the NSW Adult Health Survey 2002 on bread and cereal consumption was provided by the Centre for Epidemiology and Research.
refereNCeS
Marks G, Webb K, Rutishauser I, Riley M. Monitoring food
habits in the Australian population using short questions. Canberra: Australian Food and Nutrition Monitoring Unit and the Department of Health and Aged Care, 2001.
Rutishauser I, Webb K, Abraham B, Allsopp R. Evaluation
of short dietary questions from the 1995 National Nutrition Survey. Canberra: Australian Food and Nutrition Monitoring Unit and the Commonwealth Department of Health and Aged Care, 2001.
Riley M, Rutishauser IHE, Webb K. Comparison of
short questions with weighed food records. Canberra: Commonwealth Department of Health and Aged Care, 2001.
National Health & Medical Research Council. Dietary
guidelines for Australian adults. Canberra: National Health and Medical Research Council, 2003.
Williams P. Bread and cereals. In: Dietary guidelines for
Australian adults. Canberra: National Health and Medical Research Council, 2003.
Centre for Epidemiology and Research, NSW Department of Health. New South Wales Adult Health Survey 2002. NSW
Public Health Bull 2003; 14(S-4).
Altman DG. Practical statistics for medical research. London: Chapman and Hall, 1991.
Australian Bureau of Statistics. Occasional Paper: Measuring
Dietary Habits in the 2001 National Health Survey, Australia, Catalogue No 4814.0.55.001. Canberra: Australian Bureau of Statistics, 2001.
1.
2.
3.
4.
5.
6.
7.