Issues
ISSN: 2146-4138
available at http: www.econjournals.com
International Journal of Economics and Financial Issues, 2018, 8(1), 111-117.
Effect of Cash Conversion Cycle on the Profitability of Public
Listed Insurance Companies
E. Chuke Nwude
1*, Elias I. Agbo
2, Christian Ibe-Lamberts
31Department of Banking and Finance, Faculty of Business Administration, University of Nigeria, Nsukka, Enugu Campus, Nigeria, 2Department of Accounting/Banking and Finance, Faculty of Management and Social Sciences, Godfrey Okoye University, Ugwuomu-Nike, Enugu, Nigeria, 3Fidelity Bank Plc, Abakaliki, Ebonyi State, Nigeria. *Email: [email protected]/ [email protected]
ABSTRACT
Cash conversion cycle (CCC) constitutes a powerful metric for discovering how efficiently a company manages its working capital. A company that possesses low CCC is more efficient as it turns its working capital over many times in one year and allows it to generate more sales for the cash invested. This paper sets out to investigate the effect of CCC on the return on assets (ROA) of selected Nigerian quoted insurance firms for the period (2000–2011). The ROA is used as a measure of profitability. Data were collected from the annual financial reports of sampled insurance companies. Multiple regression technique was used in analyzing the model for testing the hypotheses. ROA was used as the dependent variable. While CCC was presented as the explanatory variable, current ratio, debt asset ratio, fixed financial total asset ratio, Growth and Size were all incorporated in the model as control variables. The results indicated that CCC had negative and significant effect on profitability. Based on the findings, the study recommends that Nigerian insurance companies should endeavour to reduce their number of days in CCC always in order to enhance their profitability.
Keywords:Cash Conversion Cycle, Return on Assets, Working Capital, Profitability, Nigeria
JEL Classifications: G2, G22
1. INTRODUCTION
The ongoing squeeze on cash and credit threatens the survival of enterprises world-wide bearing in mind that they are the sources of the companies’ working assets and liabilities which are collectively captioned as “working capital” (Takon, 2013). The cardinal objective of managing working capital efficiently is understandingly to ensure that the firm is capable of continuing to function with sufficient cash flow. The latter enables it to pay maturing short-term debts and defray operational expenses. This involves taking important decisions on aspects like managing accounts receivable and payables, preserving a required level of inventories, as well as the investment of surplus cash.
A very important component of corporate finance is working capital management (WCM). WCM is essential because it affects the liquidity and profitability of a company directly (Murugesu, 2013; Appuhami and Ranji, 2008). Liquidity management is viewed as one of the most crucial financial management concerns because it involves some intense trade-offs between risks and
return which are associated with the management of short term assets and liabilities (Anser and Malik, 2013; Jose et al., 1996; Farris and Hutchson, 2002), Every organization, whether profit-oriented or not, and, irrespective of size and nature of its business, needs some measure of working capital. This is so because working capital constitutes the life-giving force for every economic unit. WCM is one of the most important functions of corporate managers (Achchuthan and Kajamanthan, 2013).
There are two basic means of assessing the WCM of a company,
viz.,
• Balance sheet concept and studying current liabilities, and • The concept of cash conversion cycle (CCC).
it effectively takes into consideration the time-lag between the disbursement for the acquisition or procurement of raw materials and the collection from the trade debtors on account of the sale of finished goods (Padachi, 2006). An effective and efficient handling of short-term assets and the corresponding payables is a question of life and death for the business enterprise and has much to do with it’s continued existence. Every corporate organization is concerned seriously about the best way to sustain and improve its profitability. Consequently, firms have to keep an eye on those factors which affect their profitability. Liquidity management is one of those factors one cannot afford to over look because it has implications on corporate risks and returns. As a measure of WCM, CCC needs to be explored as to how it may affect the profitability of corporate bodies. Today, owing to the changing world’s economic advancement of technology and increased competition among firms, each of the firms is making frantic efforts to enhance its profits. To achieve their profitability enhancement, firms now strive hard to bring their CCC at optimal level (Anser and Malik, 2013).
1.1. Purpose of Study
There are many researches focused on the impact of WCM on firm profitability. However, little is yet known regarding the CCC and its effect on the profitability of insurance companies. The purpose of this study, therefore, is to find out the effect of CCC on the profitability of the listed insurance companies in Nigeria.
1.2. Scope of the Study
This study focuses on 20 listed insurance companies in Nigeria. The data used for analysis are related to the period 2000–2011.
1.3. Significance of the Study
The results of this study will serve as a source of information to insurance companies. It will also be relevant to students of accounting, finance and other related courses for research purposes. To the general public, it will serve as a reference material while management practitioners will find the data and views expressed therein relevant to their day-to-day decision-making activities.
1.4. Study Limitations
In this study, only sample data relating to the period 2000–2011 were used. It is envisaged that future researches would focus on the related aspects of liquidity management. This will enable one to gain deeper insight into the determinants and effect of CCC on firm profitability more comprehensively.
The remaining part of this paper follows thus:
Section two provides the review of the literature concerning CCC. SectionThree presents the research methodology, Section four discusses and analyzes the findings of the study while the fifth and last section provides the recommendations and conclusion of the study.
2. LITERATURE REVIEW
Traditionally, the corporate finance literature focuses more of its attention towards the study of long-term financial decisions which include capital budgeting, capital structure and dividends (Attari
and Raza, 2012). However, it has become obvious that short-term assets and liabilities are very important components of total assets which require careful investigation, just as long-term financial decisions do. This is so because WCM plays a vital role in the firm’s profitability, risk and value. Howorth (2003) and Deloof (2003) both argue that companies endeavour to keep optimal levels of working capital which maximize their value.
In the recent past, literature had explored the different variables which represent liquidity and their effects on profitability. It had investigated the relationship of accounts payable management, accounts receivable management and cash-to-cash cycle management with profitability management. The studies provided different and conflicting results with regard to how the length of Cash Cycle affects profitability, while using different poxies for profitability (Anser and Mallk, 2013; Deloof, 2003; Nobanee, 2005; Lazaridis and Tryfonidis; 2006; Raheman and Nasr, 2007; Demirgunes and Samiloglu, 2008; Enqvist et al., 2011; Stephanou et al., 2010; Raheman et al., 2010; Mathuva, 2010; Danuletiu, 2010; Alipour, 2011).
The concept of CCC was first introduced by Richards and Laughlin (1980) (Attari and Raza, 2012). It is used as a powerful tool for measuring how well a company employs its WCM practices. Gentry et al. (1990) posited that the firm’s market worth is invariably associated with the CCC. When a firm manages its cash efficiently, that will translate to an increase in the net present value of its cash flows which would in turn result in the increase in its market value. In the same vein, a shorter CCC period would eventually result in a higher profitability of the firm. This is as a result of the fact that the cost of using the funds is decreased when the WCM practices are efficient. A shorter CCC period implies one, or all, of the following.
i. A reduced inventory turnover period in days; that is, quicker processing of materials.
ii. A reduced receivables turnover in days; that is, speedy collection from trade debtors.
A reduced payables turnover in days; that is, slow payments to trade creditors (Attari and
iii. Raza, 2012), Besley and Brigham (2005) defined CCC as:
“The length of time from the payment for the purchase of raw materials to manufacture a product until the collection of accounts receivable associated with the sale of the product.”
regarded as highly beneficial since it implies that the company has already received cash from its debtors by the number of days prior to discharging its obligation to its creditors (Hutchsion et al., 2007; Uyar, 2009). In the interest of efficient financial management, therefore, firms should endeavour to keep their CCC days at a minimum level or, preferably, negative level. Uyar (2009) and Bodie and Merton (2000) both suggested that this objective can be achieved by either curtailing the firm’s stock turnover days, quick collections from trade debtors or delaying the payment of current obligations, utility, etc.
Since the introduction of the CCC concept, many researchers have ventured to investigate its importance. Schilling (1996) observed that an increase in CCC would occasion an increase in the minimum liquidity requirement of the firm; and, vice versa. Schilling (1996) also posited that the optimal level of liquidity position is achieved at its minimum level and that the optimal liquidity level moves up and down in the same direction as the CCC. For Shin and Soenen (1998), there is a significant impact of efficient CCC on the profitability and liquidity of firms. Lyroudi and Lazardis (2000) opined that, while profitability depends on WCM, CCC affects the liquidity of the firm significantly. It is the contention of Filbeck and Krueger (2003) that some other factors, like interest rate, also have an impact on WCM. It the interest rate rises, it will make the CCC period longer. While Deloof (2003) argued that the time duration for the collection of receivables ought to be shortened for better performance, Nobanee et al. (2004) maintained that it is the inventory days that the firm has to shorten for better performance. Eljelly (2004) observed a significant inverse relationship and linkage between liquidity and profitability. Padachi (2006) found out that a higher investment in inventories by a firm will diminish the optimal level and will make the profit go down. Garcia-Teruel and Martinez-Solano (2007) discovered that firm’s profitability would be enhanced by reducing the days in receivables, days in inventories and the length of CCC. It suggested that firms should delay in making payment to ensure efficient performance. Both Hutchison et al. (2007) and Dong and Su (2010) observed a significant association between CCC and the return on investment of firms. They observed an inverse relationship between CCC and firm’s profitability, Raheman and Nasr (2007) observed a significant and negative association of the components of liquidity with profitability and posited that, for better performance, the time duration for the collection of receivables should be shortened. Appuhami and Ranji (2008) indicated that operating cash flows have some significant effect on a firm’s WCM. Koumanakos (2008) noted that the lower the rate of return the higher the average inventories are conserved. While Afza and Nazir (2009) discovered a significant positive relationship between WCM and profitability, Sharma and Kumar (2010) saw a positive relationship between the length of CCC and profitability. Luo et al. (2009) stated that when the value of the firm increase, the cash cycle will decrease. Gill et al. (2010) and Karaduman et al. (2011) argued that if a firm maintains its accounts receivable, accounts payable and inventories optimally, it will generate maximum profit. According to the view of Ebaid (2011), current cash flows have significant impact on firm profitability. Randall and Farris (2010) opined that, by implementing a collaborative cash-to-cash management cycle via the adoption of weighted
average cost of capital, firm profitability would be enhanced. Johnson and Templar (2011) asserted that return on capital and length of cash cycle would be increased by some change of proxy. According to Demirgunes and Samiloglu (2008), the companies having shorter CCC may not require external financing. They would have less borrowing cost and, hence, increased profitability. Chiou et al. (2006) asserted that efficient CCC helps a firm to source capital externally with ease in order to invest in other business ventures.
3. RESEARCH METHODOLOGY
The purpose of this research is to contribute towards a very important aspect of financial management as it relates to the insurance industry in Nigeria. Earlier literature indicates mixed results on the relationship between CCC and firm profitability. Consequently, it was deemed necessary to investigate further the relationship under a different setting in order to generalize the results better for further propositions in this direction.
This study investigated whether or not CCC has a significant impact on the ROA of listed Nigerian insurance firms. The study completely relied on historical accounting data extracted from the annual financial statements of 20 insurance firms listed on the Nigerian stock exchange (NSE) for the period 2000–2011. Ex post facto research design was adopted. Audited annual financial reports were deemed to be most authoritative, accessible and reliable documents for assessing the performance of the affected firms. The data generated were used to run both cross-section and time series regression. The multiple regression technique was used for analyzing the model. The model was stated after ensuring the stationarity of the time series data and after testing for multi- collinearity problems. Regression analysis used because of the statistical dependence of one variable (ROA) on the independent variable (CCC). Current ratio, debt asset ratio, fixed financial total asset ratio, size and growth were introduced in the model as control variables. The study explained how insurance companies can boost their revenue and generate higher profits by using their available resources optimally. The variables studied are calculated thus:
a. CCC: Receivable collection period-payables payment period (This study excluded inventory period from the calculation of the CCC since, according to Waweru (2011), insurance is in the service industry which does not keep stock).
b. Return on assets=net profit after tax÷average total assets c. Current ratio=current assets÷current liabilities
d. Fixed financial total assets ratio=fixed financial assetsaverage total assets
e. Debt asset ratio=average total debtsaverage total asset f. Growth (per capita gross domestic product growth rate
[GDPGR])=growth rate in the previous year for insurance firm i in time t
g. Size=natural logarithm of total assets for insurance firm i in time t.
firm in generating profit with the available assets. The measure of ROA used here, which is most often used in the literature owing to its simplicity, is defined as ROA=net income after taxes÷average book value of assets (Demirgunes and Samilogu, 2008; Falope and Ajilore, 2009; Afza and Nazir, 2009). CCC is a proxy for WCM efficiency.
Current ratio, which is a measure of liquidity, was also used by studies like Shin and Soenen (1998) and Sharma and Kumar (2001). It is a measure of a firm’s short term solvency.
Debt asset ratio, a proxy for leverage, was also used in the studies like Raheman and Nasr (2007); Shin and Soenen (1998). Fixed financial total asset ratio was equally used as a control variable by studies like Deloof (2003); Raheman and Nasr (2007), Dong and Su (2010); Lazaridis and Tryfonidis (2006) and Mathuva (2010).
Size, which is proxied by the natural logarithmn of total assets (NLTA) was also used by Gill et al. (2010), Padachi (2006) and Alipour (2011) to control for economies of scale, growth, which is represented by GDPGR, was also used by Mathuva (2010) and Enqvist et al. (2004) to control for inflationary pressures which affect working capital components.
3.1. Research Model
This study used the Uyar (2009) model. The general form of the model for a multiple regression analysis is given in the following form: Y=b0+b1x1+b2x2+…+bnxn (1)
On the basis of the review of the related literature the following relationships have be predicted and further tested statistically in order to conclude the results of the study:
ROAit=b0+b1(CCCit)+b2(CRit)+b3(FFTARit)+b4(DARit)+b5(GDPG Rit)+b6(NLTAit)+eit
Where,
ROA=Return on assets
CCC=Cash conversion cycle
CR=Current ratio
FFTAR=Fixed financial total asset ratio
GDPGR=Per capita gross domestic product growth rate
DAR=Debt asset ratio
NLTA=Natural logarithmn of total assets
b0=The intercept of the equation
b=The coefficient of the variables
i=Insurance firm 1, 2, 3---20th
t=year 1, 2, 3 12th
e=Error term.
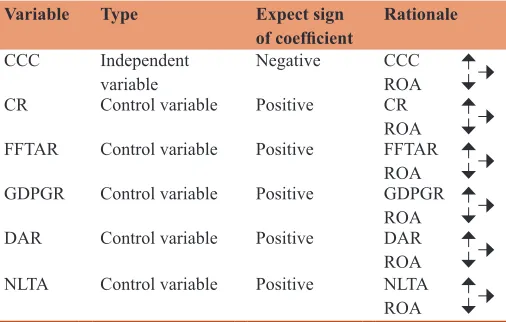
Table 1 shows the expected signs of the coefficients of the key variables in the model. based on the WCM theory.
3.2. Population and Sampling
For the purpose of this study, the data of the insurance companies quoted on the NSE were used to measure the effect of CCC on the profitability of listed insurance companies in Nigeria. The population is made up of all the quoted insurance companies, a sample of 20 was selected on the basis of availability of information for the period of study. The study made use of 12 years financial statement of the sampled firms (2000–2011).
3.3. Data Collection
Secondary data were extracted from the financial statements obtained from the websites of the national ınsurance commission, the securities and exchange commission and from the corporate headquarters of the sampled firms.
3.4.Hypothesis
This is stated as follow: H0: CCC does not have a significant effect on the profitability of listed Nigerian insurance companies.
4. DATA ANALYSIS AND DISCUSSION OF
RESULTS
Descriptive statistics of the study for 20 insurance firms (2000– 2011) with observations of 240 firm years are presented in Table 2. The statistics depict that the mean value of the variable (ROA) is around 10 per cent with standard deviation of ±0.21. The mean value of CCC of all the listed insurance companies as sampled is around minus 0.8 days. Hence it may be concluded that on the average, listed insurance companies in Nigeria faced low profitability during the period under review as represented by their ROA. On the average, the insurance firms had good CCC but the high standard deviation of ±9870.866 implies that the companies are dispersed widely on it.
Table 1: Key variables and their expected effects on return on assets
Variable Type Expect sign
of coefficient Rationale
CCC Independent
variable Negative CCCROA
CR Control variable Positive CR
ROA FFTAR Control variable Positive FFTAR
ROA GDPGR Control variable Positive GDPGR
ROA
DAR Control variable Positive DAR
ROA NLTA Control variable Positive NLTA
ROA ROA: Return on assets, CCC: Cash conversion cycle, CR: Current ratio, FFTAR: Fixed
The mean ± standard deviation for the control variables such as CR, FFTAR, GDPGR, DAR and NLTA were 6.000 ± 9.2229; 4.601 ± 62.869; 774.745 ± 434, 608; 0.659 ± 1.694 and 68930, 96 ± 51338.45 respectively.
4.1. Correlation Analysis
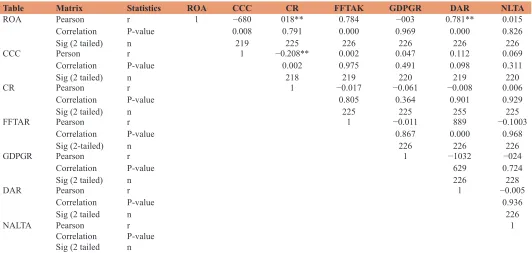
Table 3 shows the Pearsons correlation matrix and shows how the CCC correlated with the ROA As evident on Table 3 CCC has a strong negative relationship with ROA (r = 0.680) at 0.01 level of significance.
4.2. Collinearity Statistics
4.2.1. Source SPSS output on firms annual report (2000–2011)
The collinearity statistics in Table 4 show that the tolerances are far away from 0, thereby indicating the absence of muilticollinearity. This implies that the predictors are not highly inter correlated.
The partial correlation coefficients indicate the contribution of the independent and control variables to ROA.
4.3. Regression Analysis
In order to check the relationship between the studied variables, regression analysis was used. This was done after adjusting for the heteroskedasticity of the data to minimize the effects of outliers.
ROA was regressed with the independent and control variables to obtain the outcome of the predicted relationship.
As earlier stated, the null hypothesis for this study is CCC does not have a significance effect on ROA of the listed Nigerian ınsurance companies.
4.4. Decision Rule
1. Accept H0 and reject Ha if the probability value of the t-statistic is >0.05 level of significance
2. Reject H0 and accept Ha if the probability value of the t statistic is ≤0.5 level of significance.
The regression result in Table 5 discloses that the probability value (0.021) of the t-statistic is <0.05 level of significance for the variable (CCC) tested, Consequently, the null hypothesis is hereby rejected and the alternative hypotheses is accepted.
The regression coefficient (−1.10.1 × 107) is negative. This implies
that CCC has a significant negative effect on the profitability of listed Nigerian insurance companies. It therefore means that an increase in CCC will occasion a decrease in the profitability of
Table 2: Descriptive statistics
Variables Obs Mean SD Minimum Maximum
ROA 240 0.103363 0.211776 0.0000 2.590000 CCC 240 −0.830182 9870,866 −116950.6 37984,48 CR 240 6.000311 9.228802 0.020000 62.9000 FFTAR 240 4.6000575 62.8658 0.0000 945.5300 GD (GR 240 774.7500 434.6076 125.0000 1984.000 DAR 240 0.659823 1.694071 0.0000 23.21000 NLTA 240 68930.96 51338.46 0.0000 608492 Source: Computed from the data obtained from the annual reports of quoted insurance companies. ROA: Return on assets, CCC: Cash conversion cycle, CR: Current ratio,
FFTAR: Fixed financial total asset ratio, GDPGR: Per capita gross domestic product growth rate, DAR: Debt asset ratio, NLTA: Natural logarithmn of total assets, SD:
Standard deviation
Table 3: Correlation matrix
Table Matrix Statistics ROA CCC CR FFTAK GDPGR DAR NLTA
ROA Pearson
Correlation Sig (2 tailed)
r P-value n
1 −680
0.008 219
018** 0.791 225
0.784 0.000 226
−003 0.969 226
0.781** 0.000
226
0.015 0.826 226
CCC Person
Correlation Sig (2 tailed)
r P-value n
1 −0.208**
0.002 218
0.002 0.975 219
0.047 0.491 220
0.112 0.098 219
0.069 0.311 220
CR Pearson
Correlation Sig (2 tailed)
r P-value n
1 −0.017
0.805 225
−0.061 0.364
225
−0.008 0.901
255
0.006 0.929 225 FFTAR Pearson
Correlation Sig (2-tailed)
r P-value n
1 −0.011
0.867 226
889 0.000
226
−0.1003 0.968
226 GDPGR Pearson
Correlation Sig (2 tailed)
r P-value n
1 −1032
629 226
−024 0.724 228
DAR Pearson
Correlation Sig (2 tailed
r P-value n
1 −0.005
0.936 226 NALTA Pearson
Correlation Sig (2 tailed
r P-value n
1
**Correlation is significant at the 0.01 level (2-tailed). *Correlation is significant at the 0.05 (2-tailed). Source SPSS output on firms’ annual reports (2000–2011). ROA: Return on assets, CCC: Cash conversion cycle, CR: Current ratio, FFTAR: Fixed financial total asset ratio, GDPGR: Per capita gross domestic product growth rate, DAR: Debt asset ratio, NLTA: Natural
a listed insurance firm in Nigeria as indicated by the negative regression coefficient. The coefficient of determination (R2 = 0.65) indicates that more than half of the variations in ROA is explained by the model. The Durbin Waston statistic is close to 2. This means that there are no autocorrelation problems. Hence the model:
R O A = 0 . 0 5 9 – 1 . 0 1 E – 0 7 C C C + 0 . 0 0 0 6 C R + 0 . 0 0 1 FFTAR+0.05DAR+6.68E–069DPGR–5.24E–0.8NLTA.
From the results above, it is evident that when the CCC is relatively shorter, the insurance company may not require external financing. This results in incurring less borrowing cost, thereby making room for profitability. This agrees with the findings of Deloof (2003), Uyar (2009), Padachi (2006), Shin and Soenen (1998), Jose et al. (1996), Raheman and Nasr (2007). This also demonstrates the fact that CCC decrease is one of the key and most important factors for profitability increases as well as increase in corporate value. An implication for the negative relationship between CCC and ROA can be explained by the fact that minimizing the investments in current assets is capable of helping to enhance profitability. This ensures that liquid assets are not kept in the business for too long and that they are utilized in generating profit for the company (Mathuva, 2010).
5. CONCLUSİON AND
RECOMMENDATİONS
This study empirically analyzed the effect of CCC on the profitability of the listed Nigeria insurance companies. The results showed that CCC had a significant negative effect on ROA, implying that the decrease in CCC would lead to an increase in the profitability of a listed Nigerian insurance company. It is recommended that further studies involving all insurance companies in Nigeria should be attempted. In addition, further studies on the topic should make use of more variables and extend the period of the study for the purpose of generalization of results.
REFERENCES
Achchuthan, S., Kajamanthan, R. (2013), Corporate governance practices and working capital management efficiency: Special reference to listed manufacturing companies in Sri Lanka. In Information and Knowledge Management, 3(2), 216-226.
Afza, T., Nazir, M. (2009), Impact of regressive working capital management policy on firm’s profitability. The IUP Journal of Applied Finance, 15(8), 20-30.
Alipour, M. (2011), Working capital management and corporate profitability. Evidence from Iran. World Applied Sciences Journal, 12(7), 1093-1099.
Anser, R., Malik, Q.A. (2013), Cash conversion cycle and firms profitability: A study of listed manufacturing companies of Pakistan. IOSR Journal of Business and Management, 8(2), 83-87.
Appuhami, B.A., Ranji, T.H. (2008), The impact of firm’s capital expenditure on working capital management: An empirical study across industries in Thailand. International Management Review, 4(1), 8-21.
Attari, M.A., Raza, K. (2012), The optimal relationship of cash conversion cycle with firm size and profitability. International Journal of Academic Research in Business and Social Sciences, 2(4), 342-350. Besley, S., Brigham, E. (2005), Essentials of Management Finance.
13th ed. Mason, OH: Thomson.
Bodie, Z., Merton, R.C. (2000), Finance. New Jersey: International Edition Prentice Hall.
Chiou, J.R., Cheng, L., Wu, H.W. (2006), The determinants of working
Table 4: Collinearity statistics
Model Correlation Collinerity Statistics Zero order Partial Part Tolerance vif Constant
CCC 048 0.006 0.004 0.896 1.116
CR 0.019 6.049 0.028 953 1.049
FFTA 1786 0.309 192 899 1.028
DAR 0.782 287 177 996 1.098
GDPGR 008 0.022 0.013 992 1.008
NLTA 016 0.022 0.013 994 1.006
CCC: Cash conversion cycle, CR: Current ratio, FFTA: Fixed financial total asset, GDPGR: Per capita gross domestic product growth rate, NLTA: Natural logarithmn of
total assets
Table 5: Regression table result of equation of cash conversion cycle with dependent valuable (ROA) Dependant variable: ROA
Method: Panel least squares
Date: 04/20/15 time 08.26 Sample 1228
Included observations: 240 Excluded observations: `10
Cross sections included: 20
White heteroskedasticity. Consistent standard. Errors and covariance
Variable Coefficient Std
error t-statistic Prob.
C 0.59983 0.031149 1.925672 0.0555
CCC −1.01E-07 8.98E-07 0.113044 0.0021
CR 0.000655 0.000455 1.441642 0.1509
FFTAR 0.001452 0.001124 1.291413 0.1980
DAR 0.049651 0.046736 1.062401 0.2893
GDPGR 6.68E-06 1.75E-05 0.381972 0.7029
NLTA −5.24E-08 1.26E-07 −0.416034 0.6778
R2 0.650702
Adjusted R2 0.640769 S.E of
regression 3.507369 Sum squared 3.507369 Log liklihood 140,8009 Durbin–Watson
stat 1.817920
Mean
dependent var 0.105505 S.D dependent
var. 0.216111
Akaike in to
criterion 1.227532 Schwarz
criterion 1.118855 F-statistic 65.51145 Prob (f. static) 0.00000
Source: SPSS output on firm’s annual reports (2000–2011). ROA: Return on assets, CCC: Cash conversion cycle, CR: Current ratio, FFTAR: Fixed financial total asset ratio, GDPGR: Per capita gross domestic product growth rate, DAR: Debt asset ratio, NLTA:
capital management. Journal of American Academy of Business, 10, 149-155.
Danuletiu, A.E. (2010), Working capital management and prof ıtability: A case of ALBA Country companies. Anales Universitatie Apulensis Series Oeconomico, 12(1), 364.
Deloof, M. (2003), Does working capital management affect profitability of belgian firms. Journal of Business Finance and Accounting, 30(3), 573-587.
Demirgunes, K., Samiloglu, F. (2008), The effects of working capital management on firm profitability: Evidence from Turkay. The International Journal of Applied Economics and Finance, 2(1), 44-50. Dong, H., Su, J. (2010), The relationship between working capital
management and profitability; A vietnam case. International Research Journal of Finance and Economics, 49, 59-67.
Ebaid, I.E. (2011), Accruals and the prediction of future cash flows: Empirical evidence from emerging market. Management Research Reviews, 34(7), 838-853.
Eljelly, A. (2004), Liquidity profitability trade-off: An empirical ınvestigation from an emerging market. International Journal of Commerce and Management, 14(2), 48-61.
Enqvist, J., Graham, M., Nikkinen, J. (2011), The Impact of Working Capital Management on Firm Profitability in Different Business Cycles: Evidence from Finland. Available from: http://www.SSRN httplsrsm.com/abstract-1794802.
Falope, O.I., Ajilore, O.T. (2009), A working capital management and corporate profitability: Evidence from panel data analysis of selected quoted companies in Nigeria. Research Journal of Business management, 3(3), 73-78.
Farris, H.M.T., Hutchson, P.D. (2002), Cash: The new supply chain management metric. International Journal of Physical Distribution and Logistics Management, 32(4), 288-298.
Filbeck,G., Krueger, T.M. (2003), An analysis of working capital management: Results across ındustries. Mid-American Journal of Business, 20(2), 11-20.
Garcia-Teruel, P.I., Martinez-Solano, P.M. (2007). Effects of working capital management on SME profitability. International Journal Managerial Finance, 3(2), 164-177.
Gentry, J.A., Lee, R.V., Wai, H. (1990), A weighted cash conversion cycle. Financial Management,19(1), 90-99.
Gill, A., Biger, N., Mathur, N. (2010), The relationship between working capital management and profitability: Evidence from the United States. Business and Economic Journal, BEJ-10, 1-9.
Howorth, G. (2003), The focus of working capital management in UK, small firms. Management Accounting Research, 14, 94-111. Hutchson, P.D., Farris, M.T., Anders, S.B. (2007), Cash to-Cash analysis
and management. The CPA Journal, 77(8), 42-47.
Johnson, M., Templar, S. (2011), The relationship between supply chain and firm performance: The development and testing of a unified proxy. International Journal of Physical Distribution and Logistic Management, 41(2), 88-103.
Jose, M.L., Lancaster, C., Stevens, J.L. (1996), Corporate returns and cash conversion cycles. Journal of Economics and Finance, 20(1), 33-46. Karaduman, H.A., Akbas, H.E., Caliskan, A., Durer, S. (2011), The
relationship between working capital management and profitability: Evidence from emerging market. International Journal of Finance and Economics, 62(2011), 61-67.
Keown, A.J., Martin, J.D., Petty, J.W., Scott, D.F. (2003), Foundations of finance. 4th ed. New Jersey: Pearson Education.
Koumanakos, D.P. (2008), The effect of ınventory management on firm performance. International Journal of Productivity and Performance Management, 57(5), 335-369.
Lazaridis, L., Tryfonidis, D. (2006), The relationship between working
capital management and profitability of listed companies in the athens stock exchange. Journal of Financial Management and Analysis, 19(1). Available from: http//www.Papersssrn.Com/So13/ PapersAbstractId-93159.
Luo, M.M., Yee Lee, J.J., Hwang, Y. (2009), Cash Conversion Cycle from Performance and Stock Value. Available from: http:// www.90homepage.Villanova,edu/Michael,pagano/MLccc2009420. pdf.
Lyroudi, K., Lazaridis, Y. (2000), The Cash Conversion Cycle and Liquidity Analysis of the Food İndustry at Greece. Available from: http://www.papers.ssrn.com/paper abstract 236175.
Mathuva, D.M. (2010), The ınfluence of working capital management components on corporate profitability; a survey of kenyan listed firms. Research Journal of Management, 4(1). 1-11.
Murugesu, T. (2013), Effect of cash conversion cycle on profitability: Listed plantation companies in Sri Lanka. Research Journal of Finance and Accounting, 4(18),132-137.
Nobanee, H. (2005), Working Capital Management and Firm’s Profitability: An Optimal Cash Conversion Cycle. Available from: http://www.ssrn.com/abstract=1471230.
Nobanee, H., Abdullatif, M., Alttajjar, M. (2004), Cash Conversion Cycle and Firms Performance of Japanese Firms. Asian Review of Accounting, 19 (2), 147-156.
Padachi, K. (2006), Trends in working capital management and its ımpact on firm’s performance: An analysis of mauritian small manufacturing firms. International Review of Business Research Papers, 2(2), 45-58. Raheman, A., Afza, I., Quyyum, A., Bodie, M.A. (2010), Working capital
management and corporate performance of manufacturing sector in Pakistan. International Research Journal of Finance and Economics, 47, 159-169.
Raheman, A., Nasr, M. (2007), Working capital management and profitability: Case of Pakistani firms. The International Review of Business Research Papers, 3(1), 279-300.
Randall, W.S., Farris, M.T. (2010), Supply chain financing using cash-to- cash variables to strengthen the supply chain. International Journal of Physical Distribution and Logistics Management, 39(8), 669-689. Richards, V.D., Laughlin, E.J. (1980), A cash conversion cycle approach
to liquidity analysis. Financial Management, 9(1), 32-38.
Schilling, G. (1996), Working capital’s role in maintaining corporate liquidity. AFP Exchange, 16(5), 4-7.
Sharma, A.K., Kumar, S. (2011), Effect of working capital management on firm profitability: Empirical evidence from India. Global Business Review, 12(1), 159-173.
Shin, H., Soenen, L. (1998), Efficiency of working capital and corporate profitability. Financial Practice and Education, 8, 37-45.
Stephanou, M., Elfani, M., Lois, P. (2010), The effect of working capital management on firm profitability: Empirical evidence from an emerging market. Journal of Business and Economic Research, 8(12), 63-68.
Takon, S.M. (2013), Does cash conversion cycle have impact on return on assets of Nigerian firms? Research Journal of Finance and Accounting, 4(14), 34-42.
Uyar, A. (2009), The relationship of cash conversion cycle with firm size and profitability: An Empirical ınvestigation ın Turkey. International Journal of Finance And Economics. Available from: http://www,eurojournals.com/finance.htm.
Van-Horne, J.C., Wachowiez, J.M. (2005), Fundamentals of Financial Management. 11th ed. New York: Prentice Hall.