RHEA
Ey?5040 December, 1966 IR 4
Journal of the
IRRIGATION AND DRAINAGE DIVISION
Proceedings of the American Society of Civil Engineers
REMOTE SENSING FOR ESTIMATING SOIL SALINITYa
By Victor I. Myers', M. ASCE, David L. Carter2, and William J. Rippert3
INTRODUCTION
Many soils in arid areas of the world are affected by high water tables and resultant soil salinity. Detection of the saline areas and of the degree of salinity in the rooting profile is of considerable interest to agricultural workers involved in reclamation of these soils. Early detection of saline areas may permit preventive measures before significant crop damage is apparent. Furthermore, rapid detection of saline areas, using advanced methods and procedures can greatly accelerate initiation of reclamation processes.
Aerial photography has been used for detailed study of forest vegetations and for many other purposes." Recently, Myers, Ussery, and Rippert6 used black and white infrared aerial photography for detection of drainage and salinity problems.
Note.—Discussion open until May 1, 1967. To extend the closing date one month, a written request must be filed with the Executive Secretary, ASCE. This paper is part of the copyrighted Journal of the Irrigation and Drainage Division, Proceedings of the American Society of Civil Engineers, Vol. 92, No. IR4, December, 1966. Manuscript was submitted for review for possible publication on June 23, 1966.
a Presented at the December 2-4, 1964, Joint Conference on the United States National Committee, ICID, and the Irrigation and Drainage Division, ASCE, at El Paso, Tex.
1 Research Agric. Engr., Southern Plains Branch, Soil and Water Conservation Research Div., Agric. Research Service, U. S. Dept. of Agric., Weslaco, Tex.
2 Research Soil Scientist, Northwest Branch, Soil and Water Conservation Research Div., Agric. Research Service, U. S. Dept. of Agric., Kimberly (Twin Falls), Idaho. 3 Physical Science Technician, Southern Plains Branch, Soil and Water Conservation Research Div., Agric. Research Service, U. S. Dept. of Agric., Weslaco, Tex.
American Society of Photogrammetry, "Manual of Photographic Interpretation," George Banta Co., Inc., Menasha, Wis., 1960, 868 pp.
5 Schulte, D. W., "The Use of Panchromatic, Infrared and Color Aerial Photography in the Study of Plant Distribution," Photogrammetric Engineering, Vol. XVII, No. 5, 1951, pp. 688-712.
6 Myers, V. I., Ussery, L. R., and Rippert, W. J., "Photogrammetry for Detailed Detection of Drainage and Salinity Problems," Transactions, ASAE, Vol. 6, 1963, pp. 332-334.
60 December, 1966
504 KE irr AB. pro sal filn sib pho gre rad an I sur soil RE] Sem ASC
This paper describes the application of aerial photo interpretation using Ektachrome infrared aero film for estimating the severity and extent of salt-affected areas at a number of sampling sites in cotton fields on non-irrigated farms in the Lower Rio Grande Valley. The farms lie in an area affected by a seasonally high water table. In addition, leaf temperature measurements of cotton plants affected by various degrees of salinity are shown.
SALINITY IN RELATION TO REFLECTANCE AND LEAF TEMPERATURES
Excessive soluble salt concentrations in the plant root zone affect plant growth in many ways. The most common of these is the restricted water up-take by plant roots resulting from increased osmotic pressure of saline solutions 7,9 Specific ion toxicity can also affect plant growthand appearance. However, Chang and Dregne9 suggest that cotton is so tolerant to toxic ions that unfavorable environmental conditions resulting from excess salts gener-ally limit growth and yields before ion toxicity.
Plants are frequently good indicators of conditions that occur below the soil surface. These conditions are manifested in plant appearance and spectral reflectance from leaf surfaces. The root systems of plants explore a rather large soil volume. A plant sample, therefore, is more representative of the site conditions than is a single soil sample.
Cotton growing in saline areas exhibits marked visual symptoms of moisture stress. An examination of salinity effects on plant appearance and of the light reflectance properties of plant leaves was reported in a previous paper.9 The earlier study related spectral reflectance from cotton leaves, measured by a recording spectrophotometer, to soil salinity from field sites. These studies utilized the near-infrared part of the spectrum to approximately 0.95 micron—the limit of sensitivity of aerial infrared photographic film.
The measurement of plant leaf temperatures offers another possible technique for detecting the occurrence and extent of soil salinity. The specific capacity of the plant surface to absorb radiation, together with a number of other properties regulating the dissipation of incident radiation energy, influence the temperature of the plant. 19 Such properties are the ability of leaves to turn their leaf surfaces toward incoming solar radiation, the ana-tomical structure of the leaves, plant mechanisms that limit transpiration, transpirational cooling of the leaves, and the capacity for releasing a certain amount of heat in physiological processes, such as respiration. In the case of plants affected by salinity, physiological changes in leaves may influence leaf temperature.
Bernstein, Leon, and Hayward, H. E., "Physiology of Salt Tolerance," Annual Re-view of Plant Physiology, Vol. 9, 1958, pp. 25-46.
8 Gingrich, J. R., and Russell, M. B., "A Comparison of the Effects of Soil Moisture Tension and Osmotic Stress on Root Growth," Soil Science, Vol. 85, 1957, pp. 185-194. 9 Chang, C. W., and Dregne, H. E., "Effect of Exchangeable Sodium on Soil Properties and on Growth and Cation Content of Alfalfa and Cotton," Proceedings, Soil Science Soc. of Amer., Vol. 19, 1955, pp. 29-35.
Salinity may influence leaf color, physiological structure, leaf thickness, and other properties. It is well known that plant leaves do not absorb the total radiant energy that strikes their surface. The major part of incident radiation is reflected by the leaf surface or passes through the leaf. The amount of energy lost in this way depends on the leaf thickness, the smoothness of leaf surface, the intensity of leaf coloring, etc 10 Only a small percentage of the energy absorbed by plant leaves is used in the photosynthetic process. Ap-proximately 90% of it is converted into thermal energy and is used for trans-piration and for raising the leaf temperature. Itis then radiated outward to the environment of the plant in the form of longwave (thermal) radiation.
The specific physiological or anatomical changes that take place in cotton plants affected by various degrees of salinity and their influences on leaf temperatures are not known. Some of the changes that obviously take place, such as intensity of leaf coloring, and probably leaf thickness, have been mentioned as affecting the amount of energy absorbed or lost by leaves. Molgal° describes an experiment performed by A. Made who obtained tem-perature records of the fleshy, hard leaf of Bilbergia nutans, the temtem-perature of the thin leaf of Plectranthus fruticosus, and a curve for the temperature of the air surrounding the leaves. During midday, leaf surfaces were 10°C warmer than the air. The fleshy, thicker leaf, having greater thermal inertia, showed delayed reaction to temperature variations and its temperature ex-tremes were slightly lower than those in the thin leaf.
Several investigators have found significant temperature differences among plants subjected to differential moisture stress 11,12 It is well known that plants having abundant soil moisture in the root zone transpire more rapidly than plants having inadequate moisture for plant growth.
INFRARED THERMOMETRY
According to Tanner," it has been difficult in the past to determine the temperature difference between plants or between plants and air because there has been no satisfactory way of defining and measuring plant tempera-tures. Developments in infrared thermometry in recent years have provided r
instruments that accurately measure radiation from plant leaf and other surfaces. Such instrumentation surmounts the sampling problemby integrating into a single measurement the thermal radiation from all plant surfaces in the field of view of the instrument. Then, also, the temperature sample from the radiated upper part of the plant should give emphasis to the parts of the plant participating most actively in transpiration.
An infrared radiometer can be used on the ground to measure temperatures over a wide spectral range. However, measurement of temperatures from air-craft presents a problem because of atmospheric interference. Fortunately, the atmosphere offers several "windows" for energy transmission in the in-frared spectrum. One particularly good window occurs between 8 and 14
11 Curtis, Otis F., "Wallace and Clum 'Leaf Temperature': A Critical Analysis with Additional Data," American Journal of Botany, Vol. 25, 1938, pp. 761-771.
12 Strogonov, B. P., Kleshain, A. F., and Ivanitskaya, Ye. F., "On the Temperature of Cotton Leaves with Different Types of Soil Salinity and Varying Water Supply," Dok-lady Adak. Nauk., SSSR, Vol. 93, No. 1, 1953, pp. 179-182.
December, 1966 IR 4 microns in which energy is transmitted freely 1 4 It is in this range that most infrared radiometers and thermometers operate.
PHOTOGRAPHIC FILMS FOR REFLECTANCE STUDIES
A previous salinity study involving photogrammetry 6 utilized black and white infrared film and a camera with an 89-A dark-red filter. However, black and white photographs record reflectance only as tones of gray, rather than true shades of gray and variations of color as seen by the human eye. In black and white photography, the limitation inherent in reproductions of only mono-chromatic gray tones can be partly overcome by specific film-filter combi-nations that increase tonal contrasts between salinity conditions. Even with this increased tonal contrast, the final result will be registered in a relatively limited range of black, gray, and white tones of which the human eye can distinguish only about 100 to 300. It is possible to make accurate distinctions between about 200,000 colors on the basis of hue, value, and chroma .6 Hue means the specific wavelength pattern of the color. Value is the brightness or degree of blackness or whiteness, and chroma is the brilliance or color saturation.
A false-color film has been developed that is sensitive in the near-infrared wavelength range where reflectance differences due to soil salinity are most pronounced. The principles of false-color systems were used during World War II for camouflage detection. This film, now referred to as Ektachrome infrared (IR) aero film, has three layers: one layer is infrared sensitive, another is green sensitive, and the third is red sensitive. 15 The film em-phasizes the infrared reflection of healthy green vegetation that appears bright red or pink on the photographs. Cotton plants affected by salinity appear as darker shades of red and, when seriously affected, nearly black. Ektachrome IR photos permit making a distinction betwen vegetation and soil which is not always possible using black and white photos. It is especially useful where vegetation is sparse because the bright color of vegetation, as it appears on the photos, simplifies the identifications of living plants in contrast to the background. On black and white photos, the background can be of approximately the same shade as that of the plants, making photo inter-pretation difficult.
METHODS AND MATERIALS
Four dryland cotton farms in an area affected by a seasonally high water table and resultant salinity were selected as reference farms for the study. Soil salinity on any given farm varies widely from unaffected to severely af-fected soils. Soil sampling sites were located by visual selection on these farms to give a gradation in plant appearance and degree of salinity. Twenty sites were selected on the four farms.
Five farms were selected for prediction tests which were similar to the reference farms in that they each had a wide range of salinity-affected cotton. 14 Suits, G. H., "The Nature of Infrared Radiation and Ways to Photograph It," Photo-grammetric Engineering, Vol. XXVI, No. 5, 1960, pp. 763-772.
Twenty-five random prediction sites were located to give a wide variation of soil salinity.
Soil samples were taken from two holes at each reference and prediction site at depth increments of 0-1, 1-2, 2-3, 3-4, and 4-5 ft. The samples from each hole for a given depth increment were combined for each sampling site. Soil samples were analyzed for moisture content and for electrical con-ductivity of the saturation extract (ECe ).
Aerial photographs were taken simultaneously with the soil sampling so they could be used for prediction of salinity. An 1,800-acre area was included in the photographs. A K-17 aerial camera with a 6-in, lens was used. The plants were photographed from an elevation of 1,500 ft. Ektachrome infrared aero film, which requires a No. 12 yellow filter to eliminate the blues and a special color balancing filter provided with each roll of film, was used. Photos were made in sequence to produce a 60% overlap in successive exposures so that they could be examined stereoscopically.
Previous soil analyses and film transparency examinations were used to establish salinity groupings of the reference sites. On the basis of the re-ference sample salinity groupings, the salinity levels of prediction sites were estimated. The soil salinity prediction observations were made from the film transparencies. A magnifying glass and a stereoscope were used in examining the sites on the film. A stereoscope is useful for delineating salinity areas; however, examination of the sites for prediction purposes in this study was not necessarily made using a stereoscope. Film transparencies of both reference and prediction sites were examined to estimate salinity of prediction sites.
Plant temperatures were measured using a Stoll Hardy 16 infrared radio-meter. (Trade names and company names are included for the benefit of the reader and do not infer any endorsement or preferential treatment of the product listed by the United States Department of Agriculture.) With this instrument the target temperature is compared against the temperature of a built-in aluminum block with black body cavity. The radiometer's sensing element was held a few inches away from the leaf surface. The leaf temper-ature is obtained by adding deflection of an ammeter calibrated in degrees centigrade to the reference block temperature, as indicated by a precision thermometer inserted into it. To avoid including the cooler interior part of plants in the field of incidence of the sensing element, it was necessary to measure the temperature of individual leaves. Several such individual meas-urements were averaged to arrive at the temperature for a particular site. Leaf temperatures were measured at 20 sites on two dates in 1964 and at 21 sites on a single date in 1963. The 1964 sites were the same as some of those used for the photogrammetry studies, and the 1963 sites were in the same general area.
RESULTS
In establishing a correlation between photographic color contrast and the average salinity (ECe ) in the profile, the depth increment of 0 ft to 5 ft was selected, on the basis of statistical studies, as the critical soil zone affecting plant color and height. The sites on the reference farms were arranged into
64
16 14
4 6 8 10 12
Value of ECe, in millimhos per centimeter
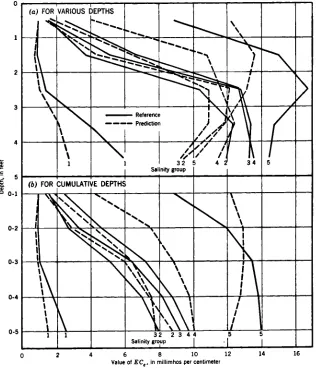
FIG. 1.—AVERAGE SALINITY LEVEL (ECe)
sites were then classed inthe five groups, based on visual comparison of these sites with the reference sites. A sixth group was identified on aerial photos as bare soil, which was higher in salinity than the five groups representing salini-ty-affected cotton
The salinity level (ECe ) was averaged by 1-ft increments for the reference and for the prediction sites. This average salinity level increased with depth
2 0
five salinity ground (numbered 1 to 5) based on visual observation of the photo-graphs. The higher the number, the higher is the degree of salinity (see Table 2). A salinity group includes the range of average salinity values in the 0-ft to 5-ft profile emcompassing the sites included in the group. The 25 prediction
(a) FOR VARIOUS DEPTHS
-..
\
.
I‘ 1*-...6,,..._
, h
e
..._
.,
‘.,
imill,
.,,
Refere
nc
eR f
I .,
,,,
,,,,Er
___
e e re Prediction1 1
Sal
4/
3 2 nity group
,
/ /
5 4 34 5
(b) FOR CUMULATIVE DEPTHS , ...,
.
I ONNIEN
,\ 1
.
1
,%
,% ,
....,\NNI
E
\
N
ki„:.\ I
M
L
,
I,
SE ,
, ,
1 1 3 2 2 3 4 4 5 5
Salinity group
-0
2
3
4
02
03
0-4
05 5
IR 4
to 3 ft in both reference and prediction soils. In some cases, particularly in prediction soils, the salinity level decreased from 3 ft to 5 ft (Fig. 1). The salinity level was also averaged for both the reference and pre-diction sites on a cumulative basis. This was accomplished by averaging the ECe for the 0 to 1, 0 to 2, 0 to 3, 0 to 4, and 0 to 5-ft depths. On this
TABLE 1.—STATISTICAL COMPARISONS OF ECe LEVELS
Salinity groups
t Significancea Salinity groupsreference t Significance Reference Predicted
(a) Salinity level averaged at each foot
1 1 1.713 NSb 2 versus 1 3.025 Sc
2 2 0.413 NS 3 versus 2 3.015 S
3 3 1.334 NS 4 versus 3 1.546 NS
4 4 -0.353 NS 5 versus 4 3.008 S
5 5 1.270 NS
(b) Salinity level cumulatively averaged over depths
1 1 1.810 NS 2 versus 1 3.528 S
2 2 -1.051 NS 3 versus 2 3.152 S
3 3 0.299 NS 4 versus 3 2.992 S
4 4 -3.637 S 5 versus 4 11.30 S
5 5 -0.223 NS
a Significance was evaluated at the 5% level. b NS = nonsignificant.
c S = significant.
TABLE 2.—MINIMUM AND MAXIMUM ECe VALUES
in millimhos per centimeter
1 1.03 3.80 0.61 4.45
2 7.39 8.30 5.62 9.72
3 7.71 10.55 5.78 9.35
4 8.82 10.83 9.06 11.11
5 12.69 15.69 10.14 13.67
basis, the salinity level increased with depth except for the prediction sites of salinity group No. 5 where a decrease occurred below 3 ft.
The statistical t-test was used to determine significance of differences among salinity groupings of the reference soils and between paired refer-ence and prediction soils within each salinity grouping. The t-values and the significance of differences are presented in Table 1.
icted Maximum Salinity group
Pred Minimum I Minimum I Maximum
i
Radiometer readings
A
— • July
L July
— 0 July 19, 1963 8, 1964 16, 1964
A a
•
A
•
• •
•
•
o•
a
• •
•
a &
) b •• •
•S.
• OP 0•
•
e°
•
•
0
, 0
...e_
•
16
14
I 12
ET
10
E 8
6
17" 4
2
•
0
December, 1966 IR 4
The only reference soil salinity groups that were not significantly dif-ferent were salinity groups 3 and 4 in which average salinity levels by each foot of depth were compared. Inspection of the curves in Fig. 1 shows that the lines for salinity groups 3 and 4 of the reference samples followed closely together. All other differences between salinity levels of reference samples for the various salinity groups were significant, indicating that the reference sites were properly selected and classified, and actually represented soils of different degrees of salinity.
Comparing the salinity levels between reference and predicted soils within each salinity group gave only one significant difference. It occurred at salinity group No. 4 for the cumulative average salinity level. This difference is evident in Fig. 1(b). It would probably not have occurred if more than two prediction sites had fallen in salinity group 4. With the exception of the one significant difference, the salinity level of the predicted samples is the same as that of the reference samples. Therefore, the salinity level of soil can be
2 4 6 8 10 12 14 16
Value of ECe, in millimhos per centimeter
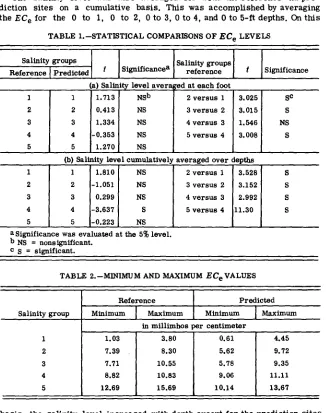
FIG. 2.—RELATION BETWEEN LEAF MINUS AMBIENT TEMPERATURE AND THE AVERAGE SOIL SALINITY (ECe)
predicted successfully within a certain range by the aerial photography tech-nique.
The minimum and maximum ECe values of the 5-ft profiles for both re-ference and prediction sites are given in Table 2. In general, the range in ECe values for reference and prediction sites is on the same order of mag-nitude. Furthermore, the ranges for each salinity group differ markedly except for salinity groups 2 and 3 of the prediction sites.
Three different predictors agreed remarkably well in predicting the salinity level on the basis of plant growth as indicated by the colored film transparencies. Only in 4 of 25 sites did the predictors disagree. In every case at least two predictors agreed, and the other only disagreed by one salinity grouping.
IR 4 SOIL SALINITY 67
reference temperature (T L - TB ) and the average soil salinity level in the 5-ft profile is illustrated in Fig. 2. The value
T L - TR = 0.927 - 0.692 (ECe)
and r = 0.839 in which r is significant at the 1% level. The data include temperature measurements made on a single date in 1963 and on two dates in 1964. Similar relationships were established for the average salinity level of the upper 3-ft profile for all three dates together and separately and for the 5-ft profile at the three dates separately. The regression equations and correlation coefficients are given in Table 3. All of the analyses gave signifi-cant regression and correlation coefficients. The data indicate that soil salinity can be predicted from cotton leaf temperature with reasonable accuracy.
TABLE 3.-REGRESSION COEFFICIENTS, INTERCEPTS, AND CORRELATION COEFFICIENTS a
Date of Temperature Measurement Depth'
in feet a °C,in b r r2
°C per millimho per centimeter
July 19, 1963 0-3 3.877 0.452 0.829 0.687
July 8, 1964 0-3 3.625 0.550 0.750 0.562
July 16, 1964 0-3 2.982 0.380 0.676 0.457
All dates together 0-3 3.497 0.453 0.782 0.611
July 19, 1963 0-5 3.692 0.419 0.805 0.648
July 8, 1964 0-5 1.855 0.627 0.760 0.578
July 16, 1964 0-5 0.988 0.512 0.756 0.571
All dates together 0-5 0.927 0.692 0.893 0.798
a Regression equations are (TL - TB ) = a + b (ECe),
in which (T L - TR) = leaf minus ambient temperature, °C., a = intercept on y-axis, °C.,
b = regression coefficient, °C per MMHO per CM,
ECe = salinity level, MMHO per CM, and r = correlation coefficient.
b Depth over which ECe was averaged.
Plant height was also measured and statistically analyzed for differences between salinity groups. Average heights in inches were 60.0 a, 47.0b, 40.5bc, 34.0e, and 17.0d for salinity ratings of 1 through 5, respectively. Values followed by the same letter do not differ significantly at the 0.05 probability level.
Some plant temperature measurements were made with the radiometer from a circling aircraft; however, there were not enough of these measure-ments to permit including them in the statistical studies. In general, however, the aerial measurements agreed well with the ground measurements, except where plant growth was sparse permitting the radiometer to measure soil surface temperatures.
KEY WORDS: aerial photography; color (materials); infrared radiation; irrigation; photogrammetry; salinity; surface temperature
ABSTRACT: Cotton was used as an indicator plant to relate the salinity in the 0 to 5 ft profile at some reference locations to that at a number of prediction sites where the salinity was unknown. Aerial photographs were taken using ektachrome infrared aero film for observing the salinity-affected cotton. On the basis of color tones, it was
pos-sible to distinguish five levels of salinity. The levels of salinity significantly affected
photographic features, making it possible to estimate with reasonable accuracy the de-gree of salinity in the soil profile from interpretation of film transparencies. Infrared radiometer measurements of cotton leaf temperatures were made on the ground and from an airplane. The limited aerial measurements compared favorable with ground mea-surements. Statistical studies of the temperature data taken on the ground indicate that soil salinity can be predicted from cotton leaf temperatures with reasonable accuracy.