STUDIES OF METHODS FOR MEASURING FORMS OF AVAILABLE SOIL NITROGEN
ALBERT S. HUNTER AND DAVID L. CARTER United States Department of Agriculture'
Received for publication August 18, 1964
In modern agriculture, crop growth is more often limited by N than by any other nutrient element. Despite this, there is as yet no method for testing soils for N available to a crop that is generally considered to be satisfactory. Several attempts have been made to develop soil tests for evaluating N fertilizer needs under specific field conditions. Commonly, the efficacy of these tests has been evaluated from data on crop yield responses to applied N fertilizer. Few if any attempts have been made to evaluate this efficacy from measurements of the contributions of indigenous soil N to the N nutrition of plants. A series of papers from Iowa (3, 6, 10) de-scribed a testing method, adapted to routine use, for estimating the production of nitrate N in soil. By this method, soil is leached free of nitrate N, adjusted to approximately field ca-pacity, and incubated for 2 weeks at 35° C., after which the amount of nitrate N developed during incubation is measured. When the test was calibrated in relation to crop yield responses to N fertilizers applied to Iowa soils, a fair degree of negative correlation was reported.
Fried and Dean (5) proposed a formula by which the relative contributions of indigenous and applied forms of a nutrient element to the nutrition of a crop may be calculated from quantitative measurements of the amounts of a "tagged" or "tracer" form of the nutrient in fertilizer and in plant. They have shown that by use of a radioactive P fertilizer the availability of indigenous soil P may be measured relative to that of the tagged fertilizer applied, regard-less of crop-yield response relationships. The Fried and Dean technique has been employed Corvallis, Oregon. The present address of the senior author is : Department of Soils, vania State University, University Park, Pennsyl-vania. The present address of the junior author is : Snake River Conservation Research Center, Route 1, Box 186, Kimberly, Idaho 83341.
(4, 9) to evalute the relative suitability of alter-native soil testing procedures for estimation of levels of available soil P and S.
Bartholomew et al. (2) demonstrated that by use of N fertilizer tagged with the stable isotope N15 the relative contributions of fer-tilizer N and indigenous forms of soil N to the N nutrition of plants may be measured. In their experiment, only 11 to 29 per cent of the total N absorbed by oats was derived from the fer-tilizer applied; the remaining 71 to 89 per cent was from the indigenous soil N.
Because of time and expense requirements, use of tagged fertilizers for estimation of soil nu-trient levels is not considered practical for routine soil testing. They may be used, how-ever, for the evaluation of chemical soil-testing procedures proposed for routine use.
In the experiment reported herewith, N fer-tilizers tagged with N15, and similar untagged fertilizers, were employed specifically to: (a)
evaluate the Iowa test for soil N relative to the contributions of indigenous soil N to the N nutrition of plants; (b) compare the values for available soil N obtained by use of tagged nitrate and ammonium N fertilizers and by varied amounts of nitrate fertilizer; and (c) study the relationships between levels of several forms of indigenous N and the contributions of indige-nous and fertilizer N to the N nutrition of plants.
MATERIALS AND METHODS
MEASURING FORMS OF AVAILABLE N 113 Dufur silt loam. In general characteristics and
past treatment, the wheatland soils were very similar.
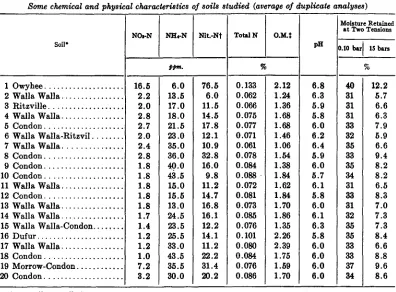
Soil samples were air-dried, crushed, sieved (approximately 5 mm.), and mixed. Samples were extracted by water and analyzed for ni-trate N by the phenoldisulfonic acid method (1, 7), and for ammonium N by salt extraction and nesslerization (1, 8). Nitrifiable N was determined by the Iowa method (10). Analyses were made for organic matter by the Walkley-Black procedure (12), pH by glass electrode, and total N by the Kjeldahl method. The amounts of moisture retained against 0.1 and 15 bars tension (11) were determined.
Data on certain physical and chemical prop-erties of the 20 soils studied are presented in table 1. In several respects the irrigated Owyhee loam (soil 1) was notably different from the others.
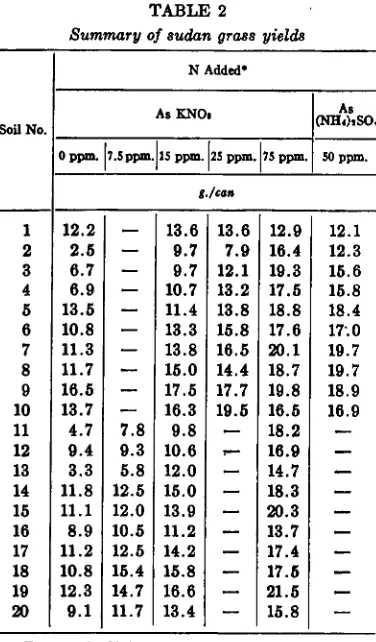
For evaluating the availability of indigenous soil N to plants, a greenhouse experiment was conducted in the summer and fall of 1957. Sudan grass was grown in 2700-g. samples of soil con-tained in No. 10 cans.
Fertilizer solutions were added by means of pipettes. Uniform applications of K.SO. and H.P0, were made to supply 25 ppm. of S and 75 ppm. of P.O.. Five treatments were com-pared on soils 1 to 10. Treatment 1 was without additional N; treatments 2 and 3 were 25 and 75 ppm. of N from KNO. , respectively; treatment 4 was 15 ppm. of N supplied from KN150. (31.12 per cent excess N15) ; and treatment 5 was 50 ppm. of N supplied from (N15134)2SO4 (7.97 per cent excess N15). Four treatments were compared on soils 11 to 20. Treatment 1 was without N addition; treatment 2 was 75 ppm. of N supplied from KNO. ; and treat-ments 3 and 4 were 7.5 and 15 ppm. of N
TABLE 1
Some chemical and physical characteristics of soils studied (average of duplicate analyses)
Soil*
NO,-N N$.-N Nit.-NI Total N 0.M.:
PH
Moisture Retained at Two Tensions
0.10 bad 15 bars
P/Pni. 17 c,/0
1 Owyhee 16.5 6.0 76.5 0.133 2.12 6.8 40 12.2
2 Walla Walla 2.2 13.5 6.0 0.062 1.24 6.3 31 5.7
3 Ritzville 2.0 17.0 11.5 0.066 1.36 5.9 31 6.6
4 Walla Walla 2.8 18.0 14.5 0.075 1.68 5.8 31 6.3
5 Condon. 2.7 21.5 17.8 0.077 1.68 6.0 33 7.9
6 Walla Walla-Ritzvil. 2.0 23.0 12.1 0.071 1.46 6.2 32 5.9
7 Walla Walla 2.4 35.0 10.9 0.061 1.06 6.4 35 6.6
8 Condors. 2.8 36.0 32.8 0.078 1.54 5.9 33 9.4
9 Condon. 1.8 40.0 16.0 0.084 1.38 6.0 35 8.2
10 Condon. 1.8 43.5 9.8 0.088 1.84 5.7 34 8.2
11 Walla Walla 1.8 15.0 11.2 0.072 1.62 6.1 31 6.5
12 Condon. 1.8 15.5 14.7 0.081 1.84 5.8 33 8.3
13 Walla Walla 1.8 13.0 16.8 0.073 1.70 6.0 31 7.0
14 Walla Walla 1.7 24.5 16.1 0.085 1.86 6.1 32 7.3
15 Walla Walla-Condon 1.4 23.5 12.2 0.076 1.35 6.3 35 7.3
16 Dufur 1.2 25.5 14.1 0.101 2.26 5.8 35 8.4
17 Walla Walla 1.2 33.0 11.2 0.080 2.39 6.0 33 6.6
18 Condon. 1.0 43.5 22.2 0.084 1.75 6.0 33 8.8
19 Morrow-Condon 7.2 35.5 31.4 0.076 1.59 6.0 37 9.6
20 Condon 3.2 30.0 20.2 0.086 1.70 6.0 34 8.6
* All soils are silt loarns.
supplied from KN150, , respectively. Levels of other nutrients were considered adequate in the study soils. Approximately three-quarters of the soil for each can was added, the fertilizer solution applied, and the remaining soil placed on top. All treatments were randomized and in duplicate for each soil.
Following fertilizer treatment, five hills of sudan grass (Sorghum vulgare sudanense) were planted in each can of soil and the soils mois-tened with water equivalent to that retained at 0.1 bar tension. To make the environment of the treated soils more uniform, additional pots of soil, treated with ordinary nitrogen and planted with sudan grass, served as outside rows on the greenhouse benches.
A few days after emergence, the sudan grass plants were thinned to five per pot. The potted soils were irrigated frequently to maintain the moisture content within a narrow range below that present at a tension of 0.1 bar.
TABLE 2
Summary of sudan grass yields
Soil No.
N Added'
As ENO, (NH4)2SO4As
0 ppm. 17.5 ppm.II5 ppm.125 ppm. 75 ppm. 50 ppm.
g./can
1 12.2 13.6 13.6 12.9 12.1
2 2.5 9.7 7.9 16.4 12.3
3 6.7 9.7 12.1 19.3 15.6
4 6.9 10.7 13.2 17.5 15.8
5 13.5 11.4 13.8 18.8 18.4
6 10.8 13.3 15.8 17.6 17%0
7 11.3 13.8 16.5 20.1 19.7
8 11.7 15.0 14.4 18.7 19.7
9 16.5 17.5 17.7 19.8 18.9
10 13.7 16.3 19.5 16.5 16.9
11 4.7 7.8 9.8 18.2
12 9.4 9.3 10.6 r... 16.9
13 3.3 5.8 12.0 14.7
14 11.8 12.5 15.0 18.3
15 11.1 12.0 13.9 20.3
16 8.9 10.5 11.2 13.7
17 11.2 12.5 14.2 17.4
18 10.8 15.4 15.8 17.5
19 12.3 14.7 16.6 21.5
20 9.1 11.7 13.4 15.8
* To supply N in ppm. concentrations shown.
Four weeks after seeding, the sudan grass was harvested by clipping immediately above the crown. Yields of dry matter were determined. Analyses were made for total N in the harvested plant material. In the case of the sudan grass from soils treated with N15, analyses for per cent N15 in excess of normal were made by mass spectrometer' For these analyses, samples from the two replications were, for each treat-ment, composited.
From the N15 contents of the plant material the percentages of N derived from the fertilizer and the resulting N-values were calculated from the following equations, which are similar to those proposed by Fried and Dean (5) for P:
A soil A plant
B soil B plant (1)
B plant
Y (2)
A plant
+
B plantN-value - B soil (1 - Y)
Y (8)
where A soil = amount indigenous soil N; B soil = amount fertilizer N applied to soil; A plant = amount of N in plant derived from indigenous soil N; B plant = amount of N in plant derived from fertilizer N; Y = propor-tion of total N in plant derived from fertilizer; and N-value = indigenous soil N as available to sudan grass, during growth period, as the applied fertilizer N.
RESULTS AND DISCUSSION
Except on soils 1 and 5, the yields of sudan grass increased with increasing amounts of ap-plied nitrate N, as shown in table 2. In most instances yield increases were approximately linear with respect to the N level. In soil 10 the response was apparently curvilinear.
115 MEASURING FORMS OF AVAILABLE N
ption of soil 13. Furthermore, the percent-of N derived from the 50-ppm. level percent-of 5I14)„SO4 were almost twice the percentages Ted from KN150, at the 15-ppm. level. 3e data indicate that the higher the fertilizer , the greater is the proportion of N uptake
is derived from the fertilizer.
able 4 shows the N values calculated by Fried and Dean formulae from the data .fined from applications to give levels of 7.5 15 ppm. N as KN150, , and 50 ppm. N as 5H4) 2504 . Analyses of variance showed that alues calculated from the 7.5- and 15-ppm. vels for soils 11 through 20 were not sig-antly different. Furthermore, for soils 1 ugh 10, the N-values calculated from the
TABLE 3
cent excess N15 in sudan grass, and per cent of plant N derived from fertilizer
N Applied •
1 No.
As K.N15017 As (N15114)sSO4I
7.5 ppm. 15 ppm. SO ppm.
Excess Plant Excess Plant Excess Plant N 15 N* N IS N§ N15 N§
%
1 -- -- 4.67 15.0 2.80 35.1
2 -- -- 9.74 31.3 4.68 58.7
3 -- -- 10.66 34.3 4.83 60.6 4 -- -- 10.01 32.2 4.53 56.8
5 -- -- 9.27 29.8 4.37 54.8
6 -- -- 8.16 26.2 3.90 48.9
7 -- -- 4.28 13.8 3.93 49.3
8 -- -- 6.82 21.9 3.62 45.4
9 -- -- 6.19 19.9 3.30 41.4
10 -- -- 5.80 18.6 3.19 40.0
11 6.85 22.0 11.37 36.5 -- -12 5.83 18.7 10.63 34.2 --
-13 7.45 23.9 5.43 17.4 --
-14 4.01 12.9 7.04 22.6 --
-15 4.51 14.5 8.35 26.8 --
-16 4.58 14.7 8.24 26.5 --
-17 4.25 13.7 7.56 24.3 --
-18 3.02 9.7 5.47 17.6 --
-19 3.89 12.5 6.79 21.8 --
-20 4.24 13.6 7.50 24.1 -- --At ppm. concentrations shown.
31.12% excess N15. 7.97% excess N15. From fertilizer.
TABLE 4
N values for soils treated with KN150 3 and (N15H 4) 2804
Soil No.
N-Values (ppm )
EN1503 (N15H4),SO4
7.5 ppm. N 15 ppm. N 50 ppm. N
1 85 93
2 33 35
3 29 33
4 32 38
5 36 42
6 42 53
7 94 54
8 54 61
9 61 71
10 66 75
11 29 26
12 33 29
13 24 54
14 51 52
15 45 41
16 44 42
17 48 47
18 70 71
19 53 54
20 48 47
15-ppm. level of KN150, and the 50-ppm. level of (N15EI4 ),SO4 did not differ significantly. These findings indicate that all three levels of N and both materials could have been employed with equal success in the determination of N-values. As was expected, with each level and type of N there were significant differences between soils.
Correlation coefficients relating various pairs of variables compared in the study are pre-sented in table 5. The correlation between N-values and nitrifiable N was not significant, indicating that the two methods measured dif-ferent forms of N in the soil. The best relation-ship obtained was between N-value and total N. This suggests that the total N level of the soil may be as good a measure of N availability in these Oregon soils as has been found to date. The relationship between total N and yield, however, was not significant. This would indicate that yield was affected by factors other than N availability as determined by total N. It is important to note that N-values were rather
Variables Compared Correlationcoefficient, (r)
Indigenous nitrate N vs. yield Indigenous ammonium N vs. yield Nitrifiable indigenous nitrogen vs.
yield .
Indigenous nitrate ammonium N vs.
yield
Indigenous nitrate ammonium + nitrifiable indigenous nitrogen vs.
yield
N-value vs. yield N-value vs. nitrifiable N N-value vs. ammonium N N-value vs. total N
Total indigenous N vs. yield
0.102 0.507* 0.210 0.585*
0.471* 0.675** 0.463 0.426 0.707** 0.395 TABLE 5
Correlations between yield of sudan grass and variables measured for predicting N
needs on soils
* Indicates r significant . at P = 0.05. ** Indicates r significant at P = 0.01.
closely related to sudan grass yield and total N, although total N was not significantly related to yield.
The highest degree of correlation between sudan grass yield and other variables was that between N-value and yield. This indicates that, of the N-measuring methods under study, the N-value method, or the method of estimating the amount of indigenous soil N as available to the plants as the added fertilizer N, was the best measure of N in soil actually available to plants. This method, therefore, appears to have some merit for providing values against which the values obtained by other, less-time-consum-ing methods proposed for routine measurement of various forms of available soil N, either sepa-rately or in total, may be compared and evaluated.
The correlation between nitrate N and yield of sudan grass was very low and not significant. The same was true of the correlation between nitrifiable N, as measured by the Iowa method, and yield. A significant correlation, however, was found between ammonium N and yield. Furthermore, a higher correlation existed be-tween ammonium plus nitrate N and sudan grass yield. There was also a significant correla-tion between ammonium plus nitrate plus
nitrifi-able N and yield, but the relationship was better without nitrifiable N. Since nitrifiable N is the nitrate N formed during incubation from both ammonium and organic matter sources, these results are not really surprising.
The data suggest that N-values, indigenous ammonium N, and indigenous ammonium plus nitrate N may all be of value in predicting N needs of these Oregon soils. N-values are the most promising, but they are too expensive for routine use, and techniques involved in their determination are not readily adaptable for predictive purposes.
SUMMARY AND CONCLUSIONS
The availability of indigenous soil N to sudan grass plants was evaluated in 20 Oregon soils by use of the Iowa test for nitrifiable N by N-values calculated from data obtained with tagged N fertilizer and by determinations of nitrate, ammonium, and total N. Isotopic N15 was used in ammonium and at two levels in the nitrate form.
The N-value method for estimating the amount of soil N as that available as added fertilizer N proved to be the best measure of N availability. Nitrifiable N was not significantly related to crop yield nor to N-values. N-values were highly significantly correlated with total N. Similar N-values were obtained by use of tagged ammonium and nitrate N, and by use of two levels of the latter.
REFERENCES
(1) Alban, L. A., and Kellog, M. 1959 Meth-ods of soil analysis. Oregon Agr. Expt. Sta. Misc. Paper 65.
(2) Bartholomew, W. F., Nelson, L. B., and Werkman, C. H. 1950 The use of the nitrogen isotope N15 in field studies with oats. Agron. J. 42: 100-103.
(3) Fitts, J. W., Bartholomew, W. V., and Heidel, H. 1955 Predicting nitrogen fertilizer needs of Iowa soils: 1. Soil Sci. Soc. Am. Proc. 19: 69-73.
(4) Fitts, J. W., et al. 1956 "Soil test results compared with field, laboratory, and green-house results." N. Carolina Agr. Expt. Sta. Tech. Bull. 121.
(5) Fried, M., and Dean, L. A. 1952 A concept concerning the measurement of available soil nutrients. Soil Sci. 73: 263-271.
MEASURING FORMS OF AVAILABLE N 117
soils: III. Soil Sci. Soc. Am. Proc. 19: 77-80.
) Harper, H. J. 1924 The accurate determi-nation of nitrates in soils. Phenoldisulfonic acid method. Ind. and Eng. Chem. 16: 180-183.
I) Harper, H. J. 1924. The determination of ammonia in soils. Soil Sci. 18: 409-418. I) Kilmer, V. J., and Nearpass, D. C. 1960
The determination of available sulfur in soils. Soil Sci. Soc. Am. Proc. 24: 337-340.
(10) Stanford, G., and Hanway, J. 1955 Pre-dicting nitrogen fertilizer needs of Iowa soils: II. Soil Sci. Soc. Am. Proc. 19: 74-77. (11) United States Salinity Laboratory Staff 1954
Diagnosis and improvement of saline and alkali soils. Agricultural Handbook 60. (12) Walkley, A., and Black, I. A. 1934 An