Prediction of Students Passedon Time with
Classification Technique Using Have Naïve Bayes
Algorithm
RahayuWidiono*, BontaZirvieraCirgon**, Sonny NugrohoAji***, Subhiyanto****, AndriRiyadi*****
*(Magister of Computer Science, Faculty of Information Technology, Budi Luhur University Jl. Raya Ciledug, Petukangan Utara, Kebayoran Lama, South Jakarta 12260, Indonesia
Email: [email protected])
** (Magister of Computer Science, Faculty of Information Technology, Budi Luhur University Jl. Raya Ciledug, Petukangan Utara, Kebayoran Lama, South Jakarta 12260, Indonesia
Email: [email protected])
***(Magister of Computer Science, Faculty of Information Technology, Budi Luhur University Jl. Raya Ciledug, Petukangan Utara, Kebayoran Lama, South Jakarta 12260, Indonesia
Email: [email protected])
****(Magister of Computer Science, Faculty of Information Technology, Budi Luhur University Jl. Raya Ciledug, Petukangan Utara, Kebayoran Lama, South Jakarta 12260, Indonesia
Email: [email protected])
*****(Magister of Computer Science, Faculty of Information Technology, Budi Luhur University Jl. Raya Ciledug, Petukangan Utara, Kebayoran Lama, South Jakarta 12260, Indonesia
Email: [email protected])
---
************************
---Abstract:
Student data and student graduation data at Budi Luhur University produce abundant data in the form of student profile data and academic data. This happens repeatedly and causes a buildup of student data so that it affects the search for information on that data. This study aims to classify student data at the Budi Luhur University Faculty of Information Technology class of 2011 - 2013 S1 and SI study program levels by utilizing the data mining process using classification techniques. The method used is CRISP-DM through a process of business understanding, data understanding, data preparation, modeling, evaluation and deployment. The algorithm used in this study is the Naïve Bayes algorithm. Naïve Bayes is a simple probabilistic based prediction technique based on the application of the Bayes theorem or rules with a strong assumption of independence on features, meaning that a feature in a data is not related to the presence or absence of other features in the same data. The attributes used are Force, Gender, Study Program, Working Status, Scholarship Status, Father's Income, Semester 1 IP, Semester 2 IP, Semester 3 IPS, Semester 1 SKS, Semester 2 SKS, Semester 3 SKS and Judicial Date. The results of this study have an accuracy level of 90.36 and can be used as a basis for making decisions to determine policies by the University of Budi Luhur.
Keywords —Naïve Bayes Classifier, CRISP-DM.
---
************************
---I. INTRODUCTION
Higher education is one of the organizations that provide educational services to the community and a place to pursue higher education. With the development of the era, there are also more universities as providers of academic education for
students. Both public and private universities compete to be the best tertiary institution to produce the best graduates. Under RI Law No. 20, universities are expected to provide quality education for students so as to produce knowledgeable, capable and thoughtful human resources. One factor that determines the quality of
tertiary institutions is the percentage of students' ability to complete their studies on time.
Based on the accreditation instrument assessment matrix of the Higher Education National Accreditation Agency study program, the percentage of students who graduate on time is one element of university accreditation assessment. Universities try hard so that the percentage of students who graduate on time is always high, however there is an imbalance between the entry and exit of students who have completed their studies. Students who enter in large numbers, but students who graduate on time in accordance with the provisions of far are very small compared to the entry. This results in the accumulation of high numbers of students in each graduation period.
One of the providers of education in South Jakarta is Budi Luhur University, located on Jl Raya Ciledug, North Pertukangan, South Jakarta. The problems that occur are students who enter in large numbers, but students who graduate on time are far less than the entry. Budi Luhur University also does not yet have a system to get an accurate level of student graduation on time.
To overcome this problem the authors use the classification technique method with the Naïve Bayes algorithm. Naïve Bayes was chosen because it was considered to have high accuracy in the process of all the attributes used.
II.THEORETICALBASIS
A. Definition of Prediction
A process of estimating systematically about something that is most likely to occur in the future based on past and present information that is owned, so that the error (the difference between something that happens with the estimated results) can be minimized. Prediction does not have to provide a definite answer to events that will occur, but rather try to find answers as close as possible to happen [1].
B. Understanding Data Mining
According to Han, J. Kamber, M & Jian, Pei said that "Data mining is a scientific discipline that studies methods for extracting knowledge or finding patterns from data [2]. According to
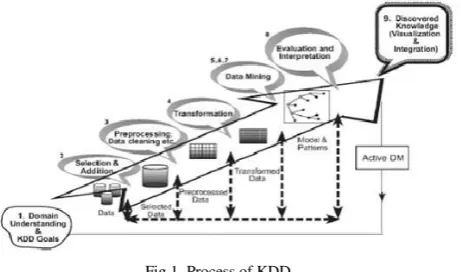
Santosa, data mining is a method of processing data to find hidden patterns from the data. The results of data processing with this data mining method can be used to make decisions in the future. Data mining is also known as pattern recognition [3]. Han, J. Kamber, M & Jian, Pei mentioned that KDD or Knowledge Discovery from Data, is a structured process, which is as follows:
1) Data Cleaning is the process of cleaning data from data noise and is not consistent.
2) Data Integration is the process of combining data from several different sources.
3) Data Selection is the process of selecting data from a database that is suitable for the purpose of analysis.
4) Data Transformation is the process of changing the shape of data into data suitable for the Mining process
5) Data Mining is an important process that uses a certain method to obtain a pattern from data. 6) Pattern Evaluation is the process of
identifying patterns.
KDD is an organized process for identifying valid, new, useful and understandable patterns from a large and complex dataset [4].
Fig 1. Process of KDD
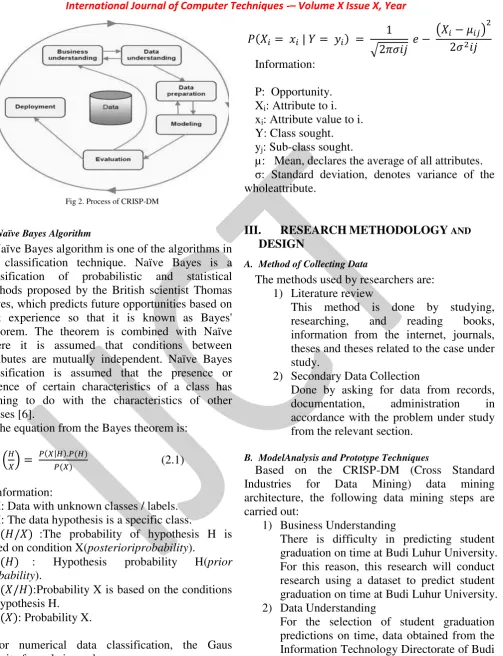
C. CRISP-DM
Fig 2. Process of CRISP-DM
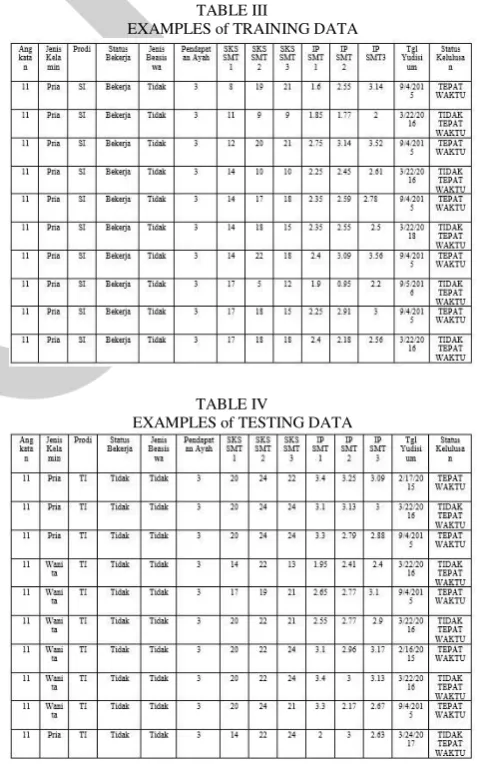
D. Naïve Bayes Algorithm
Naïve Bayes algorithm is one of the algorithms in the classification technique. Naïve Bayes is a classification of probabilistic and statistical methods proposed by the British scientist Thomas Bayes, which predicts future opportunities based on past experience so that it is known as Bayes' Theorem. The theorem is combined with Naïve where it is assumed that conditions between attributes are mutually independent. Naïve Bayes classification is assumed that the presence or absence of certain characteristics of a class has nothing to do with the characteristics of other classes [6].
The equation from the Bayes theorem is:
𝑃 (𝐻𝑋) = 𝑃(𝑋|𝐻).𝑃(𝐻)𝑃(𝑋) (2.1)
Information:
X: Data with unknown classes / labels. H: The data hypothesis is a specific class.
𝑃(𝐻/𝑋) :The probability of hypothesis H is based on condition X(posterioriprobability).
𝑃(𝐻) : Hypothesis probability H(prior probability).
𝑃(𝑋/𝐻):Probability X is based on the conditions in hypothesis H.
𝑃(𝑋): Probability X.
For numerical data classification, the Gaus Density formula is used:
𝑃(𝑋𝑖 = 𝑥𝑖 | 𝑌 = 𝑦𝑖) = 1
√2𝜋𝜎𝑖𝑗 𝑒 −
(𝑋𝑖− 𝜇𝑖𝑗)2 2𝜎2𝑖𝑗
Information:
P: Opportunity. Xi: Attribute to i.
xi: Attribute value to i.
Y: Class sought. yj: Sub-class sought.
µ: Mean, declares the average of all attributes.
σ: Standard deviation, denotes variance of the wholeattribute.
III. RESEARCHMETHODOLOGY AND
DESIGN
A. Method of Collecting Data
The methods used by researchers are: 1) Literature review
This method is done by studying, researching, and reading books, information from the internet, journals, theses and theses related to the case under study.
2) Secondary Data Collection
Done by asking for data from records, documentation, administration in accordance with the problem under study from the relevant section.
B. ModelAnalysis and Prototype Techniques
Based on the CRISP-DM (Cross Standard Industries for Data Mining) data mining architecture, the following data mining steps are carried out:
1) Business Understanding
There is difficulty in predicting student graduation on time at Budi Luhur University. For this reason, this research will conduct research using a dataset to predict student graduation on time at Budi Luhur University. 2) Data Understanding
of which 13 are predictor attributes and 1 attribute is results. The attributes that are parameters are shown in table I, namely the attribute reference:
TABLE I
ATTRIBUTE AND VALUE CATEGORIES
No Attribute Value Information
1 Generation 1 11
2 12
3 13
2 Gender 1 Male
2 Female
3 Majors 1 Information
System
4 Working Status 0 No
1 Yes
5 Type of Scholarship 0 No
1 Yes
6 Father’s Income 0 Less than 500000 1 500000 – 999999 2 1000000 –
1999999 3 2000000 – 4999999 4 5000000 – 20000000 5 More Than
20000000 7 SKS Lulus Semester
1
8 SKS Lulus Semester 2
9 SKS Lulus Semester 3
10 IP Semester 1 0 Less than 1,5 1 1,5 – 2,40 2 2,41 – 3,40 3 3,41 – 4 11 IP Semester 2 0 Less than 1,5
1 1,5 – 2,40 2 2,41 – 3,40 3 3,41 – 4 12 IP Semester 3 0 Less than 1,5
1 1,5 – 2,40 2 2,41 – 3,40 3 3,41 – 4 13 Judicial Date
14 Passed Information on Time Not on Time
3) Data Preparation
The data obtained for this study were 1556 student records. To get quality data, there are several preprocessing techniques that are used, namely:
a. Data validation, to identify odd data (outliner / noise), inconsistent data, and incomplete data (missing value). From the attributes contained odd and inconsistent data is the father's income attribute, IPS semester1, IPS semester2, IPS semester3.
b. Data size reduction and discretization, to obtain a dataset with a smaller number of attributes and records that are informative. After the preprocessing process can be done training data. Training data is obtained from the distribution of data sources totaling 1556 records, where by using the holdout method two-thirds of the data sources namely records are allocated for training data and the remaining one third is records allocated for testing data.
4) Modeling Phase
This stage is also called the learning stage because at this stage the classification training data by the model then produces a number of rules. In this study, modeling using the Naïve Bayes algorithm.
5) Evaluation Phase
In the evaluation phase, testing of models is carried out to obtain accurate model information. Evaluation and validation using precission, recall, f-measure and accuracy. 6) Deployment
After forming the model and analyzing and measuring it in the previous stage, then at this stage the most accurate model is also applied to determine the classification of student graduation predictions on time.
C. Testing
Accuracy in classification is the percentage of accuracy of data records that are classified correctly after testing the results of classification.
Precision is a positive predicted case proportion that is also true positive on the actual data. Recall is the proportion of positive cases that are actually correctly predicted correctly.
TABLE II CONFUSION MATRIX
True Class Positive Negative
Predicated class
Positive True Positive
(TP)
False Negative
(FN)
Negative False Negative
(FN)
True Negative
(TN)
True positives (tp) are the number of positive records in the dataset that are classified as positive or the number of positive records in the dataset that were detected correctly. True negative (tn) is the number of negative records in the dataset that are classified negatively or the number of negative records in the dataset that are detected correctly.
False positive (fp) is the number of negative records in a dataset that are classified positively or the number of negative records in a dataset that are detected as positive data while False negative (fn) is the number of positive records in a dataset that is classified negatively or the number of positive records in the dataset detected as data. negative. Here is the confusion matrix model equation:
1) Precisionused to measure how much the proportion of positive data classes that successfully predicted correctly from the overall positive class prediction results, which is calculated using the equation:
𝒑𝒓𝒆𝒄𝒊𝒔𝒊𝒐𝒏 =𝒕𝒑+𝒇𝒑𝒕𝒑 (3.1)
2) Recallused to show the percentage of positive data classes that were successfully predicted correctly from the overall positive class data, which is calculated by the equation:
𝑟𝑒𝑐𝑎𝑙𝑙 = 𝑡𝑝+𝑓𝑛𝑡𝑝 (3.2) 3) F-Measure is a combination of precision and
recall which is used to measure the ability of the algorithm in classifying minority classes.
The f-measure calculation uses the function as follows:
4) 𝐹 − 𝑀𝑒𝑎𝑠𝑢𝑟𝑒 =2 𝑥 𝑟𝑒𝑐𝑎𝑙𝑙 𝑥 𝑝𝑟𝑒𝑐𝑖𝑠𝑠𝑖𝑜𝑛
𝑟𝑒𝑐𝑎𝑙𝑙+𝑝𝑟𝑒𝑐𝑖𝑠𝑠𝑖𝑜𝑛 (3.3)
5) Accuracyis the amount of comparison of the correct data with the total amount of data. Can be calculated using the equation:
𝑎𝑐𝑐𝑢𝑟𝑎𝑐𝑦 =𝑡𝑝+𝑡𝑛+𝑓𝑝+𝑓𝑛𝑡𝑝+𝑡𝑛 𝑥 100 % (3.4)
IV. RESULT AND DISCUSSION A. Data Grouping
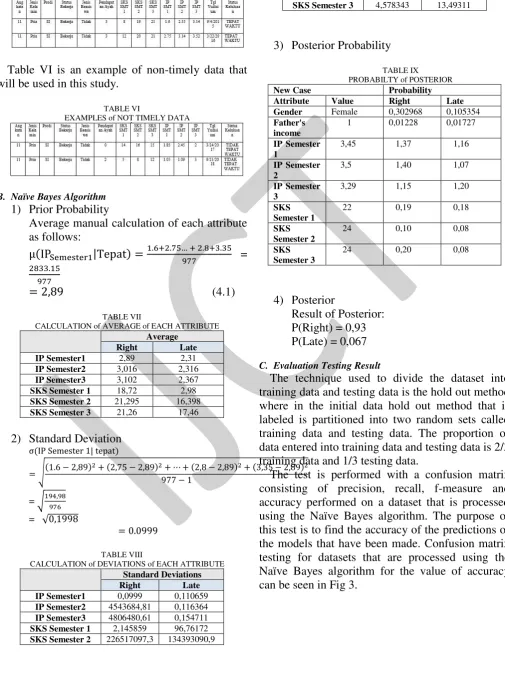
Table III provides 10 examples of training data that will be used in this study.
TABLE III
EXAMPLES of TRAINING DATA
TABLE IV
EXAMPLES of TESTING DATA
Table V is an example of timely data that will be used in this study.
EXAMPLES of TIMELY DATA
Table VI is an example of non-timely data that will be used in this study.
TABLE VI
EXAMPLES of NOT TIMELY DATA
B. Naïve Bayes Algorithm
1) Prior Probability
Average manual calculation of each attribute as follows:
µ(IPSemester1|Tepat) =1.6+2.75… + 2.8+3.35977 = 2833.15
977
= 2,89 (4.1)
TABLE VII
CALCULATION of AVERAGE of EACH ATTRIBUTE
Average Right Late IP Semester1 2,89 2,31
IP Semester2 3,016 2,316
IP Semester3 3,102 2,367
SKS Semester 1 18,72 2,98
SKS Semester 2 21,295 16,398
SKS Semester 3 21,26 17,46
2) Standard Deviation
σ(IP Semester 1| tepat)
= √(1.6 − 2,89)2+ (2,75 − 2,89)2977 − 1+ ⋯ + (2,8 − 2,89)2+ (3,35 − 2,89)2
= √194,98976
= √0,1998
= 0.0999
TABLE VIII
CALCULATION of DEVIATIONS of EACH ATTRIBUTE
Standard Deviations Right Late IP Semester1 0,0999 0,110659
IP Semester2 4543684,81 0,116364
IP Semester3 4806480,61 0,154711
SKS Semester 1 2,145859 96,76172
SKS Semester 2 226517097,3 134393090,9
Standard Deviations SKS Semester 3 4,578343 13,49311
3) Posterior Probability
TABLE IX
PROBABILTY of POSTERIOR
New Case Probability Attribute Value Right Late Gender Female 0,302968 0,105354
Father's income
1 0,01228 0,01727
IP Semester 1
3,45 1,37 1,16
IP Semester 2
3,5 1,40 1,07
IP Semester 3
3,29 1,15 1,20
SKS Semester 1
22 0,19 0,18
SKS Semester 2
24 0,10 0,08
SKS Semester 3
24 0,20 0,08
4) Posterior
Result of Posterior: P(Right) = 0,93 P(Late) = 0,067
C. Evaluation Testing Result
The technique used to divide the dataset into training data and testing data is the hold out method where in the initial data hold out method that is labeled is partitioned into two random sets called training data and testing data. The proportion of data entered into training data and testing data is 2/3 training data and 1/3 testing data.
Fig 3. Evaluation Testing Results
V.CONCLUSSION
Based on research that has been done, it can be concluded as follows:
From the results of the research that has been carried out, it can be concluded that the application of data mining using the Naïve Bayes algorithm can predict the accuracy of students' graduation on time with the determined study period with the results of testing the accuracy level of 90.36%.
ACKNOWLEDGMENT
Based on the results of the conclusions, the authors provide suggestions. Although the Naïve Bayes algorithm has a high accuracy value, further research is needed, the following things can be added to improve accuracy and performance by using other classification algorithms contained in data mining, such as the C45 algorithm, ID3, CART, Support Vector Machine.
REFERENCES
[1] Herdianto (2013) ‘PREDIKSI KERUSAKAN MOTOR INDUKSI MENGGUNAKAN TESIS Oleh HERDIANTO FAKULTAS TEKNIK’.
[2] Han, J., Kamber, M. and Pei, J. (2011) Data Transformation by Normalization, Data Mining: Concepts and Techniques. doi: 10.1016/B978-0-12-381479-1.00001-0.
[3] Santosa, B. (2007) Teknik Pemanfaatan Data Untuk Keperluan Bisnis Teori dan Aplikasi. 1st edn. Graha Ilmu. Available at: https://docplayer.info/29578838-Ii-data-mining-teknik-pemanfaatan-data-untuk-keperluan-bisnis.html.
[4] Oded Maimon, L. R. (2010) Data Mining and Knowledge Discovery Handbook, 2nd ed. 2nd edn. Edited by L. R. Oded Maimon. Springer.
Available at:
https://www.researchgate.net/publication/236005657_Data_Mining_an d_Knowledge_Discovery_Handbook_2nd_ed.
[5] Olson, D. L. and Delen, D. (2008) Advanced data mining techniques, Advanced Data Mining Techniques. doi: 10.1007/978-3-540-76917-0.
[6] Bustami (2010) ‘Penerapan Algoritma Naive Bayes untuk Mengklasifikasi Data Nasabah’, TECHSI: Jurnal Penelitian Teknik Informatika, 4, pp. 127–146. doi: 10.26555/JIFO.V8I1.A2086. [7] Defiyanti, S. (2014) ‘Perbandingan : Prediksi Prestasi Belajar
Mahasiswa Menggunakan Teknik Data Mining (Study Kasus Fasilkom Unsikas)’, Konfrensi nasional Sistem Informasi, (March 2014), p. 11. [8] Gorunescu, F. (2011) Data Mining Concept Model and Technique.
volume 12. Edited by J. Kac. Springer. Available at: https://tktung.files.wordpress.com/2015/12/florin_gorunescu_data_min ing_concepts_models.pdf.
[9] Murtopo, A. A. (2015) ‘Prediksi Kelulusan Tepat Waktu Mahasiswa STMIK YMI Tegal Menggunakan Algoritma Naïve Bayes Time Graduation Prediction by Using Naïve Bayes Algorithm at STMIK YMI Tegal’, pp. 145–154.
[10] Naziah Amalia, Shaufiah, S. S. (2015) ‘Penerapan Teknik Data Mining Untuk Klasifikasi Ketepatan Waktu Lulus Mahasiswa Teknik Informatika Universitas Telkom Menggunakan Algoritma Naive Bayes Classifier’. Available at: https://docplayer.info/46922815-Kata-kunci-
ketepatan-waktu-lulus-klasifikasi-data-mining-naive-bayes-classifier.html.
[11] Nugroho, Y. S. (2014) ‘DATA MINING MENGGUNAKAN NAIVE BAYES UNTUK KLASIFIKASI KELULUSAN MAHASISWA UNIV DIAN NUSWANTORO’. Available at: http://mahasiswa.dinus.ac.id/docs/skripsi/jurnal/13789.pdf.
[12] Pambudi, R. D., Supianto, A. A. and Setiawan, N. Y. (2019) ‘Prediksi Kelulusan Mahasiswa Berdasarkan Kinerja Akademik Menggunakan Pendekatan Data Mining Pada Program Studi Sistem Informasi Fakultas Ilmu Komputer Universitas Brawijaya’, Jurnal Pengembangan Teknologi Informasi dan Ilmu Komputer, 3(3), pp. 2194–2200.
[13] Romadhona, Agus; suprapedi; himawan, H. (2017) ‘Prediksi Kelulusan Tepat Waktu Mahasiswa Stmik-Ymi’, Jurnal Teknologi Informasi, 13(1), pp. 69–83.
[14] Rozzaqi, A. R. (2015) ‘Naive Bayes dan Filtering Feature Selection Information Gain untuk Prediksi Ketepatan Kelulusan Mahasiswa’, Jurnal Informatika UPGRIS, 1, pp. 30–41.
[15] Salmu, S. and Solichin, A. (2017) ‘Prediksi Tingkat Kelulusan
Mahasiswa Tepat Waktu Menggunakan Naïve Bayes : Studi Kasus
UIN Syarif Hidayatullah Jakarta’, Prosiding Seminar Nasional Multidisiplin Ilmu Universitas Budi Luhur, (April), pp. 701–709. [16] Studi, P. and Waktu, T. (2015) ‘Pengklasifikasian Kemampuan
Akademik Mahasiswa Menggunakan Metode Information Gain Dan Naive Bayes Classifier Dalam Prediksi Penyelesaian Studi Tepat Waktu’, pp. 144–149. Available at: https://publikasiilmiah.unwahas.ac.id/index.php/PROSIDING_SNST_ FT/article/view/1524.
[17] Sulistiono, H. (2015) ‘Kajian Penerapan Algoritma C4.5, Neural Network dan Naïve Bayes untuk Klasifikasi Mahasiswa yang Bermasalah dalam Registrasi’, Faktor Exacta, 8(4), pp. 305–315. [18] Susanto, S. and Suryadi, D. (2010) ‘Pengantar Data Mining’.
[19] Syarli, S. and Muin, A. A. (2016) ‘Metode Naive Bayes Untuk Prediksi
Kelulusan ( Studi Kasus : Data Mahasiswa Baru Perguruan Tinggi )’, Jurnal Ilmiah Ilmu Komputer, 2(1), pp. 1–5. doi: 10.1007/978-1-4419-1120-9.
[20] Witten, I. H., Frank, E. and Hall, M. a (2011) Data Mining:Practical Machine Learning Tools and Techniques second edition, Complementary literature
Mail your Manuscript