A MOLECULAR DYNAMICS SIMULATION OF NANOSCALE WATER
VAPOR ABSORPTION ON THE SURFACE OF LiBr AQUEOUS
SOLUTION
Hong Hu
a,*, J. N. Chung
a,†a Department of Mechanical and Aerospace Engineering, University of Florida, Gainesville, FL 32611
A
BSTRACTA new architecture for absorption refrigeration systems (ARSs) that enables a significant enhancement of heat and mass transport processes has been proposed. This enhancement in performance is expected to translate into a significant reduction is size and cost of ARSs. The key innovation in the new approach is the use of ultrathin liquid films constrained by highly permeable nanostructured membranes. This approach enables far greater performance than those in the existing macroscale. For example, in the new absorber design, the thin film of LiBr solution is constrained by hydrophobic porous membranes and the inner wall of cooling water channel. The LiBr solution is held outside of the membrane by a meniscus formed over the membrane pores. The solution is cooled by water running in the cooling channel. This paper reports a detailed analysis based on molecular dynamics simulations to obtain a fundamental understanding on the nanoscale transport processes. The effects of LiBr concentration and the water vapor temperature elevation on the condensation coefficient and condensation mass fluxes have been evaluated. A model is also developed to predict the average condensation coefficient for a complete vapor energy spectrum. A comparison between the nanoscale and macroscale condensation mass fluxes is also provided.
Keywords: Molecular Dynamics, Nanoscale, Absorption Refrigeration System
1. INTRODUCTION
Absorption refrigeration systems have been extensively used in commercial facilities due to its ability to directly use low quality waste heat for cooling purposes. However, compared with vapor compression chillers, the volume per unit cooling capacity and the initial installation cost for the absorption refrigeration system are much higher which makes it uncompetitive in small scale applications, even with a low running cost (ASHRAE Handbook, 2010).
Conventional lithium bromide (LIBr) absorption chillers are made of four main components: absorber, generator, evaporator, and condenser. In the absorber or generator, the LiBr solution is sprayed over the surfaces of the columns of pipes inside which cooling water or heat source stream is running. Water vapor is absorbed into the LiBr solution in the absorber and boiled off out of the solution in the generator. The absorption or desorption rate depends on many parameters. But one of controlling factors, as shown in the Nusselt number 𝑁𝑢 =ℎ𝐷
𝑘(h is the
heat transfer coefficient and D is hydraulic diameter, K is thermal conductivity) is the hydraulic diameter that is also the heat and mass transport length scale. It is clear that one needs to reduce those length scales in the absorber and generator in order to increase the absorption and desorption rates. The use of thin liquid films has shown to be a great potential to
enhance heat and mass transfer in the absorber and generator (Ludwig et al., 2008).
In recent years, membrane based mass exchange devices have been extensively used in separation processes (Lawson and Lloyd, 1997). In
the membrane distillation device, the liquid and vapor are separated by a porous membrane where the membrane is not wet by the liquid and no capillary condensation should take place inside the pores of the membrane. At least one side of the membrane should be in direct contact with the process liquid (Lawson and Lloyd, 1997). It has been shown that the membrane distillation has great advantages over traditional distillation methods. The membrane distillation device can be operated with a low energy consumption rate and a minimum expenditure of capital cost and land use (Lawson and Lloyd, 1997).
Development of a new generation compact and inexpensive solar and waste heat powered absorption refrigeration systems (ARSs) with a substantially better performance than the existing technology will greatly reduce the world energy consumption and carbon emission. Moreover, the ARS fluids considered have no global warming potential (GWP). A new concept that employs the nano-scale architecture for ARSs has the potential to enable an enhancement of the heat and mass transport processes involved within the system by an order of magnitude. This enhancement in performance translates to a proportional reduction in size, weight, and cost of ARSs and their simplification.
The key innovation in the new approach is the use of ultra-thin liquid films constrained by highly permeable nanostructured membranes and surface structures. Ultra-thin films (UTFs) enhance the heat and mass transfer processes (Moghaddam and Ohadi, 2005) in all four system main heat exchangers as mentioned above that account for most of the system volume and weight. This approach enables far greater performance than that achieved in the existing systems where hydrodynamics of falling films over tubes dictates the formation of thick liquid films that impede transport. In the new system architecture, evaporating and condensing refrigerant films are separated from the absorbent UTF by only a thin
Frontiers in Heat and Mass Transfer
vapor space and highly permeable nanostructured membranes. In a combined absorber/evaporator, flat panel shape, module (AEM), the absorbent UTF is mechanically constrained by a nanostructured membrane over a surface cooled by the system cooling liquid. The membrane surface facing the absorbent solution is hydrophobic with a pore size range that prevents the solution from entering the membrane. This ensures that the refrigerant molecules encounter minimum diffusion resistance as they pass through the membrane and enter the UTF absorbent. The vapor entering the membrane is generated on surface microstructures, facing the membrane, as the liquid refrigerant absorbs the chilled water heat. The generator/condenser module (GCM) construction is similar to that of AEM except that in this case refrigerant is desorbed from the solution UTF as it is heated by the heating stream. The desorbed refrigerant passes through the membrane and condenses over an enhanced surface cooled by the system coolant.
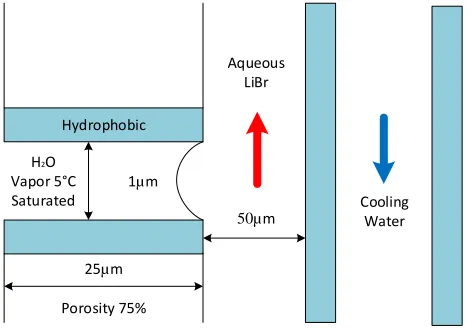
The new design of the absorber, taking advantages of both the membrane and the ultra-thin film on enhancing the heat and mass transfer, has the typical structure as shown in Fig. 1.
1µm
25µm
50µm Hydrophobic
Cooling Water Aqueous
LiBr
Porosity 75% H2O
Vapor 5°C Saturated
Fig. 1Schematic of a UTF membrane absorber system.
In the new absorber design, the thin film of LiBr solution is constrained by hydrophobic porous membranes and the inner wall of cooling water channel. The LiBr solution is held outside of the membrane by a meniscus formed over the pores of the membrane. The solution is cooled by water running in the cooling channel. The heights of solution and cooling water channels are very small: on the scales of less than 100µm. The membrane based absorber has been proposed and studied by Ali (2010). In that paper, the results of experimental work are compared with a 1-D model results. The correlations for mass and heat transfer used in that paper are from Martinez and Maroto (2007). The correlations were derived for the mass transfer inside a shell where hollow fibers are woven and uneven flows were suspected. Clearly, the flow patterns are much different between the membrane based absorber and the shell distiller. In the membrane based absorber, the flow is very similar to the Poiseuille flow with very small disturbance in the cross flow direction. While in the distillation module (Martinez and Maroto, 2007), the flow is much complicated in all velocity components and much larger velocity disturbances are from the fibers. Thus, it is not clear whether the correlations in Martinez and Maroto (2007) can be applied in the membrane based absorber.
In this paper, we focus on the physical understanding and the evaluation of the condensation efficiency for the nanoscale absorption of water vapor at the vapor-liquid interface through a condensation process. The paper is organized into two parts: 1. Evaluation of the nanoscale effects of LiBr concentration on the water vapor condensation rate, and 2. Comparison of nanoscale condensation rates with those of macroscale.
2. MD SIMULATION MODEL FOR NANOSCALE VAPOR ABSORPTION ON THE LiBr SURFACE 2.1 Nanoscale Simulation
As mentioned above, the main objective of the current study is to evaluate the effects of solute concentration on the vapor absorption (condensation) in a nanoscale framework using a molecular dynamics (MD) simulation method. Since the first principle approach of molecular dynamics simulation has been chosen as the method of approach, the scale of the model is therefore limited to the nanoscale due to the capabilities of the current computational capabilities. Since the focus of the current study is to investigate the absorption (condensation) of water vapor molecules by the LiBr aqueous solution at the vapor-liquid interface from a nanoscale point of view using molecular dynamics (MD) simulations, the initial configuration of the nanoscale model is shown in Fig. 2. The simulation domain is enclosed in a rectangular box with xyz dimensions of 100𝐴̇ × 25𝐴̇ × 25𝐴̇
(
𝐴̇ is angstorm, 10−10m) asplotted in Fig. 2. Initially, the liquid solution of water molecules and ions are placed at random in the middle of the simulation box so as to form a aqueous slab (blue box) with dimensions
of
25𝐴̇ × 25𝐴̇ × 25𝐴̇ The liquid region is sandwiched by vapor regions and each vapor regions has dimensionsof
40𝐴̇ × 25𝐴̇ × 25𝐴̇Fig. 2Schematic of simulation box for the liquid-vapor interface at equilibrium.
2.2 Method of MD Simulation
For any classical molecular dynamics simulation, the force field potential must be determined first. Since the system includes water molecules, Li+, and Br-, the long-range Coulombic force between ions must be added to the Lennard-Jones potential, which can be expressed below with no external potential is applied,
𝑈𝑖𝑗= 𝑞𝑖𝑞𝑗
𝑟𝑖𝑗 + 4𝜀𝑖𝑗[(
𝜎𝑖𝑗
𝑟𝑖𝑗)
12
− (𝜎𝑖𝑗
𝑟𝑖𝑗)
6
] (1)
Where the subscripts i and j denote ith and jth particles (atoms or ions), q is the charge of particle, r is the distance between particles, 𝜎𝑖𝑗 and
𝜀𝑖𝑗 are the minimum energy and the zero energy separation distances.
Lorentz rule was proposed by H.A. Lorentz: 𝜎𝑖𝑗= 0.5(𝜎𝑗𝑗+ 𝜎𝑖𝑖). The
Berthelot rule is given by 𝜀𝑖𝑗= √𝜀𝑖𝑖𝜀𝑗𝑗 as follows :
2
i j
ij
(2)
ij i j
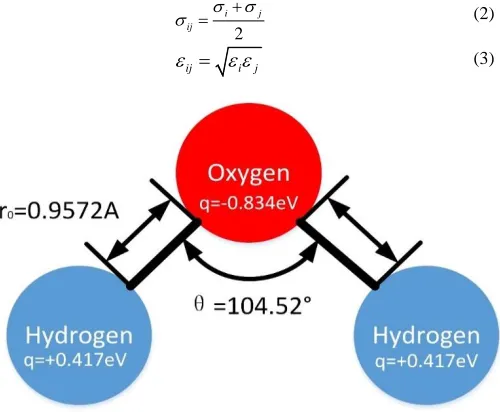
(3)Fig. 3Schematic of SPC/E water model.
Specifically, it is important to note that for Li+ - Li+ interaction, we adopted 𝜀𝐿𝑖= 0.1649𝑘𝐶𝑎𝑙/𝑚𝑜𝑙 and 𝜎𝐿𝑖= 1.5050𝐴̇ suggested by
Bouzziz and Nasr (2007). For the Br- - Br-interaction, Sun et al. (2012) suggested that 𝜀𝐵𝑟= 0.0899𝑘𝐶𝑎𝑙/𝑚𝑜𝑙 and 𝜎𝐵𝑟= 4.6238𝐴̇. The
above values for the parameters are considered the most accepted and recent in the literature. The valves of the potential parameters q, σ and ε are listed in Table 1.
Table 1 MD Simulation Parameters. Physical
properties
O--O- H+-H+ Br--Br- Li+-Li+
M (g/mol) 15.9994 1.008 79.9040 6.9400 q (ev) -0.8476 +0.4238 -1.000 +1.000
(kCal/mol)
0.1533 0.0 0.0899 0.1649
σ(𝐴̇) 3.166 0.0 4.6238 1.5050
The periodic boundary condition (PBC) is applied to all six boundary surfaces. The NVT ensemble was employed for the system absolute temperature that is maintained at different temperature levels by the Nose-Hoover thermostat developed by Nose (1984) and Hoover (1985). The truncated distance for short-range and long-range forces are taken as
12.5𝐴̇ and 45𝐴̇ respectively and the Ewald summation is employed for the Coulomb interaction calculation. The equations of motion are integrated using the Velocity-Verlet algorithm. The SHAKE method is applied for water molecules to maintain their bond lengths and angles. The number of molecules in each calculation set is summarized in Table 2.
The molecular dynamics simulation of water (Set I) and LiBr aqueous solution with three different concentrations (sets II, II and IV) were carried out. In the case of pure water (set I), the simulations were performed at three different temperatures, 293K, 373K and 473K. Simulations of the LiBr aqueous solutions (sets II, II and IV) were performed only at 473K.
For each system, the simulation was carried out with a time step of 1 fs and a total simulation time of 6 ns, comprised of 1 ns for equilibration and 5 ns for data analysis. The surface tension and distributions of ions were obtained by analyzing the trajectories recorded at every 500 fs.
Table 2 Number of Molecules Used in Each Calculation Set.
Set H20 Li+ Br- Temperature (K)
I 400 0 0 293,373,473
II 400 16 16 473
III 400 40 40 473
IV 400 80 80 473
Further, MD simulation is used to simulate the absorption of water vapor into LiBr aqueous solutions. Fig. 4 provides a sketch of the simulation geometry.
Two boxes of the same dimensions 25𝐴̇ × 25𝐴̇ × 100𝐴̇ are combined together at the beginning of the simulation to form the simulation system. The pervious equilibrium simulation result will be used as initial condition for this set of simulation.
Fig. 4Schematic of combined simulation box for water vapor absorption into an aqueous electrolyte solution.
Initially, each box is under liquid-vapor equilibrium condition at different saturation vapor pressure. No external potential is applied and the pressure difference is the dominating driving force for the water vapor absorption into LiBr aqueous solution. The truncated distance for short-range and long-range forces are taken as 25𝐴̇ and 40𝐴̇
respectively. The equations of motion are integrated using the Velocity-Verlet algorithm. Similarly, the Ewald summation is also employed to calculate long range Coulomb interaction and SHAKE technique is utilized to hold the bond and angle between hydrogen and oxygen atoms in the water molecules.
The simulation conditions are all summarized in following Table 3. In the set of I-1,2,3, 4 and 5, MD of absorption of water vapor at 473K into LiBr aqueous solution with various concentrations and temperatures were carried out. The corresponding concentrations of LiBr aqueous solution are 0%, 49%, 59% and 71%, respectively. In order to get statistically sound result, four times of independent calculations are performed. In the set of II-1,2,3, and 4 and set of III-1,2,3, and 4, MD on water vapor molecules absorption into water at 383K and 71% LiBr aqueous solution at 473K were calculated.
Table 3 Simulation Conditions.
CASE
Evaporation side (A) Absorption side (B) Number of
molecules Temperature [K]
Number of molecules
Temperature[K]
H2O H2O Li+ Br-
I-1 400 473 600 0 0 383
I-2 400 473 400 60 60 400
I-3 400 473 400 80 80 415
I-4 400 473 400 120 120 437
I-5 400 473 400 200 200 473
II-1 400 423 600 0 0 383
II-2 400 448 600 0 0 383
II-3 400 473 600 0 0 383
II-4 400 498 600 0 0 383
III-1 400 423 400 200 200 473
III-2 400 448 400 200 200 473
III-3 400 473 400 200 200 473
III-4 400 498 400 200 200 473
3. RESULTS AND DISCUSSION
3.1 Effect of LiBr Concentration on the Rate of Vapor Condensation
Table 4 lists the MD simulation results that are specifically designed to evaluate the effects of various mass concentration levels of LiBr in the aqueous solution on the absorption of vapor molecules. For the initial pure water temperatures (evaporation side, Box A), they are all set at 473K for the five cases. For the absorption on pure water condition (Case I-1), its initial temperature is 383K for Box B. For the purpose of maintaining an equal condensation driving pressure difference for various LiBr concentrations, the initial temperatures of the LiBr solutions (condensing side, Box B) were assigned at 400K, 415K, 437K, and 473K for LiBr mass concentrations of 33% (Case I-2), 49% (Case I-3), 59% (Case I-4) and 71% (Case I-5), respectively. As the presence of LiBr lowers the vapor pressure, the solution temperature must be raised appropriately to maintain the same vapor pressure as that of the pure liquid water case.
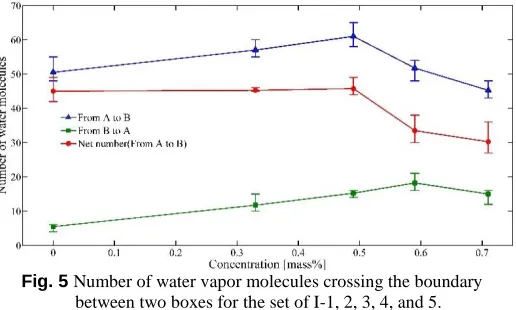
Fig. 5Number of water vapor molecules crossing the boundary between two boxes for the set of I-1, 2, 3, 4, and 5.
The MD simulation results are summarized in Table 4 and also plotted in Fig. 5 where TA,i and TB,i, are initial box A temperature and
initial Box B temperature, respectively. 𝑁𝐴→𝐵, 𝑁𝐵→𝐴, and 𝑁𝑛𝑒𝑡are
total number of water molecules going from A to B, B to A and net from A to B during the first 60 ps, respectively. It is reminded that the non-integer numbers for the molecules transported are due to averaging over four independent simulations for a single case as mentioned previously. We need to mention that the uncertainties of the MD simulations associated with the numerical results presented in this paper are around ±15 to ±20% as the simulation was only based on a total of maximum 1400 molecules. In a similar MD simulation by Daiguji and Hihara (1999), the authors also estimated the errors are around ±15 to ±20%. Then, 𝜎 is defined as the condensation coefficient as follows:
𝜎𝐶=𝑁𝑁𝑛𝑒𝑡
𝐴→𝐵 (4)
To assess the effect of LiBr concentration based on the calculated condensation coefficients listed in Table 4, we found that the condensation coefficient is reduced by 10.9 %, 15.8%, 27.4% and 26.9% for LiBr mass concentration of 33%, 49%, 59% and 71%, respectively. It appears that the effect of LiBr concentration became saturated after 59%.
Table 4 MD Simulation Results on the LiBr Concentration Effects. Case LiBr Mass
Concentration %
𝑇𝐴,𝑖 [K]
𝑇𝐵,𝑖 [K]
𝑁𝐴→𝐵 𝑁𝐵→𝐴 𝑁𝑛𝑒𝑡 𝜎𝐶
I-1 0% 473 383 50.5 5.5 45 0.891
I-2 33% 473 400 57 11.75 45.25 0.794
I-3 49% 473 415 61 15.25 45.75 0.750
I-4 59% 473 437 51.75 18.25 33.5 0.647
I-5 71% 473 473 46.25 16.15 30.10 0.651
3.2 Effect of Vapor Superheating on the Vapor Condensation
Next, we discuss the effect of superheating or temperature elevation of the water vapor over its saturation temperature on the condensation efficiency. To illustrate this effect, we chose a constant LiBr concentration of 71% and a constant condensing surface temperature of 473K while the vapor temperature is allowed to vary from 423K to 498K. As can be seen from Table 5, the vapor temperature has a relatively strong effect on the condensation coefficient. The condensation coefficient appears to saturate over 70% after the vapor temperature goes over 448K which corresponds to an increases about 11% when the vapor temperature is raised from 423K to 498K.
Table 5 MD Simulation Results on the Vapor Temperature Effects.
Case LiBr Mass Concentration %
𝑇𝐴,𝑖 [K]
𝑇𝐵,𝑖 [K]
𝑁𝐴→𝐵 𝑁𝐵→𝐴 𝑁𝑛𝑒𝑡 𝜎𝐶
II-1 71% 423 473 8 3 5 0.63
II-2 71% 448 473 21 5 16 0.76
II-3 71% 473 473 46 16 30 0.65
II-4 71% 498 473 75 19 56 0.75
The effect of vapor temperature is further analyzed by comparing with the vapor condensation on pure water results reported by Daiguji and Hihara (1999) with equal driving vapor pressure difference. Comparing between Tables 5 and 6 the only difference between Cases II and III, is the 71% LiBr concentration (Table 5) versus pure water (Table 6). The TB,i temperature has to be lowed to 383K that is necessary to
maintain the same vapor pressure difference for each subcase as explained before. Based on Table 6, it can be seen that the condensation coefficient starts out relatively high at 77% for a vapor temperature of 423K and then it apparently saturates around 90% as water vapor reaches 448K. The Case of TA,i at 498K actually has a lower value of 𝜎𝐶 which
Table 6 MD Simulation Results on the Vapor Temperature Effects for Condensation on Pure Water from Daiguji and Hihara (1999).
Case LiBr Mass Concentration %
𝑇𝐴,𝑖
[K]
𝑇𝐵,𝑖
[K]
𝑁𝐴→𝐵 𝑁𝐵→𝐴 𝑁𝑛𝑒𝑡 𝜎𝐶
III-1 0% 423 383 13 3 10 0.77
III-2 0% 448 383 29 3 26 0.90
III-3 0% 473 383 48 6 42 0.88
III-4 0% 498 383 109 15 94 0.86
Table 7.Comparison between Case II and Case III.
Case Subcase 1, 𝜎𝐶 Subcase 2, 𝜎𝐶 Subcase 3, 𝜎𝐶 Subcase 4, 𝜎𝐶
II 0.63 0.76 0.65 0.75
III 0.77 0.90 0.88 0.86
II/III %
82% 84% 74% 87%
3.3 The Effect of LiBr on the Average Condensation Coefficient
As presented in the previous section, the temperature of the vapor phase holds a significant effect on the vapor condensation effectiveness. From a theoretical point of view, Tsuruta and Nagayama (2004) and others (Tsuruta et al., 1995; Tsuruta et al., 1999) have proposed and later verified that the condensation phenomenon is affected by the energy levels of the vapor phase. Specifically this effect is mainly dominated by the normal component of the translational kinetic energy of the molecule that is perpendicular to the condensing surface, EZ, that is striking the
interface. Furthermore, Tsuruta and Nagayama (2004) proposed the equation below to correlate the condensation coefficient with EZ at the
vapor-liquid interface temperature, Ts
𝜎𝐶= 𝛼(1 − 𝛽𝑒 − 𝐸𝑧
𝐾𝐵𝑇𝑠) (5)
𝐸𝑍= 1 2𝑚𝑉𝑧
2 (6)
Where α and β are a set of constants for a given Ts. KB is the Boltzmann
constant and m and VZ are the mass of the vapor molecule and its normal
component velocity, respectively.
Once the functional dependence of the condensation coefficient on the EZ is determined, we can evaluate the average condensation
coefficient if the energy distribution form is known. Tsuruta and Nagayama (2004) suggested the Maxwellian distribution as it is generally valid for most gases. The ensemble average condensation coefficient, 𝜎̅̅̅ 𝐶is then calculated based on the following equation using
the Maxwellian energy distribution :
1/ 2 1/ 2 0
1
( ) exp( ) (1 / 2)
( / 2 ) 2
z
C C z z
B s B s B s
E m
V dV
K T m K T K T
(7)It is noted the normal component of the translational energy is assumed to be one third of the total energy due to the vapor temperature,
𝐸𝑍=12𝐾𝐵𝑇𝑣 (8)
where Tv is the vapor absolute temperature.
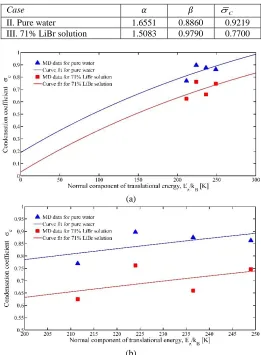
Based on the above, we have used the results of Case II and Case III given in Tables 5 and 6, respectively, to find the average condensation coefficients for pure water and 71% LiBr solution. Using the data from Tables 5 and 6 to perform curve fitting for Equation (5). The curve fitting results are shown in Fig. 6. that determine the constants, α and β. The
constants, α and β, together with the average condensation coefficient are given in Table 8 for pure water and 71% LiBr solution.
Based on Table 8, first we note that the average condensation coefficient for water condensing on pure water at 383K is 0.745 that is in good agreement with those given in the open literature (Tsuruta and Nagayama, 2004; Bonacci et al., 1976). The average condensation coefficient is reduced by 43.76% at 0.77 for the 71% LiBr aqueous solution.
Table 8 Average condensation coefficient
Case 𝛼 𝛽 C
II. Pure water 1.6551 0.8860 0.9219
III. 71% LiBr solution 1.5083 0.9790 0.7700
(a)
(b)
Fig. 6Condensation coefficient vs. EZ/KB for pure water and 71% LiBr
solution, (a) expanded domain and (b) focused domain.
4. COMPARISON OF NANOSCALE VERSUS MACROSCALE VAPOR ABSORPTION 4.1 Absorption Mass Fluxes in Macro Systems
(a) Vertical Type (b) Horizontal Type
Fig. 7Vertical and horizontal tube absorbers
In Tables 9 and 10, the vapor absorption mass fluxes (mass flow rate per unit area) together with the most important parameters are listed to give the readers necessary information to compare the results. Table 9 summarizes the vapor mass absorption fluxes for the vertical falling film type, such as vertical wall and tube absorbers. The range of absorption rates is from 0.00125 to 0.00322 kg/m2/s. The mass fluxes of vertical
tubes tend to be twice as large as those of the vertical plate. This is not surprising as the length scale of a tube type is usually smaller than that of a plate type even though both are in the category of macroscale.
Table 9 Mass absorption rates in vertical wall and tube absorbers Referenc
e
Absorption rate [kg/m2/s]
Inlet Concentra tion Solution Rate [Kg/m/s] Lengt h [m] Diamete r [m] exp. or num Miller & Keyhani (2001)
0.00322 62% 0.02 kg/s 1.524 0.01905 exp.
Tsai & Blanco (1998)
0.003 62% - 1.5 0.01905 exp.
Matsuda et al. (1994)
0.0027 55% 0.1 - vertical plate
exp.
Bo et al. (2010)
0.00125 60% 0.014 1.0 vertical plate
num . Patnaik et
al. (1993)
0.0017 60% 0.02 2.4 vertical plate
num .
Table 10 Mass absorption rates in horizontal tubular absorbers Reference Absorption
rate [kg/m2/s]
Inlet Concentration [%] Solution Rate [kg/m/s] Diameter [m] Exp or num Choudhury et al. (1993)
0.0026 60.0 0.01 0.021 num
Jeong & Garimella (2002)
0.0023 60.1 0.058 0.016 num
Sultana et al. (2007)
0.0022 60.4 0.044 0.022 exp
Islam et al. (2003)
0.0026 60.4 0.044 0.022 num
Islam (2008) 0.0022 60.4 0.05 0.019 exp
Yoon et al. (2008)
0.0025 61.0 0.030 0.01588 exp
Table 10 shows mass absorption fluxes for horizontal tube-type absorbers and this type is the most common geometry used in absorption chillers. It can be seen that there is a better agreement of absorption fluxes in this table (0.0022-0.0026 kg/m2/s). It is noted that even with relatively
large variations in the geometry and system conditions, among the vapor absorption fluxes, there is generally a good agreement. In summary, the average absorption flux for common horizontal tube absorbers is around
0.0024 Kg/m2/s, while this value for vertical tube absorbers is around
0.003 Kg/m2/s. Also we can conclude that for the macroscale vapor
absorption flux, its order of magnitude is ~ O(10-3) kg/m2s.
4.2 Comparison between Nanoscale and Macroscale Absorption Fluxes
In this section, we will evaluate the nanoscale vapor condensation mass fluxes at the vapor-liquid interface and compare with those of the macroscale. The results presented in Table 4 on the net total number of vapor molecules going from Box A to Box B in 60 ps are converted to mass fluxes as we know the cross sectional area between the two boxes is 2.5 nm x 2.5 nm. The converted interfacial condensation mass fluxes are provided in Table 11.
Table 11 Nanoscale condensation mass fluxes Case LiBr Mass
Concentration % 𝑇𝐴,𝑖 [K] 𝑇𝐵,𝑖 [K] 𝑁𝐴→𝐵 𝑁𝐵→𝐴 𝑁𝑛𝑒𝑡 𝑚̇ [kg/m2s] I-3 49% 473 415 61 15.25 45.75 3,651
I-4 59% 473 437 51.75 18.25 33.5 2,673
I-5 71% 473 473 46.2 16.15 30.05 2,398
I-1 0% 473 383 50.5 5.5 45 3,591
We can see that the mass fluxes are in the range of 2,398 to 3,651 kg/m2s or these fluxes are on the order of ~ O(103) kg/m2s. Compared
with the macroscale absorption mass fluxes of ~ O(10-3) kg/m2s, the
nanoscale mass fluxes are six orders of magnitude larger. First we need to point out that the nanoscale fluxes at the level of 103 kg/m2s have been
reported by several previous publications. For example, Tsuruta and Nagayama (2004) calculated the mass fluxes on the order of 2,000 kg/m2s
for water vapor condensation on pure liquid water surface in a nanoscale system. For a nanoscale evaporating argon liquid film, Maroo and Chung (2010) predicted the mass fluxes around 1,000 kg/m2s. The physical
explanation is that in these nanoscale phase change processes, the scale is around 10 nm (10-8 m). While the macroscale systems mentioned in
Section 4.1, the transport scale is on the order of 10-2 m, that basically
verifies the six orders of magnitude difference in the transport rates as in theory the heat and mass transport is inversely proportional to the length scale.
5. CONCLUSION
In this paper, we focus on the physical understanding and the evaluation of the condensation efficiency for the nanoscale absorption of water vapor at the vapor-liquid interface through a condensation process. A detailed analysis based on molecular dynamics simulation results has been performed to evaluate the effects of LiBr concentration in the aqueous solution on the water vapor condensation rate and to compare the nanoscale condensation rates with those of macroscale.
To assess the effect of LiBr concentration based on the calculated condensation coefficients, we found that the condensation rate is reduced by 10.9 %, 15.8%, 27.4% and 26.9% for LiBr mass concentration of 33%, 49%, 59% and 71%, respectively.
Under a constant LiBr concentration of 71% and a constant condensing surface temperature of 473K, the condensation coefficient appears to saturate over 70% after the vapor temperature goes over 448K which corresponds to an increase of about 11% when the vapor temperature is raised from 423K to 498K.
ratio of respective condensation coefficients is relatively constant ~ 85% irrelevant to vapor temperature variation.
A model is also developed to predict the average condensation coefficient for the complete vapor energy spectrum. For condensation on the 71% LiBr aqueous solution, the average condensation coefficient is reduced by 43.76% at 77% as compared to that for the condensation on pure liquid water.
For the nanoscale condensation mass fluxes, they are on the order of O(103) kg/m2s while those of the macroscale are of the order O(10-3)
kg/m2s, that is six orders of magnitude smaller and that also indicates the
strong effect of the length scale.
ACKNOWLEDGEMENTS
The research was support by the Andrew H. Hines, Jr./Progress Energy Endowment Fund.
NOMENCLATURE
U Field potential (V)
q particle charge (C)
r distance (𝐴̇)
M molar mass (kg/kmol)
T temperature (K)
N Number of molecules
E translational kinetic energy of the molecule (J)
𝑚̇ mass flux (kg/m2s)
Greek Symbols
σ the distance at which the intermolecular potential between the two particles is zero (𝐴̇)
ε Well depth (V)
Subscripts
C LiBr concertation
Net Net amount of molecules moving from Box A to Box B
A Box A
B Box B
s Vapor-liquid interface
v Vapor
REFERENCES
Ali, A.H.H, 2010, “Design of a Compact Absorber with a Hydrophobic Membrane Contactor at the Liquid Vapor Interface for Lithium Bromide-Water Absorption Chillers,” Applied Energy, 87, 1112-1121.
https://doi.org/10.1016/j.apenergy.2009.05.018
ASHRAE Handbook—HVAC Applications, 2010,
Bo, S., Ma, X., Lan, Z., Chen, J. and Chen, H., 2010, “Numerical Simulation on the Falling Film Absorption Process in a Counter-flow Absorber,” Chemical Engineering Journal, 156, 607-612.
https://doi.org/10.1016/j.cej.2009.04.066
Bonacci, J.C., Myers, A.L., Noongbri, G. G., and Eagleton, L.C., 1976, “Evaporation and Condensation Coefficient of Water, Ice and Carbon-tetrachloride,” Chem. Eng. Sci., 31, 609-617.
https://doi.org/10.1016/0009-2509(76)87001-7
Bouazizi, S. and Nasr, S., 2007, “Local Order in Aqueous Lithium Chloride Solutions as Studied by X-ray Scattering and Molecular Dynamics Simulations,” J. Mol. Struct.837, 206–213.
https://doi.org/10.1016/j.molstruc.2006.10.017
Chatterjee, S., Debenedetti, P.G., Stillinger, F.H. and Lynden-Bell R.M., 2008, "A Computational Investigation of Thermodynamics, Structure, Dynamics and Solvation Behavior in Modified Water Models", Journal of Chemical Physics,128, 124511.
https://doi.org/10.1063/1.2841127
Choudhury, S.K., Hisajima, D. and Oouchi, T., 1993, “Absorption of Vapors into Liquid Films Flowing over Cooled Horizontal Tubes,”
ASHRAE Trans., 99, 81-89.
Daiguji, H. and Hihar, E., 1999, “Molecular Dynamics Study of Water Vapor Absorption into an Aqueous Electrolyte Solution,” Microscale Thermophysical Engineering, 3, 151-165.
https://doi.org/10.1080/108939599199819
Hansen, J.P. and McDonald, I.R., 1976, Theory of Simple Liquids, Academic, London.
Islam, M.R., 2008, “Absorption Process of a Falling Film on a Tubular Absorber: An Experimental and Numerical Study,” Applied Thermal Engineering,28, 1386-1394.
https://doi.org/10.1016/j.applthermaleng.2007.10.004
Islam, M.R., Wijeysundera, N.E. and Ho, J.C., 2003, “Performance Study of a Falling-film Absorber with a Film-inverting Configuration,”
Int. J. Refrigeration,26, 909-917.
https://doi.org/10.1016/S0140-7007(03)00078-1
Jeong, S. and Garimella, S., 2002, “Falling-film and Droplet Mode Heat and Mass Transfer in a Horizontal Tube LiBr/water Absorber, Int. J. Heat Mass Transfer, 45, 1445-1458.
https://doi.org/10.1016/S0017-9310(01)00262-9
Lawson, K.W. and Lloyd, D.R., 1997, “Membrane Distillation,” Journal of Membrane Science, 124, 1-25.
https://doi.org/10.1016/S0376-7388(96)00236-0
Sun, L. Li, X., Hede, T., Tu, Y., Leck, L. and Ågren, H., 2012, “Molecular Dynamics Simulations of the Surface Tension and Structure of Salt Solutions and Clusters,” J. Phys. Chem. B, 116, 3198–3204.
https://doi.org/10.1021/jp209178s
Ludwig W., Dziak J., Królikowski L., Kapłon J. and Tuta J., 2008, “Modeling of Hydrodynamics of Thin-layer Evaporator with Gravitational Liquid Flow using CFD Methods,” Chemical andProcess Engineering, 29, 215-220.
Maroo, S.C. and Chung, J.N., 2010, “Heat Transfer Characteristics and Pressure Variation in a Nanoscale Evaporating Meniscus,” Int. J. Heat and Mass Transfer, 53, 3335-3345.
https://doi.org/10.1016/j.ijheatmasstransfer.2010.02.030
Martınez L, Rodrıguez-Maroto J.M., 2007, “On Transport and the Flow Resistances in Direct Contact Membrane Distillation,” Journal of Membrane Science, 295, 28–39.
Matsuda, A., Choi, K. H., Hada, K. and Kawamura, T., 1994, “Effect of Pressure and Concentration on Performance of a Vertical Falling-film Type of Absorber and Generator using Lithium Bromide Aqueous Solutions,” Int. J. Refrigeration, 17, 538-542.
https://doi.org/10.1016/0140-7007(94)90030-2
Miller, W.A. and Keyhani, M., 2001, “The Correlation of Simultaneous Heat and Mass Transfer Experimental Data for Aqueous Lithium Bromide Vertical Falling Film Absorption,” J. Solar Energy Eng.,123, 30-42.
https://doi.org/10.1115/1.1349550
Moghaddam, S. and Ohadi, M., 2005, “Effect of Electrode Geometry on Performance of an Electrohydrodynamic (EHD) Thin Film Evaporator,"
Journal of Microelectromechanical Systems (JMEMS), 14, 978-986.
https://doi.org/10.1109/JMEMS.2005.851812
Patnaik, V., Perez-Blanco, H. and Ryan, W.A., 1993, “A Simple Analytical Model for the Design of Vertical Tube Absorbers,” ASRAE Transactions,99, 69-80.
Nosé, S., 1984, “A Molecular Dynamics Method for Simulations in the
Canonical Ensemble,” Molecular Physics, 52, 255-268.
https://doi.org/10.1080/00268978400101201
Hoover, G. W., 1985, “Canonical Dynamics: Equilibrium Phase-Space Distribution and Equlibrium Evaluation and Study,” Phys. Rev. A, 31 1695-1697.
https://doi.org/10.1103/PhysRevA.31.1695
Plimpton, S., 1995, “Fast Parallel Algorithms for Short-Range Molecular Dynamics,” J Comp Phys, 117, 1-19.
https://doi.org/10.1006/jcph.1995.1039
Sultana, P., Wijeysundera, N.E., Ho, J.C. and Yap, C., 2007, “Modeling of Horizontal Tube-bundle Absorbers of Absorption Cooling Systems,”
Int. J. Refrigeration, 30, 709-723.
https://doi.org/10.1016/j.ijrefrig.2006.09.010
Tsai, B.B. and Perez-Blanco, H., 1998, “Limits of Mass Transfer Enhancement in Lithium Bromide-Water Absorbers by Active Techniques,” Int. J. Heat Mass Transfer, 41, 2409-2416.
https://doi.org/10.1016/S0017-9310(97)00287-1
Tsuruta, T. and Nagayama, G., 2004, “Molecular Dynamics Studies on the Condensation Coefficient of Water,” J. Phys. Chem. B, 108, 1736-1743.
https://doi.org/10.1021/jp035885q
Tsuruta, T., Sakamoto, N. and Masuoka, T., 1995, “Condensation Process at Liquid-Vapor Interface and Condensation Coefficient,”
Therm. Sci. Eng.,3, 85-90.
https://doi.org/10.1021/jp035885q
Tsuruta, T., Tanaka, H. and Masuoka, T., 1999,
“Condensation/Evaporation Coefficient and Velocity Distributions at Liquid-Vapor Interface,” Int. J. Heat Mass Transfer,42, 4107-4116.
https://doi.org/10.1016/S0017-9310(99)00081-2
Yoon, J.I., Phan, T.T., Moon, C.G., Lee, H.S. and Jeong, S.K., “Heat and Mass Transfer Characteristics of a Horizontal Tube Falling Film Absorber with Small Diameter Tubes,” Heat and Mass Transfer, 44, 437-444.