THE STUDY OF THE BUFFERING CAPACITY OF SEVERAL WATER
OBJECTS IN THE REPUBLIC OF MOLDOVA
Angela Lis
a*, Gheorghe Duca,
bElena Bunduchi
a, Viorica Gladchi
a, Nelli Goreaceva
aa
Moldova State University, 60 A. Mateevici str. MD 2010, Moldova b
Academy of Sciences of Moldova, Ştefan cel Mare 1, Moldova *E-mail: [email protected]
Abstract: The Republic of Moldova is situated among countries with relatively poor water resources, therefore their protection and rational use remains a national problem. Due to its geographic position, the Republic of Moldova is subjected to transboundary pollution. The current work represents the estimation of the buffering capacity on the Dniester River waters and its tributaries between November 2008 and October 2009. Decrease of the buffering capacity in water basins leads to disruption of the normal activity of aquatic biota, by increasing the toxicity in their living environment. On the basis of the results of measurements, suggestions for the improvement of the situation will be made and for enhancing public awareness and public authorities involvement.
Keywords: buffering capacity, acid-base balance, carbon system, humic system, stability to acidifi cation.
Introduction
The Dniester River represents an important aquatic artery for the Republic of Moldova at the same time being a source of drinking water and fi shery products and playing the role of a valuable recreation zone. Monitoring of the Dniester water quality has always been a priority for investigations in the Republic of Moldova. Decrease of the buffering capacity in water basins leads to disruption of the normal activity of aquatic biota, by increasing the toxicity in their living environment. On the basis of the results of measurements, suggestions for the improvement of the situation will be made and for enhancing public awareness and public authorities involvement.
Buffering capacity is water’s property to oppose to the change of its chemical reaction (pH) more than is typical (6,5-8,5). Buffering capacity of waters can be defi ned as the maximum quantity of acid or base, which reaches the aquatic environment and without changing the background pH value.
As criterions of water bodies withstanding to acidifi cation the following parameters can be used: pH, alkalinity, acids neutralizing capacity (ANC), the ratio of molar concentrations of anions HCO3-/SO
42- and buffering capacity of waters [1].
A more appropriate criterion to determine the stability of water bodies to acidifi cation is the buffering capacity (power), which shows how the water pH changes when strong acids are added to it [2].
In the natural waters the buffer capacity is due to the presence of two systems: carbonic and humic. Buffer capacity of the carbonic system is caused by the HCO3- and CO
2 excess, but the humic system - by the quantity of organic acids, primarily by the humic and fulvic acids and their salts [3].
To determine the buffering capacity of natural waters the following linear dependence is used [3]: [H+]/m = f([H+])
[H+] k [H+] —— = —— + —— ;
m Ct Ct
where [H+] – equilibrium concentration of hydrogen ions after adding acid; m – the content of weak acids (CO 2 and humic) ; Ct – total concentration of acids and salts, mmol-equiv/L; k – the dissociation constant of the weak acid.
Buffering capacity and pH of the aquatic environment depend on the ratio of the soluble forms of the carbonic acid concentrations and acid-base equilibrium constants.
The acid-base balance in the aquatic environment, which is determined by the carbonic system, may be disturbed only if a quantity of acids and bases in concentrations equal to that of carbonic acid arrive in water. The presence of metal ions in water, which form carbonic soluble complex, also can lead to the decrease of the buffering capacity. Besides the carbonic acid and its derivatives, the carbonic system is directly linked to hydrogen and calcium ions and indirectly with all dissolved substances. The total equilibrium may be represented by the following scheme:
pCO2atm ↑↓
pCO2aq ↔ H2CO3 ↔ HCO3- + H+ ↔ CO
Buffering capacity of water bodies towards anthropogenic acidulation depends on a number of factors bound among them. The most important of them are the natural water, aquatic biota, and bottom deposition, hydrodynamic and meteorological factors [3]. An important role in decreasing of hydrogen ion concentration during anthropogenic acidulation is played by contained in natural water substances, many of them having the property to bind hydrogen ions. For example, weak anions of the inorganic acids (carbonates, phosphates, silicates, sulphites, etc.) and organic (carbonyl) also humic and fulvic acids, and polyphenols as a result of interaction with hydrogen ions will transform them into bind form or into salts of alkaline or alkaline earth metals.
Aquatic biota, such as phytoplankton or higher vegetation, in the process of photosynthesis or other biochemical processes increase pH values, thus preventing anthropogenic acidulation [5].
It should be noted that the buffering capacity of water bodies is not a constant value, but varies widely due to individual characteristics of different water basins, and also depends on the region of the water basin and on the season.
One of the anthropogenic factors that negatively infl uence water systems is their acidulation, mainly due to the penetration of acid rain waters. The property of withstanding the acidulation of the water basins is determined by hydrological and geochemical factors [4].
Decreased pH values in the water basins not only disturb normal activity of aquatic biota, but also lead to increased toxicity of other pollutants in the basin or their solubilization from suspensions [6].
Results
This paper presents the estimation of the stability towards acidulation of the Dniester river waters and its tributaries during the period November 2008 – October 2009, monitoring the buffering capacity indicator. Measurements were taken along a 310 km river segment. Samples were selected in the following sections: Naslavcea village (200 m around the Naslavcea barrage), Cosautsi village, Boshernitsa village, the Dubasari water reservoir upstream the barrage, 100 m downstream the Dubasari barrage. To determine the impact of the tributaries on the Dniester waters, were collected samples upstream and downstream of the mouth of the following rivers: r. Raut, r. Ichel, r. Botna and r. Bic.
Estimation of the buffering capacity
Titrations were carried out with 0.025 N HCl solution, for one volume of 50 ml of natural water. To determine the equilibrium concentration of hydrogen ions in the titration process the pH value was measured [7]. The graph [H+]/m = f([H+]) was plotted, where [H+] is equilibrium concentration of hydrogen ions after adding acid; m – the content of weak acids (CO2 and humic);
m = initial aidity + b – [H+]; b = C · V/V s
where C – concentration of added acid, V - volume of added acid, b – amount of strong acid added, mmol-equiv/L, Vs.- volume of analyzed sample.
From the obtained graph, the slope is determined: tg α = 1/Ct, where: Ct = 1/tg α, and the intersection of the graph with the Oy axis gives the ratio k/Ct and thus the value of the constant k can be calculated [8].
To determine the buffering capacity of natural waters with pH within limits 6.5 to 8.5 the formula of Van Slaik for weak acids and its salts is used [9]:
Ct · 10pk- pH β = 2,3 ——————
(1 + 10pk-pH)2
Example of buffering capacity calculation for water sample taken from the Dniester river in the point of capture Naslavcea on December 9, 2008.
V · C
Acid. = ——— · 1000, mmol-equiv/L, where
Vs.
V – volume of NaOH consumed for titration, C - concentration of NaOH solution, Vs - volume of analyzed sample. 0,2 * 0,1
Acid. = ————— * 1000 = 0,4 mmol-equiv/l, 50
V ·C
Alcal. = ——— · 1000, mmol-equiv/l, where Vs.
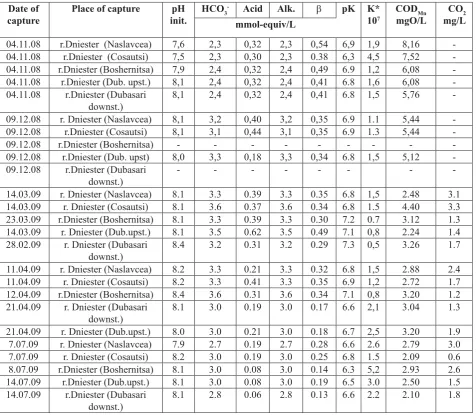
Fig. 1. Dependence [H+]/m according to [H+] for Dniester river water (Naslavcea).
3,2 ·0,05
Alcal. = ———— · 1000 = 3,2 mmol-equiv/l 50
b = C · V/Vs., where: C- concentration of HCl solution, V – volume of HCl consumed for titration, Vs.- volume of analyzed sample.
b = 0,024 · 0,25/50 · 1000 = 0,12 mmol-equiv/L
m = Acidinit. + b – [H+]; where [H+] – equilibrium concentration of hydrogen ions after adding acid; pH = -lg[H+] , [H+] = 10-pH; [H+] = 10-7,6 = 2,5 ·10-8 mol/L
m = (0,4 + 0,12) ⋅ 10-3 mol-equiv/L – 2,5·10-8 mol-equiv/L = 52,25 ⋅ 10-5 mol-equiv/L; [H+]/m = 2,5 ·10-8 mol-equiv/L / 52,25 ·10-5 mol-equiv/L = 4,8 · 10-5;
The dependence [H+]/m = f([H+]) is plotted, fi g.1.
From this dependence tg α is calculated: tg α = 1/Ct, where: Ct = 1/tg α, Ctot = 1/409,3 = 2,44 ·10-3 M or 2,44 mmol-equiv/L
the intersection of the graph with the Oy axis gives the ratio k/Ct and thus the value of the constant k can be calculated k/Ctot = 4,4724 · 10-5 , K = 4,4724 · 10-5 · 2,44 ·10-3 = 10,93 ·10-8
pk = -lgk; pk = -lg 10,93 ·10-8; pk = 8 – lg 10,93; pk = 6,96 Buffering capacity is calculated from the relationship:
Ctot · 10pk-pH β = 2,3 —————— (1 + 10pk-pH)2
2,44 ·106,96 – 8,1
β = 2,3 ——————— = 0,35 mmol-equiv/L. (1 + 106,96 – 8,1)2
Water samples were collected from surface layer (h = 0.5 m) and the following parameters were determined: pH, alkalinity, acidity, CODMn, buffering capacity, acid-base constant (tab. 1, 2).
A set of abiotic and biotic factors contribute to the formation of buffering capacity of natural waters. The group of abiotic factors comprises: the chemical composition of water (ions HCO3-, CO
32-, humic substances, carbonyl and oxicarbonyl acids, HPO42-, HSiO
3-, H3BO32-, polyphenols), bottom deposition, rainfall, food sources, nature of the rocks and the location of the basin.
Table 1. Quality indicators of r. Dniester in p.c. Cosauti, Naslavcea, Boshernitsa, upstream and downstream of Dubasari in November 2008 - July 2009
Date of capture
Place of capture pH
init.
HCO3- Acid Alk. β pK K*
107
CODMn
mgO/L
CO2
mg/L mmol-equiv/L
04.11.08 r.Dniester (Naslavcea) 7,6 2,3 0,32 2,3 0,54 6,9 1,9 8,16
-04.11.08 r.Dniester (Cosautsi) 7,5 2,3 0,30 2,3 0.38 6,3 4,5 7,52
-04.11.08 r.Dniester (Boshernitsa) 7,9 2,4 0,32 2,4 0,49 6.9 1,2 6,08
-04.11.08 r.Dniester (Dub. upst.) 8,1 2,4 0,32 2,4 0,41 6.8 1,6 6,08
-04.11.08 r.Dniester (Dubasari downst.)
8,1 2,4 0,32 2,4 0,41 6.8 1,5 5,76
-09.12.08 r. Dniester (Naslavcea) 8,1 3,2 0,40 3,2 0,35 6.9 1.1 5,44
-09.12.08 r.Dniester (Cosautsi) 8,1 3,1 0,44 3,1 0,35 6.9 1.3 5,44
-09.12.08 r.Dniester (Boshernitsa) - - -
-09.12.08 r.Dniester (Dub. upst) 8,0 3,3 0,18 3,3 0,34 6.8 1,5 5,12
-09.12.08 r.Dniester (Dubasari downst.)
- - -
-14.03.09 r. Dniester (Naslavcea) 8.1 3.3 0.39 3.3 0.35 6.8 1,5 2.48 3.1
14.03.09 r. Dniester (Cosautsi) 8.1 3.6 0.37 3.6 0.34 6.8 1.5 4.40 3.3
23.03.09 r.Dniester (Boshernitsa) 8.1 3.3 0.39 3.3 0.30 7.2 0.7 3.12 1.3
14.03.09 r. Dniester (Dub.upst.) 8.1 3.5 0.62 3.5 0.49 7.1 0,8 2.24 1.4
28.02.09 r. Dniester (Dubasari downst.)
8.4 3.2 0.31 3.2 0.29 7.3 0,5 3.26 1.7
11.04.09 r. Dniester (Naslavcea) 8.2 3.3 0.21 3.3 0.32 6.8 1,5 2.88 2.4
11.04.09 r. Dniester (Cosautsi) 8.2 3.3 0.41 3.3 0.35 6.9 1,2 2.72 1.7
12.04.09 r.Dniester (Boshernitsa) 8.4 3.6 0.31 3.6 0.34 7.1 0,8 3.20 1.2
21.04.09 r. Dniester (Dubasari downst.)
8.1 3.0 0.19 3.0 0.17 6.6 2,1 3.04 1.3
21.04.09 r. Dniester (Dub.upst.) 8.0 3.0 0.21 3.0 0.18 6.7 2,5 3.20 1.9
7.07.09 r. Dniester (Naslavcea) 7.9 2.7 0.19 2.7 0.28 6.6 2.6 2.79 3.0
7.07.09 r. Dniester (Cosautsi) 8.2 3.0 0.19 3.0 0.25 6.8 1.5 2.09 0.6
8.07.09 r.Dniester (Boshernitsa) 8.1 3.0 0.08 3.0 0.14 6.3 5,2 2.93 2.6
14.07.09 r.Dniester (Dub.upst.) 8.1 3.0 0.08 3.0 0.19 6.5 3.0 2.50 1.5
14.07.09 r.Dniester (Dubasari downst.)
8.1 2.8 0.06 2.8 0.13 6.6 2.2 2.10 1.8
The results obtained show that the collection points of the Dniester river may be placed in the following order, regarding their stability to acidulation: Cosautsi > Naslavcea > Boshernitsa > Dubasari upstream > Dubasari downstream.
In the collection point Cosautsi waters are characterized by constant values of buffering capacity between 0.34 and 0.38 mmol-equiv/L. A sharper decline of buffering capacity in this point of capture is observed in July 2009 (0.25 mmol-equiv/L). In p.c. Boshernitsa and Naslavcea, the recorded values for the buffering capacity of the Dniester waters were of 0.31 to 0.35 mmol-equiv/L, except for November 2008. The buffering capacity of water in the reservoir Dubasari both upstream and downstream, included a much wider range of values compared with other collection points, from 0.17 to 0.50 mmol-equiv/L. In July there was a sharp decrease in values of the buffering capacity at all points of capture.
Among the factors that determine the buffering capacity, the contribution of biotic factors can be neglected, because the activity of biota during the monitored period was reduced or even stopped due to low temperatures.
Among abiotic factors which infl uence values of the buffering capacity, was determined the content of HCO3 -ions and humic substances (CODMn) (tab.1).
The data presented above show that there is a poly-component buffering system in the Dniester waters. In the capture points Boshernitsa, Dubasari upstream and downstream Dubasari was registered a direct correlation between buffering capacity and alkalinity, which makes these waters unstable to acidulation. Such a direct dependency between buffering capacity and alkalinity wasn’t found in the collection points Naslavcea and Cosautsi, but however, values of the buffering capacity didn’t vary considerably. Here buffering capacity is probably infl uenced by other components, such as the nature of the rocks. In c.p. Cosauti are present limestone and dolomite rocks, which ensures the maintenance of constant values of the buffering capacity.
Results showed that there is no strict law to describe the increase of buffering capacity with increasing content of humic substance in the r. Dniester waters, as determined by the indicator CODMn (Tab.1).
Table 2.Quality indicators of r. Raut, r. Ichel, r. Botna and Bic waters in February-October 2009
Date of capture
Place of capture pH
init.
HCO3- Acid Alk. β pK K*
107
CODMn
mgO/L
CO2
mg/L mmol-equiv/L
28.02.09 r. Raut 8.3 8.6 0.94 8.6 0.56 8.6 0.02 5.12 5.3
28.02.09 r. Dniester, upstream Raut 8.4 3.2 0.31 3.2 0.22 8.4 0.03 3.26 1.7 28.02.09 r. Dniester, down. Raut 8.4 4.6 0.62 4.6 0.31 8.9 0.01 3.68 2.5
28.02.09 r. Ichel 8.3 7.6 0.52 7.6 0.39 8.3 0.05 3.76 4.6
28.02.09 r. Dniester, upstream
Ichel 8.5 3.6 0.42 3.6 0.19 8.9 0.01 3.36 1.7
28.02.09 r. Dniester, down. Ichel 8.5 3.6 0.21 3.6 0.15 8.2 0.06 3.44 1.5
14.03.09 r. Botna 8.4 8.5 0.62 8.5 0.46 8.1 0.07 6.96 4.2
14.03.09 r. Dniester, upstream
Botna 8.3 3.8 0.25 3.8 0.16 7.9 0.11 3.00 2.2
14.03.09 r.Dniester, down. Botna 8.3 3.7 0.29 3.7 0.22 8.2 0.08 2.72 2.5
14.03.09 r. Bic 8.1 7.4 1.14 7.4 0.78 7.9 0.11 6.24 7.1
21.04.09 r. Raut 8.4 7.9 0.42 7.9 0.31 8.3 0.05 5.52 2.0
21.04.09 r. Dniester, upstream
Raut 8.1 3.0 0.19 3.0 0.14 7.9 0.12 3.04 1.3
21.04.09 r. Dniester, down. Raut 8.2 3.7 0.17 3.7 0.12 8.1 0.08 2.76 1.3
21.04.09 r. Ichel 8.3 7.1 0.21 7.1 0.16 8.0 0.09 6.00 1.7
21.04.09 r. Dniester, upstream
Ichel 8.2 3.2 0.23 3.2 0.16 8.2 0.07 3.12 1.3
21.04.09 r. Dniester, down. Ichel 8.2 3.2 0.15 3.2 0.11 8.0 0.10 2.80 1.3
21.04.09 r. Botna 8.2 3.3 0.15 3.3 0.11 7.9 0.13 2.56 1.1
21.04.09 r. Dniester, upstream
Botna 8.2 3.3 0.10 3.3 0.08 7.8 0.17 1.52 1.5
21.04.09 r. Dniester, down. Botna 8.2 3.2 0.15 3.2 0.11 7.9 0.13 2.72 1.9
21.04.09 r. Bic 8.1 7.1 0.52 7.1 0.39 7.9 0.14 12.32 4.9
21.04.09 r. Dniester, upstr. Bic 8.3 3.2 0.12 3.2 0.09 8.0 0.10 2.56 1.5
19.05.09 r. Raut 8.2 8.5 0.17 8.5 0.42 6.9 0.03 3.90 1.6
19.05.09 r. Dniester, upstream
Raut 8.3 2.8 0.06 2.8 0.25 8.5 1.89 4.40 1.5
19.05.09 r. Dniester, down. Raut 8.4 3.9 0.12 3.9 0.22 6.7 0.92 4.80 1.5
19.05.09 r. Ichel 8.4 9.0 0.37 9.0 0.57 7.0 1.31 4.30 3.5
19.05.09 r. Dniester, upstream
Ichel 8.3 2.8 0.15 2.8 0.19 6.9 1.26 4.80 0.9
19.05.09 r. Dniester, down. Ichel 8.3 2.9 0.15 2.9 0.19 6.9 1.95 4.10 1.2
18.05.09 r. Botna 8.2 7.1 0.39 7.1 0.53 6.7 1.23 6.30 5.1
23.06.09 r. Raut 8.9 8.3 0 8.3 0.28 7,6 2.32 3,63 1.3
23.06.09 r. Dniester, upstream
Raut 8.6 3.0 0 3.0 0.11 6,6 2.65 2,23 1.4
23.06.09 r. Dniester, down. Raut 8.4 3.9 0.15 3.9 0.18 6,9 1.12 2,02 1.4
23.06.09 r. Ichel 8.4 9.1 0.33 9.1 0.59 7,0 0.99 6,41 6.3
23.06.09 r. Dniester, upstream
Ichel 8.3 3.1 0.17 3.1 0.23 6,9 1.24 1,71 1.5
22.06.09 r. Botna 8.8 6.3 0 6.3 0.28 7,8 0.17 9,12 0.7 22.06.09 r. Dniester, upstream
Botna 8.2 3.1 0.17 3.1 0.19 6,7 1.85 2,23 0.9
22.06.09 r. Dniester, down. Botna 8.2 3.2 0,17 3.2 0.19 6,8 1.49 1,85 1.2
22.06.09 r. Bic 7.9 7.2 0.49 7.2 0.74 6,7 1.76 9,2 7.2
22.06.09 r. Dniester, upstr. Bic 8.2 3.1 0.16 3.1 0.22 6,8 1.41 1,67 1.7 22.06.09 r. Dniester, down. Bic 8.1 3.3 0.21 3.3 0.23 6,6 2.23 2,09 2.7
14.07.09 r. Raut 8.4 8.6 0 8.6 0.37 7.1 0.77 6.5 3.0
14.07.09 r. Dniester, upstream
Raut 8.1 2.8 0.06 2.8 0.13 6.6 2.23 2.1 1.8
14.07.09 r. Dniester, down. Raut 8.3 4.1 0 4.1 0.14 6.8 1.62 4.5 1.7
14.07.09 r. Ichel 8.0 5.2 0.04 5.2 0.33 6.5 3.41 16.49 4.1
14.07.09 r. Dniester, upstream
Ichel 8.1 2.9 0.08 2.9 0.15 6.5 2.84 1.8 1.6
14.07.09 r. Dniester, down. Ichel 8.0 2.9 0.12 2.9 0.19 6.5 3.00 1.8 1.7
13.07.09 r. Botna 8.8 5.7 0 5.7 0.22 7.7 0.21 8.84 0.6
13.07.09 r. Dniester, upstream
Botna 8.1 2.9 0.1 2.9 0.19 6.7 1.92 2.09 1.8
13.07.09 r. Dniester, down. Botna 8.1 2.9 0.1 2.9 0.17 6.6 2.56 2.44 2.3
13.07.09 r. Bic 7.8 6.7 0.41 6.7 0.62 6.6 2.47 8.15 9.1
13.07.09 r. Dniester, upstr. Bic 8.2 3.0 0.31 3.0 0.29 7.0 0.92 2.16 1.4
13.07.09 r. Dniester, down. Bic 8.1 3.2 0.23 3.2 0.25 6.9 1.29 2.5 1.8
8.10.09 r. Dniester, upstream Raut 8.1 3.1 0.07 3.1 0.18 6.6 2.48 1.50 5.0
8.10.09 r. Raut 8.5 10.0 0 10.0 0.30 6.6 2.32 7.55 3.5
8.10.09 r. Dniester, down. Raut 8.3 4.6 0 4.6 0.18 6.2 5.99 2.58 4.2
8.10.09 r. Dniester, upstream Ichel 8.2 3.2 0.09 3.2 0.23 6.7 2.03 1.79 2.8
8.10.09 r. Ichel 8.4 8.4 0 8.4 0.37 6.6 2.20 7.26 4.5
8.10.09 r. Dniester, down. Ichel 8.3 3.2 0 3.2 0.19 6.6 2.29 1.57 4.2
8.10.09 r. Dniester, upstream
Botna 8.2 3.3 0 3.3 0.21 6.7 2.01 2.15 2.3
8.10.09 r. Botna 8.8 7.7 0 7.7 0.33 7.3 0.45 10.62 1.2
8.10.09 r. Dniester, down. Botna 8.3 3.1 0 3.1 0.20 6.6 2.31 2.37 1.8
8.10.09 r. Dniester, upstr. Bic 8.3 3.2 0 3.2 0.12 6.4 4.07 1.65 2.4
8.10.09 r. Bic 7.8 8.3 0.30 8.3 1.31 6.6 2.38 15.23 11.9
8.10.09 r. Dniester, down. Bic 7.9 3.9 0.15 3.9 0.30 6.5 2.80 3.59 3.4
To elucidate the tributaries impact on the Dniester waters, the same indicators were determined for the following rivers: Raut, Ichel, Botna and Bic (Tab.2).
According to data presented in Tab. 2, the waters of monitored rivers have maximum values of the buffering capacity in March (from 0.7 - up to 1.2 mmol-equiv/L), except for r. Bic for which maximum values were registered in October (1.3 mmol-equiv/L). This development was due to high HCO3- ion content (7.1-8.6 mmol-equiv/L) in mentioned period. In April was noticed a sudden fall in values of the buffering capacity of rivers (down to 0.2 and 0.5 mmol-equiv/L). Also in this month there have been low HCO3 ion concentrations (3.3 to 7.1 mmol-equiv/L). In May it was noticed a slight increase in values of the buffering capacity of the monitored rivers (r. Ichel - 0.57 mmol-equiv/L, r. Botna - 0.53 equiv/L) except for r. Raut, in which case the value slightly decreased (from 0.5 - to 0.42 equiv/L). In June values of the buffering capacity were reduced almost 2 times for r. Raut (from 0.416 - till 0.282 mmol-equiv/L) and r. Botna (from 0.533 - till 0.285 mmol-mmol-equiv/L), but there was a slight increase in these values for r. Ichel (from 0.567 - till 0.598 mmol-equiv/L) and r. Bic (from 0.595 - till 0.738 mmol-equiv/L).
The obtained results show that the monitored rivers are placed in the following order, regarding the stability to acidulation: Ichel > Bîc > Răut > Botna.
Lower values of buffering capacity were found upstream and downstream rivers Ichel, Bîc, Răut and Botna (0.17 to 0.35 mmol-equiv/L) compared with those rivers. Was confi rmed that small rivers have a positive impact on water quality of r. Dniester. Buffering capacity values downstream of the mouth are higher than the buffering capacity of the upstream values.
increasing of HCO3- ions content, and respectively, it decreases with the reduction of HCO
3- ions content. Exceptions were values from April 2009, for r. Botna, when the buffering capacity was infl uenced by other factors.
The results presented in Tab. 2 show that CODMn, just like the alkalinity, affects the buffering capacity of small rivers. It was established that increasing of CODMn values lead to the increase of the buffering capacity and vice versa, decreasing of CODMn values lead to the diminishing of the buffering capacity. Exceptions were r. Raut and Ichel in May, which demonstrates that in these rivers the buffering capacity is particularly infl uenced by the carbon system. For river Botna waters in April was registered a greater infl uence of the humic system on the buffer. The buffering capacity values did not show a direct dependence on the HCO3 ions content for this river, but was observed a direct dependence on the CCOMn values.
So, unlike large rivers, the buffer system of small rivers in the monitored period is infl uenced particularly by the carbon system, less by the humic system and very little by other components such as aquatic biota, bottom deposits, etc.
Conclusions
From the above data we conclude that the buffering capacity of aquatic objects is not a constant value but it varies in time and space. Depending on the season the buffering capacity values are characterized by small variations. There is a complex buffer system in natural waters, consisting of biotic and abiotic factors. The results obtained show that the collection points of the Dniester river may be placed in the following order, regarding the stability to acidulation: Cosautsi > Naslavcea > Boshernitsa > Dubasari upstream > Dubasari downstream. The Cosauti capture point is the most stable to acidulation, due to river basin rocks forming in this point, namely the presence of limestones and dolomites that contribute to increasing buffering capacity of waters. The results obtained show that the monitored rivers may be placed in the following order, regarding the stability to acidulation: Ichel > Bîc > Răut > Botna. It was demonstrated that monitored rivers have a positively infl uence on the Dniester river waters, because they lead to the increase of the buffering capacity downstream of the river mouth. During low photosynthetic activity of the year the waters vulnerability to anthropogenic factors increases, which may lead to lower buffering capacity of natural waters.
In order to prevent the phenomenon of waters acidifi cation and to identify sources of pollution, we recommend expanding the National Standards with the indicator of the buffering capacity. Also, we recommend authorized bodies to inform the parties responsible for the impact of emissions on the national aquatic ecosystems, and to require these parties to take measures to decrease the impact.
References
Горячева, H. B.; Дука, Г. Г. ГидрохимиямалыхрекРеспубликиМолдова - Chişinău. - 2004 - p. 91-101.
[1].
Lei, D.; Jiming, H. Critical loads of acidity for surface waters in China / The Science of the Total Environment. [2].
PR China. - 2000 – p. 1-10.
Никаноров, А. М.; Лапин, И. А. Оценкабуфернойёмкости. // ДокладыАкадемиинаук – 1990.- том 314.-
[3].
№ 6 – с. 1507-1510.
Дворак, Н. А.; Потапова, И. Ю.; Лозовик, П. А. Устойчивость озера Пряжинское к закислению. //
[4].
Материалыкарельскогогосударственогоуниверситетa. - 2007 – с. 71-73.
Chris, J. C.; Ivan, B.; Lluis, C. Acidifi cation in European mountain lake districts: A regional assessment of [5].
critical load exceedance / Aquatic Sciences. Dübendorf. - 2005 – p. 237-251.
Curtis, C. J.; Barbieri, A.; Camarero, L. Application of static critical load models for acidity to high mountain [6].
lakes in Europe / Water, Air, and Soil Pollution: Focus. - 2002 – p. 115-126. Rapp, L. Critical Loads of Acid Deposition for Surface Water-Exploring existing
[7]. models and a potential alternative
for Sweden. Doctor’s dissertation. Uppsaia, 2001 – 35 p.
Потапова, И. Ю.; Лозовик, П. А. Оценка устойчивости водных объектов Карелии к закислению по
[8].
буфернойёмкостиикислотонейтрализующейспособности. // Матер. Институтa водныхпроблемСевера
Карелии. – 2007. – с. 93-98.
Лозовик, П. А. Устойчивостьводныхобъектов кзакислениювзависимостиотудельноговодосборана
[9].
![Fig. 1. Dependence [H+]/m according to [H+] for Dniester river water (Naslavcea).](https://thumb-us.123doks.com/thumbv2/123dok_us/8796387.1769451/3.595.141.469.75.259/fig-dependence-h-according-dniester-river-water-naslavcea.webp)