Research Journal
Volume 9, No. 26, June 2015, pages 12–19
DOI: 10.12913/22998624/2359 Research Article
Received: 2015.04.10 Accepted: 2015.05.08 Published: 2015.06.01
STRENGTH OF ABS PARTS PRODUCED BY FUSED DEPOSITION
MODELLING TECHNOLOGY – A CRITICAL ORIENTATION PROBLEM
Filip Górski1, Radosław Wichniarek1, Wiesław Kuczko1, Przemysław Zawadzki1, Paweł Buń1
1 Chair of Management and Production Engineering, Poznań University of Technology, Piotrowo 3, 60-965 Poznań, Poland, e-mail: [email protected]; [email protected]; wieslaw.kuczko@ put.poznan.pl; [email protected]; [email protected]
ABSTRACT
Numerous experimental studies, including experiments performed by the authors, have shown that the part orientation during layer deposition has a very strong
in-fluence on final strength of a product manufactured by additive Fused Deposition
Technology. The paper presents the results of tensile, bending and impact strength tests performed on samples of various orientations, made out of ABS material using
FDM technology. The results of these tests allowed discovering a unique phenomenon
– with the changing orientation, not only the values of strength indexes change, but macroscopic material behavior under load as well. The transition between a “yield point” and “brittle” material usually happens in a certain range of orientation values, named a critical orientation by the authors. The paper indicates supposed ranges of critical orientation for various types of loads.
Keywords: ABS material, FDM technology, strength.
INTRODUCTION
Rapid development of the Additive Manu
-facturing Technologies (AMTs), also known as
layered manufacturing technologies (or, in
re-cent years, as 3D printing) allowed significant
decrease of time needed for implementation of a new product. Additive manufacturing process-es allow obtaining physical, three-dimensional shapes of nearly any complexity, directly from the digital representation of a product (usually
a CAD model). There is no need of using any specialized tooling, besides the equipment of the
manufacturing machine. Additive manufacturing technologies can be used for Rapid Prototyping,
Rapid Manufacturing or Rapid Tooling. They are invaluable when there is a need of quick manu -facturing of a physical prototype of a designed part [1, 2].
One of the most frequently used AMTs for the industrial purposes is the Fused Deposition Mod -elling technology, which can be used to obtain parts out of thermoplastic materials. The most
widespread build material is acrylonitrile
butadi-ene styrbutadi-ene (ABS), which ensures relatively good strength and acceptable thermal shrinkage. It also
allows further processing of the obtained elements
(by means of machining, coating or gluing). Ma
-chines for the Fused Deposition Modelling, in
comparison with other additive manufacturing technologies, have small dimensions and are easy
to maintain. They are also quiet and clean, which makes them available for use directly in design studios [1, 3]. FDM models can be recycled and there is not much waste, which makes the whole
process ecologically friendly.
A final product manufactured using the Fused Deposition Modelling technology can be charac
-terized by some coefficients, which are influenced by many factors [4]. Unlike in most manufactur -ing technologies, the values of parameters of the additive manufacturing process can be more
e.g. strength [4, 5] or accuracy [3]. Each set of the process parameters: orientation of the product in the working chamber, layer thickness and method of filling of the layer contour, will make the part structure look different, which will result in dif-ferent values of coefficients such as strength, ac-curacy or surface quality.
So far, many scientists have investigated the influence of the manufacturing process param-eters on mechanical properties of products made using FDM technology [4, 5]. Some researchers focused on optimization of a selected parameter in relation to a specific evaluation criterion, for example time of the process [6], accuracy of shape representation [7], surface quality [8] and mechanical properties [9]. The process parameter which influences values of the product properties in the most significant way is spatial orientation of the product in the working chamber during the manufacturing process [4, 5, 10, 11].
Mutual relations between the FDM process parameters and properties of the obtained prod-ucts are not fully discovered yet. Attempts at their experimental determination have been made [4, 5, 12], but obtaining full characteristics of these relations is still an open research problem.
The aim of the present work was to summa-rize a set of experimental studies performed to obtain knowledge about an influence of the key parameter of the additive manufacturing with FDM technology – orientation of the product in the working chamber during layer deposition. During numerous studies, the authors have dis-covered that the FDM parts behave in two very distinct ways under load – the part can be either “brittle” or with “yield point” – it fails either via the thread fracture or the layer disjoint [13]. The transition between the two behaviors happens in a certain range of orientations [14]. The prelimi-nary research, described in the paper, was aimed at finding out a general range of transition be-tween material behaviors – this range was named a critical orientation. The critical orientation problem was defined on the basis of the tensile, bending and impact strength tests – their results are presented in this paper.
THEORETICAL INFORMATION
Fused Deposition Modelling (Fig. 1) is a pro-cess consisting in layered, linear deposition of a heated thermoplastic material supplied in a form
of a wire by an extrusion head with nozzle of a certain external dimension (in the machine used for the described research, nozzle diameter is 0.4 mm). The head can move in two axes (X and Y). It deposes material on the model basis in a form of a contour and filling. After manufacturing one, complete layer, the model table moves in verti-cal (Z) direction to the distance equal to the se-lected layer thickness. Deposed material goes back to a solid state a moment after leaving the nozzle, bonding with the previously created geometry. For the more complex shapes, support structures are needed to prevent deformation by gravity. The ex-trusion head is usually equipped with two nozzles, one for the build material, the other one for the sup-port material (usually similar types of thermoplas-tics are used, in some machines the soluble support material, such as PVA, is used for easier removal). A produced part is ready for use immediately after the support material is removed [1, 2].
The macrostructure of parts made by FDM technology consists of material threads deposed in alternate directions, creating layers bound to-gether only adhesively. The manufactured ele-ments behave in a specific way under any given load. Even a simple load (single force or torque) applied to non-complex geometries like a rectan-gular beam will result in a complex stress state inside the element. As such, it is very hard to pre-dict whether a certain part will break under the applied load or not.
Fig. 1. FDM process scheme [2]
an angular difference between plane slicing the object into layers and a selected, base plane of the object (Fig. 2). Orientation may be therefore defined by the three rotation angles (rotation be-tween the object and the machine coordinate sys-tem), where only two angles are relevant – the third angle (around the vertical axis, perpendicu-lar to the layer slicing plane) has no influence on the manner of slicing the object into layers, so it does not affect product properties significantly.
STUDY DESCRIPTION
For the studies, samples made using FDM technology on the Dimension BST 1200 machine were used. The samples were manufactured out of ABS material supplied by the Dimension com-pany in a form of a wire wound on a spool, sealed hermetically in the cartridge, what ensures proper levels of humidity required for the process.
Three types of samples were manufactured during the course of the study (Fig. 3). Shape of the samples was compatible with guidelines of specific standards, namely:
• PN-EN ISO 527 – procedures and parameters of tensile tests of polymer materials,
• PN-EN ISO 178 – procedures and parameters of bending tests of polymer materials,
• PN-EN 10045-1 – procedures and parameters of Charpy impact tests of polymer materials.
The samples were manufactured in different orientations. Two orientations in the X axis were considered – 0° and 90°, named Flat and Side, respectively. The Y axis orientations were the main variable in the presented studies, differing in 15° for the tensile tests, 30° for the bending tests (with additional 45° orientation samples) and 45° for the impact strength tests. An ID of a given sample is composed of the name of the X orientation and the value of the Y orientation (e.g. Flat-0 means that orientation of the is 0° in both axes), except for samples manufactured in the vertical direction, that is 90° in Y axis – for these samples, the X orientation value does not affect the process of slicing into layers, so this sample was simply given the “Vert” ID. A sum-mary of the samples produced for tests is pre-sented in Table 1.
Fig. 2. Illustration of the orientation concept [3]
The samples were manufactured using the Di-mension BST 1200 machine by Stratasys compa-ny, out of ABS material, using solid (monolithic) internal filling with 45° raster, the layer thickness was 0.254 mm. Five samples were manufactured for each sample type for the bending and the im-pact strength, three samples of each type were manufactured for the tensile tests. For the tensile and bending tests, a Zwick Roell Z020 machine was used (with varying equipment). For the im-pact test, a Charpy imim-pact hammer was used. All the tests were carried out according to the afore-mentioned standards. In the bending test, the test was conducted up to deflection equal to 1.5 of sample thickness, which is 6 mm, or until the sample failure. The stress, calculated on the basis of recorded forces and deflection, is interpreted as the real bending strength σfM or the conventional
(substitute) bending strength σfC, depending on
whether the sample failed during the tests. The
other tests always finished with the sample fail-ure and the calculated results were interpreted as the tensile strength σm or the impact strength KC.
For the reference and comparison purposes, the tensile tests and impact strength tests were also performed on samples of the same shape, manu-factured out of the same ABS material, using the injection molding process.
RESULTS AND DISCUSSION
Results of all the strength tests are presented in Table 2, 3 and 4 (tensile, bending and impact strength, respectively). The two main groups of characteristics are presented: strength, interpreted as the maximal stress recorded in a sample and strain, presented as a percentage (elongation) at the maximal force. Impact strength is presented separately.
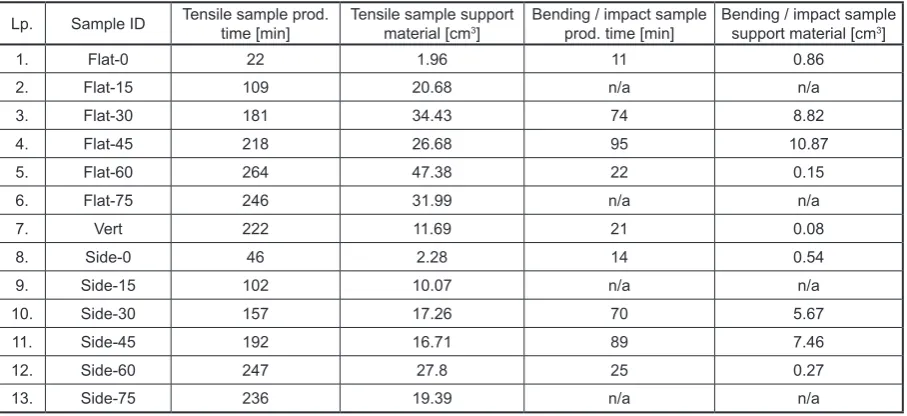
Table 1. Summary of samples for the experimental tests
Lp. Sample ID Tensile sample prod. time [min] Tensile sample support material [cm3] Bending / impact sample prod. time [min] Bending / impact sample support material [cm3]
1. Flat-0 22 1.96 11 0.86
2. Flat-15 109 20.68 n/a n/a
3. Flat-30 181 34.43 74 8.82
4. Flat-45 218 26.68 95 10.87
5. Flat-60 264 47.38 22 0.15
6. Flat-75 246 31.99 n/a n/a
7. Vert 222 11.69 21 0.08
8. Side-0 46 2.28 14 0.54
9. Side-15 102 10.07 n/a n/a
10. Side-30 157 17.26 70 5.67
11. Side-45 192 16.71 89 7.46
12. Side-60 247 27.8 25 0.27
13. Side-75 236 19.39 n/a n/a
The data is also presented in diagrams, in the Figures 5 (strength characteristics: tensile and bending strengths) and 6 (plasticity characteris-tics: elongation, impact strength).
In Figure 6, a critical range of orientations is shown. It is a range of orientation values, in which the transition between two types of material be-havior – with a yield point and brittle – occurs. Table 2. Results of the tensile strength tests
Sample ID σm [MPa] εb [%] E [GPa]
Flat-0 19.0 4.6 1.6 Flat-15 18.1 2.0 1.6 Flat-30 13.8 1.3 1.5 Flat-45 12.9 1.5 1.5 Flat-60 13.7 1.2 1.6 Flat-75 11.1 1.0 1.5 Side-0 22.9 7.0 1.7 Side-15 21.6 3.1 1.7 Side-30 17.3 1.5 1.6 Side-45 14.9 1.2 1.6 Side-60 8.7 0.8 1.5 Side-75 10.9 1.0 1.5
Vert 11.0 1.0 1.5
Ref. (inj. molding) 30.1 27.2 1.7 Where: σm – tensile strength, εb – maximal strain, E –
Young modulus.
Table 3. Results of the bending strength tests
Sample ID dL [mm] σfM. σfC [MPa] εf [%] Broken samples [%]
Flat-0 6.0 35.1 3.5 0
Flat-30 4.3 25.2 2.5 100
Flat-45 3.5 23.9 2.1 100
Flat-60 3.8 22.0 2.2 80
Side-0 6.0 41.1 3.5 0
Side-30 5.7 34.0 3.3 20
Side-45 3.8 27.0 2.2 100
Side-60 4.0 24.5 2.3 80
Vert 2.7 18.1 1.6 100
Where: dL – maximal deflection, σfM or σfC – bending strength, εf – maximal strain.
Table 4. Results of the impact strength tests
Estimator Reference (inj. mold.) Side-0 Flat-0 Side-45 Flat-45* Vert* [J] KC [kJ/m2] [J] KC [kJ/m2] [J] KC [kJ/m2] [J] KC [kJ/m2] [J] KC [kJ/m2] [J] KC [kJ/m2]
average 2.53 62.86 1.20 28.80 0.74 17.71 0.03 0.60 0 0.00 0 0.00 median 2.40 59.70 1.20 28.73 0.71 16.99 0.03 0.60 0 0.00 0 0.00 max 3.23 80.35 1.42 34.13 1.02 24.58 0.05 1.20 0 0.00 0 0.00 min 2.16 53.73 1.00 24.04 0.60 14.46 0.01 0.24 0 0.00 0 0.00 * Values lower than sensitivity of the measuring equipment.
Inside this range, a dramatic decrease can be ob-served in all ductility (plasticity) characteristics. The curves were approximated and smoothed, as there is not enough data from all types of mea-surements – the variability of orientation angle was 15° in tensile strength and even higher in other tests. The critical orientation range was se-lected by the authors in between 5° and 30° in the Y orientation. The above orientation value of 30° in Y axis, all the samples in all the tests pres-ent the brittle behavior (no yield point, failure via layer disjoint, low elongation). This behavior was also presented by certain, random samples of 15° orientation. As no samples of orientation between
0° and 15° were tested, the 5° value was selected arbitrarily as the beginning of the critical orienta-tion range – in further studies it may be verified.
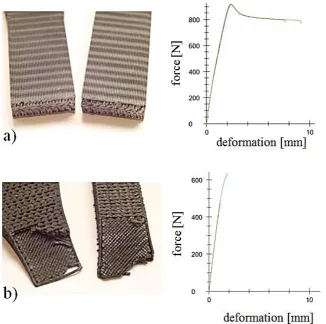
the angle between the loading force and the lay-er slicing plane, so it can be said that the highlay-er the angle, the lower the strength. If this angle is higher than zero, the applied force is carried not only by the material threads – a certain portion of the load is applied to layer bonds, which are very weak due to lack of material fusion between adjacent layers. Therefore, after a certain angle is reached, the layer bond maximal strength is reached faster than strength of the material itself. It causes disjoint of the layers, macroscopically observed as a brittle fracture. The same
mecha-nism applies to samples subjected to the bending tests. In the impact strength tests, the division is clearly visible, as the results differ drastically for various orientations – parts with the orientation of 45° and higher have no impact strength at all, the recorded values were randomly oscillating around zero, so it was assumed that they were lower than sensitivity of the measuring equipment.
When comparing the values of strength and plasticity characteristics achieved by the samples made using the FDM method and the injection molding out of the same ABS material, it is clear Fig. 5. Strength test results from the tensile and bending strength tests
that the injection molded parts are much stronger and more ductile at the same time. The differ-ence is most visible in case of the impact strength tests, or plasticity characteristics in general. The raw values of tensile strengths for the best FDM samples do not exceed 80% values of the injec-tion molded samples.
CONCLUSIONS
The samples made out of ABS using the ad-ditive FDM technology do not present satisfying mechanical properties. Moreover, the obtained properties can be much different if only one pa-rameter of the process – the part orientation – is changed. There are two main reasons for this – the first one is the weak bond between layers in the FDM parts, which causes the strength char-acteristics to decrease, even dozens of times, in comparison to the injection molded samples. The second reason is the volume error, which is al-ways present at the FDM samples – they are not monolithic. The volume error is the main rea-son why even the best parts made by the FDM
Fig. 7. Failure mechanisms in tensile samples: a) Side-0 – with a yield point, b) Flat-30 – brittle
process will never be as strong as the injection molded parts out of the same material – even if the weak interlayer bond effect is reduced to a minimum, the volume errors still make the effec-tive loaded area smaller than in case of the fully monolithic part, which increases the overall stress and decreases strength.
This difference is the most visible for the impact strength tests. FDM products have many material discontinuities inside, which can act as notches during impact tests, this is why even the best FDM sample achieved only 47% of the im-pact strength of the monolithic sample produced by injection molding.
hap-pens in a specific range of orientation values for the studied samples, this range was indicated in Figure 6. Most likely, for a certain load (ten-sion or bending), more specific value or smaller range of values can be determined, in which the aforementioned transition occurs. This value or value range is defined as a critical orientation by the authors and it will be more deeply explored in further studies.
The future studies will consist in produc-ing more ABS samples, within the preliminar-ily defined critical orientation range, to find out how much it is possible to narrow it down. The planned studies should allow for an experimen-tal answer to the question: at which orientation value the layer bond is loaded up to its maximal strength faster than the material itself. The au-thors also plan to manufacture and test samples of other materials and on different manufactur-ing systems, includmanufactur-ing the low-cost 3D printers. The results of the presented studies should be much of a help for engineers who plan to use additive manufacturing by the Fused Deposition Modelling method for parts which can be sub-jected to certain loads, as it is important to know what such a part is able to sustain and to which degree it could be comparable with parts manu-factured using other, better known and explored manufacturing technologies. In the future, a set of guidelines will be probably formulated for the additive manufacturing process engineers on how to select a proper orientation knowing the purpose and probable load of the manufactured part. So far, it can be concluded that selection of the additive manufacturing process parameters is a complex problem. A general guideline is to fo-cus on the economical effectiveness coefficients such as manufacturing time and costs, as the ori-entations which result in shorter manufacturing time usually result in smaller number of layers, which often makes for better strength. Still, this is true only for simple geometries – more studies are required to enable full control over effects of the additive manufacturing processes.
Acknowledgements
Work realized partially as a research grant in scope of statutory activities financed by Polish Ministry of Science for young scientists (deci-sion no. 8710/E-362/M/2014). Part of the studies financed by the Polish National Science Centre, agreement number: 2011/01/N/ST8/07603.
REFERENCES
1. Chua C.K., Leong K.F., Lim C.S. Rapid
prototyp-ing: Principles and applications. World Scientific Publishing, Singapore 2003, p. 420.
2. Pająk E., Górski F., Wichniarek R., Dudziak A.: Techniki przyrostowe i wirtualna rzeczywistość w procesach przygotowania produkcji. Promocja 21, Poznań 2011.
3. Górski F., Wichniarek R., Kuczko W.: Influence of process parameters on dimensional accuracy of parts manufactured using Fused Deposition Model-ing technology. Advances in Science & Technology Research Journal, 7(19), 2013, 27–35.
4. Bellini A., Guceri S., Mechanical characterization of parts fabricated using Fused Deposition Model-ing. Rapid Prototyping Journal, 9, 2003, 252–264. 5. Ahn S.H. et al.: Anisotropic tensile failure model of
rapid prototyping parts – Fused Deposition Model-ing (FDM). International Journal of Modern Physics B, 17(8-9), 2003.
6. Han W.B, Jafari M.A, Seyed K. Process speeding up via deposition planning in fused deposition-based layered manufacturing processes. Rapid Prototyp-ing Journal, 9, 2007, 212–218.
7. Masood S.H, Rattanawong W, Iovenitti P. Part build orientation based on volumetric error in fused depo-sition modeling. International Journal of Advanced Manufacturing Technology 16, 2000, 162–168. 8. Perez L.C.J. Analysis of surface roughness and
di-mensional accuracy capability of fused deposition modelling processes. International Journal of Pro-duction Research, 40, 2002, 2865–2881.
9. Rodrigues J.F, Thomas J.P, Renaud J.E. Mechani-cal behavior of acrylonitrile butadiene styrene fused deposition materials modeling. Rapid Prototyping Journal, 9, 2003, 219–230.
10. Ghorpade A, Karunakaran K.P, Wiwari M.K. Selec-tion of optimal part orientaSelec-tion in fused deposiSelec-tion modeling using swarm intelligence. Journal of En-geenering Manufacture 221, 2007, 1209–1219. 11. Thrimurthulu K, Pandey P.M, Venkata R.N.
Opti-mum part deposition orientation in fused deposition modeling. International Journal of Machine Tools &Manufacture, 44, 2004, 585–594.
12. Bagsik A., Schöppner V., Mechanical properties of Fused Deposition Modeling parts manufactured with ULTEM*9085. Proceedings of ANTEC 2011, Boston 2011.
13. Górski F., Kuczko W., Wichniarek R., Impact strength of ABS parts manufactured using Fused Deposition Modeling technology. Archives of Mechanical Tech-nology and Automation, 31(1), 2014, 3–12.
![Fig. 1. FDM process scheme [2]](https://thumb-us.123doks.com/thumbv2/123dok_us/8809433.1776417/2.595.306.527.491.655/fig-fdm-process-scheme.webp)
![Fig. 2. Illustration of the orientation concept [3]](https://thumb-us.123doks.com/thumbv2/123dok_us/8809433.1776417/3.595.148.452.419.650/fig-illustration-of-the-orientation-concept.webp)