A
LICJAK
ĘDZIA1, J
OWITAW
OŹNIAK1, K
RZYSZTOFD
UDEK2Analysis of Lower−Extremity
Long−Bone Growth During the Fetal Period
Analiza wzrostu długości kości długich kończyny dolnej
w okresie prenatalnym
1Department of Normal Anatomy, Wroclaw Medical University, Poland
2Institute of Machines Design and Operation, Technical University of Wrocław, Poland
Adv Clin Exp Med 2009, 18, 2, 121–127 ISSN 1230−025X
ORIGINAL PAPERS
© Copyright by Wroclaw Medical University
Abstract
Objectives. The goal of this survey was a morphometric analysis of the lower−extremity long bones (femur, tibia, and fibula) in human fetuses.
Material and Methods. The analysis comprised 300 lower−extremity anatomical specimens from 150 embryos at morphological ages of 12–30 weeks and within the crown−rump length range of 54–250 mm. There were 69 (46%) female fetuses. The study employed anthropological and preparative methods, image acquisition with a digital camera, a Scion Image for Windows computer measurement system, and statistical methods.
Results. Weekly increases in bone length, size symmetry, and sexual dimorphism were assessed. The results were compared with ultrasound and radiological results available in literature. Neither asymmetry nor sexual dimor− phism were detected during the survey. However, differential growth rate was found in the lower−leg bones com−
pared with the femur and these bones showed a nonlinear growth ratio. At the beginning of fetal life (12thweek),
the lower−leg bones constituted about 63% of the femoral length, but in the 30thweek this increased to 72%.
Conclusions. The lower−extremity long−bone lengths were found to be helpful parameters in assessing fetal size
and age (Adv Clin Exp Med 2009, 18, 2, 121–127).
Key words:fetus, development, lower limb.
Streszczenie
Cel pracy. Analiza morfometrii kości długich kończyny dolnej (udowej, piszczelowej i strzałkowej) człowieka w okresie prenatalnym.
Materiał i metody. Analizie poddano 300 preparatów kończyn dolnych, 150 płodów w wieku morfologicznym
między 12. a 30. tygodniem, w przedziale długości v−tub: 54–250 mm. Płodów żeńskich było 69 (46%). W pracy
posługiwano się metodami: antropologiczną, preparacyjną, akwizycją obrazu za pomocą aparatu cyfrowego, kom− puterowym systemem pomiarów Scion Image for Windows oraz metodami statystycznymi. Wykorzystano testy Shapiro−Wilka, Smirnowa−Kołmogorowa, Manna−Whitneya oraz Wilcoxona.
Wyniki.Oceniono przyrosty tygodniowe długości kości, symetrię wymiarów po lewej i prawej stronie oraz dymor− fizm płciowy. Wyniki pomiarów własnych na materiale sekcyjnym porównano z wynikami pomiarów techniką USG i radiologicznych w dostępnej literaturze. Na podstawie przeprowadzonych badań nie stwierdzono asymetrii i dymor− fizmu płciowego. Zaobserwowano natomiast zróżnicowane tempo wzrostu kości podudzia w stosunku do kości udo− wej, o czym świadczy nieliniowy wzrost proporcji między tymi kościami. W początkowym okresie życia płodowego (12. tydzień) kości podudzia stanowią 63% długości kości udowej, w 30. tygodniu wartość ta zwiększa się do 72%.
Wnioski. Długości kości długich kończyny dolnej uznano za parametry pomocne w ocenie wzrostu i wieku płodu (Adv Clin Exp Med 2009, 18, 2, 121–127).
Słowa kluczowe:płód, rozwój, kończyna dolna.
Ultrasound examination is a basic obstetric diagnostic technique allowing the assessment of fetal age and development. This technique inclu−
cerebellar size. The literature provides information on new fetometric parameters which enable fetal growth evaluation. The fetal development rate largely depends on maternal, fetal, and placental factors and its growth is the uterus−placenta exchange [22]. The present authors’ previous observations applied a mathematical model of the upper−extremity long bones in fetal age evaluation [18]. The available literature contains anthropo− metric surveys of fetal material describing extrem− ity growth. Partyka [27] examined 68 fetuses aged 16–31 weeks in which he measured femoral dia− physis. The femur’s absolute dimensions showed a strong positive correlation with both crown− rump length (CRL) and fetal age. However, nei− ther sexual dimorphism nor asymmetry were detected. Felts [8] showed that femoral diaphysis length in fetal material increases by 0.21 mm with 1 mm of CRL growth in fetuses in which this value exceeded 31 mm and diaphysis length surpassed 8.4 mm. Gray and Gardner [11] observed a femoral diaphysis increase by 0.285 mm with a CRL rise by 1 mm. Kelemen et al. [19] observed lower−extremity long−bone lengths in 193 fetuses aged 7–22 weeks, including 128 femurs and 117 tibias. The correlation between these parame− ters and CRL was linear. They proposed mathe− matical formulas which could define fetal age based on the bones’ longitudinal dimensions. Bareggi et al. [2] measured lower−extremity long− bone lengths using overexposed alizarine−stained specimens. The same team [3] calculated the rela− tionship between femoral, tibial, and fibular lengths and CRL (38–116 mm) in 58 fetuses aged 8–14 weeks using a logarithmic model. Matsushita et al. [21] analyzed the extremity long bones mea− suring 21 anthropometric parameters in 122 Ja− panese fetuses aged 18–40 weeks. Increases in lower−limb bone length showed positive allometry and that of the upper limb negative allometry. In the examined material, the allometric length coef− ficients and CRL were close to 1.0 (i.e. isometric). In other studies of fetal material, lower−limb long− bone lengths and their correlation with the body’s other dimensions (head circumference, bi− parietal dimensions, and abdominal circumfer− ence) were assessed from measurements from a scanning electron microscope [6], radiographic measurements [1, 10, 28, 30], and ultrasound examinations [4, 13, 20, 29]. Similar studies car− ried out on material from 142 adult corpses were described by Pan [26] in 1924. Filly et al. [9] eval− uated femur ossification between the 28thand 35th week of fetal life in 116 fetuses.
The goal of the present study was an analysis of femoral, tibial, and fibular growth in the prena− tal period and a comparison of the results with
ultrasound examinations as well as a mathematical model designed to assess fetal age on the basis of the lengths of these bones.
Material and Methods
Statistical analysis was applied to the results for the right (FLR) and left femur (FLL) femur and the right (PLR) and left (PLL) lower−leg (shank) bones (tibia and fibula) in 150 fetuses aged 13–29
weeks of fetal life (mean ± SD: 21.1 ± 4.0 weeks
old). Fetal CRL ranged from 54 to 250 mm. The analyzed group included 69 female fetuses (46%). Fetal morphologic age was defined on the basis of the interdependence described by Scammon and Calkins [5]. The study methods included prepara− tion and anthropological methods, image acquisi− tion with a digital camera, and statistical analysis (Statistica Program package and the Shapiro−Wilk, Smirnov−Kolmogorov, Mann−Whitney, and Wilcox tests). Measurements of the prepared long bones were performed with the Scion Image computer system for Windows v. Alpha 4.0.3.2. Measure− ment photographs were taken using the Gimp 2.2 and Bimp 1.43 programs. The results were statisti− cally analyzed. The analysis considered sexual dimorphism assessment, symmetry evaluation, and observations of the growth rate and changes in the ratio of the shank and femoral lengths (PL/FL).
Results
Table 1 presents the basic statistics of the quantitative features characteristic for the exam− ined group of fetuses. The table also includes these features in subgroups divided according to sex. Fig. 1 shows the analyzed parameters of the fetuses. As the distribution of the somatic features dif− fered significantly from a normal distribution assessed by the Shapiro−Wilk and Smirnov−Kol− mogorov tests, the significance of differences in their mean values was verified with the Mann− −Whitney nonparametric test. Because the female fetuses were significantly younger, their age was considered in the difference analysis of the female and male long−bone sizes. The fetuses were divid− ed into four age groups (Table 2) which were homogeneous with respect of rump−crown length (CRL) and mass (m), which was verified by the
Mann−Whitney nonparametric test at an α = 0.05
significance level.
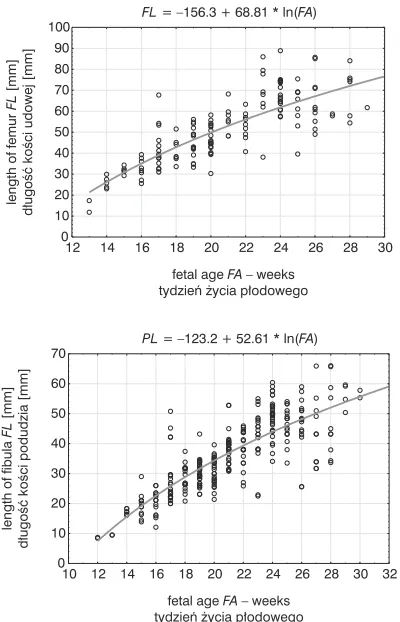
Whitney test and demonstrated in Fig. 2. There was also no statistically significant difference observed between long−bone lengths on the left (L) and right (R) side. The Wilcoxon test for depen− dant trials confirmed these bones’ symmetry (Fig. 3). As neither sexual dimorphism nor asym− metry were found, the growth analysis of the long bones was based on all the results of the length measurements (both on the left and right sides of male and female fetuses). Diagrams (Fig. 4) of the correlation of lower−limb long−bone length with fetal age indicate that their increase is nonlinear. A fit of a mathematical model to the empirical data was attained using logarithmic models. In the ana− lyzed period of fetal life, the increase in the femur was faster than that of the shank bones, which results in a nonlinear change in the PL/FL ratio (Fig. 5).
Comparison of the femoral growth curve elicited on the basis of indirect selective material
Table 1.Basic statistics of features characteristic of the analyzed group of fetuses and the statistical significance of differ−
ences in the means in the subgroups according to sex
Tabela 1.Podstawowe statystyki cech charakteryzujących analizowaną grupę płodów i wyniki testu istotności różnic
wartości przeciętnych w podgrupach różniących się płcią
Parameters Sex Total Test results
(Cechy) (Płeć) (Łącznie) (Wyniki testu)
Female (F) Male (M)
Number N 69 81 150
(Liczebność N)
Fetal age – days Z= 2.174
(Wiek płodu – dni) p= 0.030
mean (średnia) x 148 139 143
standard deviation (odchylenie standardowe) SD 23 30 27
median (mediana) Me 148 137 139
minimum (wartość minimalna) xmin 95 85 85
maximum (wartość maksymalna) xmax 195 199 199
Body length v−pl– mm Z= 2.645
(Długość ciała v−pl– mm) p= 0.008
mean (średnia) x 240 212 225
standard deviation (odchylenie standardowe) SD 53 72 65
median (mediana) Me 239 200 220
minimum (wartość minimalna) xmin 98 67 67
maximum (wartość maksymalna) xmax 345 362 362
Body length CRL – mm Z= 2.519
(Długość ciała v−tub– mm) p= 0.012
mean (średnia) x 169 151 159
standard deviation (odchylenie standardowe) SD 37 48 44
medianMe(mediana Me) 170 152 155
minimum (wartość minimalna) xmin 75 54 54
maximum (wartość maksymalna) xmax 250 240 250
Body massm– g Z= 2.112
(Masa ciała m– g) p= 0.035
meanx (średnia x) 344 286 313
standard deviation (odchylenie standardowe) SD 205 239 226
medianMe(mediana Me) 306 220 240
minimum (wartość minimalna) xmin 14 10 10
maximum (wartość maksymalna) xmax 918 910 918
Fig. 1.Fetus, parameters: CRL – crown−rump length, FL – length of femur, PL – length of fibula; 1 – femur, 2 – fibula, 3 – tibia
Table 2. Medians of features characteristic for the analyzed fetal group in age groups and statistical significance of differ− ences in the average values in the subgroups according to sex
Tabela 2.Mediany cech charakteryzujących analizowaną grupę płodów w rozbiciu na grupy wiekowe oraz wyniki testu
istotności różnic wartości przeciętnych w podgrupach różniących się płcią
Fetal age – month N Sex V−tub – mm Mass – g
(Wiek płodu – miesiąc) (Płeć) (CRL – mm) (Masa – g)
IV 3 F 91 p= 0.491 50 p= 0.560
17 M 95 50
20 Σ 92 50
V 26 F 144 p= 0.092 178 p= 0.605
30 M 133 154
56 Σ 136 168
VI 29 F 186 p= 0.099 435 p= 0.218
16 M 178 383
45 Σ 184 410
VII 11 F 219 p= 0.170 680 p= 0.343
18 M 210 624
29 Σ 217 647
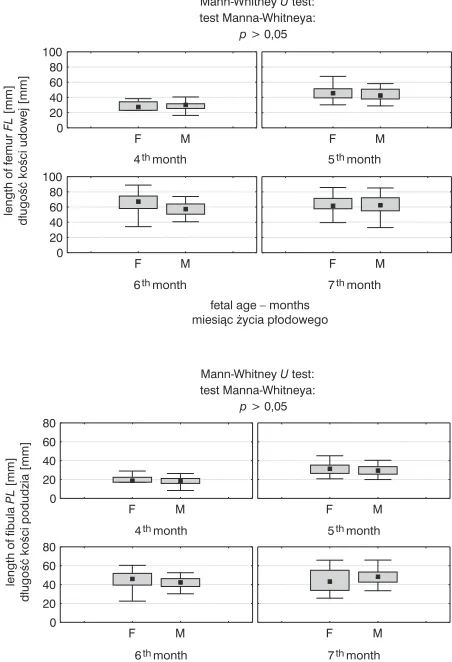
Fig. 2.Comparison of shank and femoral bones in male and female fetuses in four age subgroups and Mann−Whitney test results
Ryc. 2.Porównanie długości kości udowej i podudzia płodów żeńskich i męskich w czterech grupach wiekowych i wynik testu Manna−Whitneya
Mann-WhitneyUtest: test Manna-Whitneya:
p> 0,05
fetal age – months miesi¹c ¿ycia p³odowego
F M
0 20 40 60 80 100
F M
F M
0 20 40 60 80 100
F M
7thmonth 6thmonth
5thmonth 4thmonth
length of femur
[mm]
d³ugoœæ koœci udowej [mm]
FL
Fig. 3.Comparison of lower−limbs long bones on the left (L) and right (R) side in 150 fetuses and Wilcoxon test results
Ryc. 3.Porównanie długości kości długich kończyn dolnych po stronie lewej (L) i prawej (R) 150 płodów oraz wyniki testu Wilcoxona
Wilcoxon signed-rank test: test kolejnoœci par Wilcoxona:
Z= 0,867; p= 0,386
0 10 20 30 40 50 60 70 80 90 100
L R
length of femur
[mm]
d³ugoœæ koœci udowej [mm]
FL
F M
0 20 40 60 80
F M
F M
0 20 40 60 80
F M
7thmonth 6thmonth
5thmonth 4thmonth
length of fibula
[mm]
d³ugoœæ koœci podudzia [mm]
PL
Mann-WhitneyUtest: test Manna-Whitneya:
p> 0,05
Z= 0,567; p= 0,570
0 10 20 30 40 50 60 70 80 90 100
median 25%-75% min-max Wilcoxon signed-rank test: test kolejnoœci par Wilcoxona:
length of fibula
[mm]
d³ugoœæ koœci podudzia [mm]
PL
measurement (own studies) and curves based on radiological examinations [28] and ultrasound tests [13, 15, 16] revealed a significant difference in absolute value, but similar character. The lengths measured directly are larger than those determined by the ultrasound technique by 15 mm on average. They are also larger than radiological results by about 20 mm (Fig. 6). Regardless of the measurement technique, the femoral growth rate was found to be faster in the initial weeks of the 2nd trimester (ca. 5 mm/week) and it seemed slower in the first weeks of the 3rdtrimester (2 mm/ /week).
Due to the observed strong correlation of long−
−bone length and fetal age (R= 0.976 for femoral
length and R= 0.936 for the shank bones), it is pos− sible to assess the fetuses’ morphological age (FA) reliably on the basis of the regression formulas:
FA = 9.722 × e(0.0145 × FL) and
FA = 10.4 × e(0.019 × PL),
where FA(weeks) is the fetus’ morphological age,
FL (mm) the femoral length, and PL (mm) the shank bone length.
Discussion
Jeanty et al. [15–17] presented detailed geo− metric measurements of the lower−limbs long− bones using the ultrasound method in 450 fetuses. The proposed formulas allow assessing the lengths of the femur, tibia, and fibula and can also be applied in fetal limb malformations. In their two part survey, O’Brien et al. [24, 25] carried out ser− ial measurements of fetal limb long bones with the ultrasound method in 41 patients. The increase in
FL= –156.3 + 68.81 * ln(FA)
12 14 16 18 20 22 24 26 28 30 0
10 20 30 40 50 60 70 80 90 100
length of femur
[mm]
d³ugoœæ koœci udowej [mm]
FL
fetal age – weeks tydzieñ ¿ycia p³odowego
FA
Fig. 4.Correlations of lower−limb long−bone lengths and age and the mathematical growth models
Ryc. 4.Diagramy korelacyjne długości kości długich kończyn dolnych z wiekiem oraz modele matematy− czne wzrostu
PL= –123.2 + 52.61 * ln(FA)
10 12 14 16 18 20 22 24 26 28 30 32 0
10 20 30 40 50 60 70
length of fibula
[mm]
d³ugoœæ koœci podudzia [mm]
FL
fetal age – weeks tydzieñ ¿ycia p³odowego
FA
Fig. 5.Correlation of the lower−limb long−bone length ratio and age and the mathematical growth model
Ryc. 5.Diagram korelacyjny proporcji długości kości długich kończyn dolnych z wiekiem oraz model matematyczny wzrostu
PL/FL= 0.4 + 0.1 * ln(FA)
10 12 14 16 18 20 22 24 26 28 30 32 0.4
0.5 0.6 0.7 0.8 0.9 1.0
fibula/femur
/
podudzie/udo
PL
FL
()
fetal age – weeks tydzieñ ¿ycia p³odowego
FA
Fig. 6.Comparison of mathematical models describ− ing femoral length increase which were developed on the basis of ultrasound examinations [13, 15, 16], radi− ological tests [28], and direct surveys of selective material
Ryc. 6.Porównanie modeli matematycznych wzrostu długości kości udowej uzyskanych na podstawie badań USG: Hadlock [13], Jeanty [15, 16], radiolog− icznych: Scheuer [28] i pomiarów bezpośrednich na materiale sekcyjnym: Kędzia et al.
0 10 20 30 40 50 60 70 80 90 100
10 14 18 22 26 30 34 38 42 Jeanty
Hadlock Scheuer Kêdzia
length of femur
[mm]
d³ugoœæ koœci udowej [mm]
FL
fetal age – weeks tydzieñ ¿ycia p³odowego
the bones was linear between the 12thand 22ndweek. The results strongly correlated with morphological age and can be used in skeletal dysplasia assess− ment. Hadlock et al. [13] examined 338 fetuses aged 12–40 weeks of fetal life. The standard devi− ation in age expected on the basis of the femoral length was ± 9.5 days for fetuses aged 12–23 weeks and ± 22 days for fetuses aged 23–40 weeks. Other material of Hadlock et al. [12] com− prised 361 fetuses aged 14–42 weeks. The ultra− sound method was applied to measure femoral length as well as head and abdomen circumfer− ence. The increasing curve character was similar, but the values of the present material were much higher.
De Biasio et al. [7] reported femoral length reference values taken in fetuses aged 10–14
weeks (CRL: 31–78 mm) using ultrasound. Strong
correlation between CRL and particular bone lengths was observed: for the femur R= 0.77,p <
0.001, and for the tibia R = 0.69,p < 0.001. Merz et al. [23] examined 515 femurs and 385 tibias and fibulas in fetuses aged 12–40 weeks. They described the bones’ growth with a hyperbolic tan− gent. A similar function was applied in studies of the upper−limb bone longitude in the present authors’ own material [18]. Issel [14] compared bone lengths measured by two methods (ultra− sound and sectional) in the same 40 stillborn fetus− es aged 17–41 weeks. The difference in the mea− surements amounted to ± 2 mm. Femoral growth rate proved to be much faster than that of the other examined long bones. The author claimed that the mathematical correlation between fetal age and bone length is best described by a polynomial as the decrease in the growth indexes varies from 4 mm/week in the second trimester to 1 mm/week in the third trimester.
The material of the present study revealed nei− ther asymmetry (Fig. 3) nor sexual dimorphism
(Fig. 2) and the male and female fetal bone length measurements were identical (p > 0.05). In the
period from the 12th to 30th week of fetal life,
femoral length increased on average from 10 to 73 mm. In the initial period of fetal life (12th–13th week), the increase amounted to 5.8 mm and in the final period (29th–30th week) it was 0.9 mm. This corresponds to a decrease in relative growth from 49% to 1%. The average rate of femoral length increase was 6.9% in the analyzed period. The shank bones’ (fibula and tibia) average length increased from 7 to 53 mm in this period. In the initial period, the shank bone length increase amounted to 4.1 mm and in the final one 1.1 mm. The average shank bone length increase was 8.1% in the analyzed period. The differential growth rates of the compared bones can also be demon− strated by the nonlinear increase in their ratios (Fig. 5). In the initial stage of fetal life (12thweek) the shank bones constituted 63% of the femoral length and this value increased to 72% in the 30th week.
In the present authors’ own material, femoral lengths (Fig. 6), assessed with a direct technique, significantly diverged from the results presented by Jeanty [15, 16] and Hadlock et al. [12, 13], who used ultrasound, and Scheurer et al [28], using radiological results. The difference may be caused by systematic measurement errors common in both methods or by the inaccuracy of indirect mea− surements such as ultrasound examination.
The authors concluded that the longitude dimensions of the lower−limb long bones are important parameters helpful in fetal CRL and age assessment, which are of clinical importance in evaluating fetal development. The suggested regression formulas allow fetal morphological age assessment and can be successfully applied in forensic medicine or archaeology.
References
[1] Bagnall KM, Jones PRM:Estimating the age of the human foetus from crown−rump measurements. Ann Hum Biol 1975, 2, 387–390.
[2] Bareggi R, Grill V, Zweyer M, Sandrucci MA, Narducci P, Forabosco A: The growth of long bones in human embryological and fetal upper limbs and its relationship to other developmental patterns. Anat Embyol 1994, 189, 19–24.
[3] Bareggi R, Grill V, Zweyer M, Sandrucci MA, Narducci P, Forabosco A:On the assessment of the growth pat− terns in human fetal limbs: longitudinal measurements and allometric analysis. Early Hum Dev 1996, 45, 11–25.
[4] Benson CB, Doubilet PM:Sonographic prediction of gestational age: accuracy of second− and third−trimester fetal measurements. AJR Am J Roentgenol 1991, 157, 1275–1277.
[5] Carlson BM:Human embryology and developmental Biology. Mosby, St Louis 1999, 450.
[6] Chiarisini D, Barbet J, Copin H, Maillet M, Pompidou A:Scanning electron microscopy of femoral ossifica− tion in the human fetus. Bull Assoc Anat (Nancy) 1992, 233, 13–21.
[7] De Biasio P, Prefumo F, Lantieri PB, Venturini PL: Reference values for fetal limb biometry at 10–14 weeks of gestation. Ultrasound Obstet Gynecol 2002, 19, 588–591.
[9] Filly RA, Golbus MS, Carey JC, Hall JG:Short−limbed dwarfism: Ultrasonographic diagnosis by mensuration of fetal femoral length. Radiology 1981, 138, 653–656.
[10] Garn SM:Contributions of the radiographic image to our knowledge of human growth. AJR Am J Roentgenol 1981, 137, 231.
[11] Gray DJ, Gardner E: The prenatal development of the human femur. Am J Anat 1970, 129, 121–140.
[12] Hadlock FP, Deter RL, Harrist RB, Park SK:Estimating fetal age: computer−assisted analysis of multiple fetal growth parameters. Radiology 1984, 152, 497–501.
[13] Hadlock FP, Harrist RB, Deter RL, Park SK: Fetal femur length as a predictor of menstrual age: sonographi− cally measured. AJR Am. J. Roentgenol 1982, 138, 875–878.
[14] Issel EP:Ultrasonic measurement of the growth of fetal limb bones in normal pregnancy. J Perina Med 1985, 13(6), 305–313.
[15] Jeanty P, Dramaix−Wilmet M, van Kerkem J, Petroons P, Schwers J: Ultrasonic evaluation of fetal limb growth: part II. Radiology 1982, 143, 751–754.
[16] Jeanty P, Kirkpatrick C, Dramaix−Wilmet D, Struyven J: Ultrasonic evaluation of fetal limb growth. Radiology 1981, 140, 165–168.
[17] Jeanty P:Fetal limb biometry. Radiology 1983, 147, 601–602.
[18] Kędzia A, Woźniak J, Dudek K, Ziajkiewicz M:Mathematical model of the growth of long bones of upper extremities during fetal period, The Computer Aided Scientific Research KOWBAN XV. Wrocław Scientic Society, Wrocław 2008, 209–216.
[19] Kelemen E, Janossa M, Calvo W, Fliender MT:Developmental age estimated by bone−length measurement in human fetuses. Anat Record 1984, 209, 547–552.
[20] Mahony BS, Callen PW, Filly RA:The distal femoral epiphyseal ossification center in the assessment of third− trimester menstrual age: sonographic identification and measurement. Radiology 1985, 155, 1, 201–204.
[21] Matsushita K, Shinoda K, Watanabe H, Akiyoshi T: Multivariate analysis of limb long bone growth during the human prenatal period. Tohoku J Exp Med 1995, 176, 109–120.
[22] Mazur A:Characteristics of terminal wisps of placentas in foetal hypotrophy, doctor thesis. Wrocław 2008, 9–19.
[23] Merz E, Pehl S, Goldhofer W, Hoffmann G: Biometry of the large bones of fetal extremities in the 3d trimester. Ultraschall Med 1984, 5, 136–43.
[24] O’Brien G, Qeeenan JT, Campbell S:Ultrasound measurement of fetal limb bones. Am J Obst Gyn 1980, 138, 297–302.
[25] O’Brien G, Qeeenan JT:Growth of the ultrasound fetal femur length during normal pregnancy. Part I. Radiology 1981, 141, 833–837.
[26] Pan N: Length of long bones and their proportion to body height in Hindus. J Anat 1924, 58, 4, 374–378.
[27] Partyka C:Rozwój kości udowej u płodów ludzkich w świetle badań antropometrycznych, densytometrycznych i histometrycznych, doctor thesis. Szczecin 2003, 88–89.
[28] Scheuer JL, Musgrave JH, Evans SP:The estimation of late fetal and perinatal age from limb bone length by linear and logarithmic regression. Ann Hum Biol 1980, 7, 257–265.
[29] Seeds JR, Cefalo RC: Relationship of the fetal limb lengths to both biparietal diameter and gestational age. Obstet. Gynecol 1982, 60, 680–685.
[30] Vasconcellon H, Prates J, Moraes L, Rodrigues HC:Growth of the human metatarsal bones in the fetal period (13–24 weeks post conception): A quantitative study. Surg Radiol Anat 1992, 14, 315–318.
Address for correspondence:
Alicja Kędzia
Department of Normal Anatomy Wroclaw Medical University Chałubińskiego 6a
50−368 Wrocław Poland
Tel.: +48 71 784 00 80
E−mail: [email protected]
Conflict of interest: None declared