http: // www.ijrtsm.com© International Journal of Recent Technology Science & Management 6
IJRTSM
INTERNATIONAL JOURNAL OF RECENT TECHNOLOGY SCIENCE & MANAGEMENT
“COMPARATIVE STUDY OF ASSEMBLY LINE BALANCING USING PLANT SIMULATION
SOFTWARE WITH RANKED POSITION WEIGHT METHOD”
Madhvi Sharma
1,P K Sharma
21Research Scholars, NIIST Bhopal ,(M.P.), India
2
Professor, Head of Mechanical Department, NIIST Bhopal
ABSTRACT
In this research work, the main object to reduce the number of stations or to find out optimum number of stations this is also called as TYPE-1 problem. A simulation software PLANT SIMULATION also used for visualize the whole procedure what changes takes place when different methods apply on that data. The simulation software used for find out optimum solution or checking purpose because all these methods gives the results in mathematical manner and this software result in practical manner. This software shows satisfactory result when run on given data by given the optimum solution to the present assembly line work station for the product there by reducing the human resources, work place require for existing set up.
KEYWORDS : Assembly line balancing, methods, Ranked Positional Weight Method, Plant simulation software.
I. INTRODUCTION
One of the topics which has attracted a lot attention from industrial and research centers from the beginning of the industrial production is, production or assembly lines balancing problem of the products. Failure to achieve a balanced production system means that you have not reached the full capacity the system. Due to the high cost of production systems, balancing these systems is the most important preoccupation of researchers and industrial engineers in research and industrial centre’s. In this manner, one of the main reasons for non-use of the industrial centres capacities in Iran is that the production and assembly lines of the products are not balanced, So the main objective of this paper is to introduce scientific and appropriate methods for assembly line balancing in Electronic Industry. One of the fundamental characteristics of an assembly line balancing is the movement of a task from one station to another. The main problem in the assembly line is that a required task in a station must be assigned with considering constraints of production system and the task priorities, which is called an assembly line balancing problem. If there is a single model applied to the assembly line balancing, and required tasks and its tasks processing times are known and constant, it is called simple assembly line balancing problem (SALBP) (Baybars, 1986). In order to balance this type of assembly line, the following information is required:
Production rate.
http: // www.ijrtsm.com© International Journal of Recent Technology Science & Management 7
Constraints of production system and products.
II. LITERATURE REVIEW
Boysen et al.(2008) [1] in their work on assembly line balancing tried to make understand that which model to use when. This work structures the vast field of assembly line balancing according to characteristic practical settings and highlights relevant model extensions which were required to reflect real world problems and open research challenges were identified. An ant colony optimization algorithm for balancing two-sided assembly lines was presented by Simaria and Vilarinho (2009) [2]. Two-sided assembly lines are a special type of assembly lines in which workers perform assembly tasks in both sides of the line. The highlighted approach of this work is to address the two-sided mixed-model assembly line balancing problem. First, a mathematical programming model ,then, an ant colony optimization algorithm. Fan et al. (2010) [3] published their work unbalancing and simulating of assembly line with overlapped and stopped operation on the subject modeling and simulation of assembly line with overlapped and stopped operation, builds mathematical model for the assembly line both under certainty and uncertainty environment. Blum and Miralles (2011) [4] works on solving the assembly line worker assignment and balancing problem via beam search. In this work they deal with a specific assembly line balancing problem that was known as the assembly line worker assignment and balancing problem (ALWABP). This problem arises in setting where tasks must be assigned to workers, and workers to work stations. In this work an algorithm based on beam search was introduced for solving the ALWABP with the objective of minimizing the cycle time when given a fixed number of work stations ,respectively, workers. Cheshmehgaz 2012) [5] worked on accumulated risk of body postures in assembly line balancing problem and modeling through a multi-criteria fuzzy-genetic algorithm. A novel model of assembly line balancing problem was presented that incorporates assembly worker postures into the balancing. Also anew criterion of posture diversity was defined and contributes to enhance the model. The proposed model suggests configurations of assembly lines via the balancing and the assigned workers gets the opportunities of changing their body postures, regularly. A work on two-sided assembly lines balancing with assignment restrictions was presented by Purnomoet al. (2013) [6]. Two-two-sided assembly line is a set of sequential workstations where task operations can be performed in two sides of the line. In this work amathematical model was proposed for two-sided assembly line type II. The aim of the model was minimizing the cycle time for a given number of mated work stations and balancing the workstation simultaneously.
III. PROBLEMS IN ASSEMBLY LINE BALANCING
Classification of assembly line balancing problems
http: // www.ijrtsm.com© International Journal of Recent Technology Science & Management 8
SALBP
: The simple assembly line balancing problem is relevant for straight single product assembly lines where
only precedence constraints between tasks are considered (for a survey see Scholl and Becker, 2006)
3.1.1 Type 1(SALB-1)
of this problem consists of assigning tasks to work stations such that the number of
stations
(m)
is minimized for a given production rate (fixed cycle time,
c
).
3.1.2
Type 2 (SALBP-2)
is to minimize cycle time (maximize the production rate) for a given number of stations
(m).
3.1.3 Type E (SALBP-E) is the most general problem version maximizing the line efficiency (E) thereby simultaneously minimizing c and m considering their interrelationship.
3.1.4 Type F (SALBP-F) is a feasibility problem which is to establish whether or not a feasible line balance exists for a given combination of m and c.
3.1 GALBP : In the literature, all problem types which generalize or remove some assumptions of SALBP are called generalized assembly line balancing problems (GALBP). This class of problems (including UALBP and MALBP) is very large and contains all problem extensions that might be relevant in practice including equipment selection, processing alternatives, assignment restrictions etc. (for a survey see Becker and Scholl, 2006).
3.2.1MALBP and MSP : Mixed model assembly lines produce several models of a basic product in an intermixed sequence. Besides the mixed model assembly line balancing problem (MALBP), which has to assign tasks to stations considering the different task times for the different models and find a number of stations and a cycle time as well as a line balance such that a capacity- or even cost-oriented objective is optimized (cf. Scholl, 1999, chapter 3.2.2). However, the problem is more difficult than in the single-model case, because the station times of the different models have to be smoothed for each station (horizontal balancing; cf. Merengo et al., 1999). The better this horizontal balancing works, the better solutions are possible in the connected short-term mixed model sequencing problem (MSP). MSP has to find a sequence of all model units to be produced such that inefficiencies (work overload, line stoppage, off-line repair etc.) are minimized. (e.g. Bard et al., 1992 and Scholl et al., 1998)
3.2.2 UALBP : The U-line balancing problem (UALBP) considers the case of U-shaped (single product) assembly lines, where stations are arranged within a narrow U. As a consequence, worker are allowed to work on either side of the U, i.e. on early and late tasks in the production process simultaneously. Therefore, modified precedence constraints have to be observed. By analogy with SALBP, different problem types can be distinguished. (cf. Miltenburg and Wijngaard, 1994; Urban , 1998; Scholl and Klein,1999; Erel et al., 2001)
IV. METHODOLOGY
In this case data is taking from a research paper
Table No.:4.1 Data from given data in reference paper
Work station
Task time
Efficiency %
1 82 50 80 6400
2 34 20 128 16384
http: // www.ijrtsm.com© International Journal of Recent Technology Science & Management 9
4 11 6 151 22801
5 22 13 140 19600
6 11 6 151 22801
7 9 5 153 23409
8 30 18 132 17424
9 13 8 149 22201
10 38 23 124 15376
11 24 14.8 138 19044
12 24 14.8 138 19044
13 20 12.3 142 20164
14 10 6 152 23104
15 18 11.1 144 20736
16 10 6 152 23104
17 16 9.8 146 21315
18 37 22.8 125 15625
19 34 20.9 128 16384
20 23 14.1 145 21025
21 32 19.7 130 16900
22 16 9.8 146 21316
23 29 17.9 133 17689
24 47 29 115 13225
25 7 4 155 24025
26 9 5 153 23409
27 36 22 126 15876
28 10 6 152 23104
29 17 10.4 145 21025
http: // www.ijrtsm.com© International Journal of Recent Technology Science & Management 10
31 9 5 153 23409
32 38 23.4 124 15376
33 8 4 154 23716
34 11 6.7 151 22801
35 18 11.1 144 20736
36 31 19.1 131 17161
37 10 6 152 23104
38 10 6 152 23104
39 15 9.2 147 21609
40 29 17.9 133 17689
41 34 20.9 128 16384
42 26 16 136 18496
43 16 9.8 146 21316
44 12 7.4 150 22500
45 13 8 149 22201
46 10 6 152 23104
47 19 11.1 143 20449
48 10 6 152 23104
49 51 31 111 12321
50 9 5 153 23409
51 69 42.5 93 8649
52 53 32.7 109 11881
53 6 3.7 156 24336
54 25 15.4 137 18769
55 15 9.2 147 21609
56 15 9.2 147 21609
http: // www.ijrtsm.com© International Journal of Recent Technology Science & Management 11
58 25 15.4 137 18769
59 10 6 152 23104
60 20 12.3 142 23164
61 6 3.7 146 24336
62 14 8.6 148 21904
63 14 8.6 148 21904
64 28 45 134 17956
65 38 23.4 124 15376
66 24 14.8 138 19044
67 15 9.2 147 21609
68 18 11.1 144 20736
69 156 96 6 36
70 162 100 0 0
V. RESULTS
5.1 Result from current method:
Table No.5.1 Result from given data
S. No. Description Current method
1 Cycle time 162 Sec
2 Efficiency 15.9%
3 No. of work station 70
4 No. of operation 70
5 Smoothness index 19.3
http: // www.ijrtsm.com© International Journal of Recent Technology Science & Management 12
5.1.1 Simulation results for current method
Mean Exit Time
Throughput per Hour
Throughput per Day
3:14.4000
14.269536
342.46886
http: // www.ijrtsm.com© International Journal of Recent Technology Science & Management 13
5.2 Solution:
Fig.5.2 Precedence diagram for RPW Method
5.2.1 Ranked Positional Weight Method (RPW):
Step 1. Calculate the RPWfor each element by summing the elements Te together with the Te values for allthe elements that follow it in the arrow chain of the precedence diagram.
Step 2 List the elements in the order of their RPW, largest RPW at the top of the list. For convenience,include the Te value and immediate predecessors for each element.
http: // www.ijrtsm.com© International Journal of Recent Technology Science & Management 14
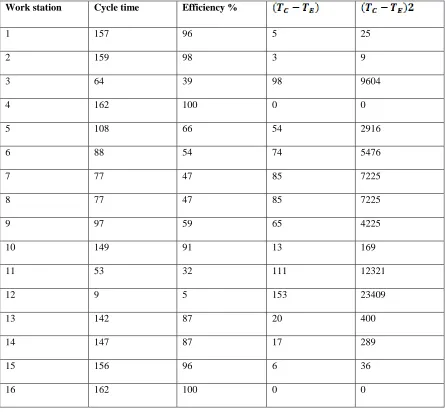
Table No.5.2 for given data by RPW Method (Cycle time 162 Sec)
Work station Cycle time Efficiency %
1 157 96 5 25
2 159 98 3 9
3 64 39 98 9604
4 162 100 0 0
5 108 66 54 2916
6 88 54 74 5476
7 77 47 85 7225
8 77 47 85 7225
9 97 59 65 4225
10 149 91 13 169
11 53 32 111 12321
12 9 5 153 23409
13 142 87 20 400
14 147 87 17 289
15 156 96 6 36
16 162 100 0 0
.2.2 Results from RPW Method
Table No.5.3 Result from RPW Method
S. No. Description RPW method
1 Cycle time 162 Sec
2 Efficiency 69%
3 No. of work station 16
http: // www.ijrtsm.com© International Journal of Recent Technology Science & Management 15
5 Smoothness index 4.5
6 Delay period 31%
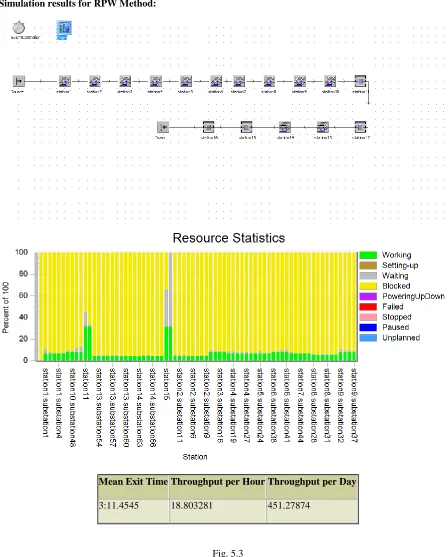
5.2.3 Simulation results for RPW Method:
Mean Exit Time Throughput per Hour Throughput per Day
3:11.4545 18.803281 451.27874
http: // www.ijrtsm.com© International Journal of Recent Technology Science & Management 16
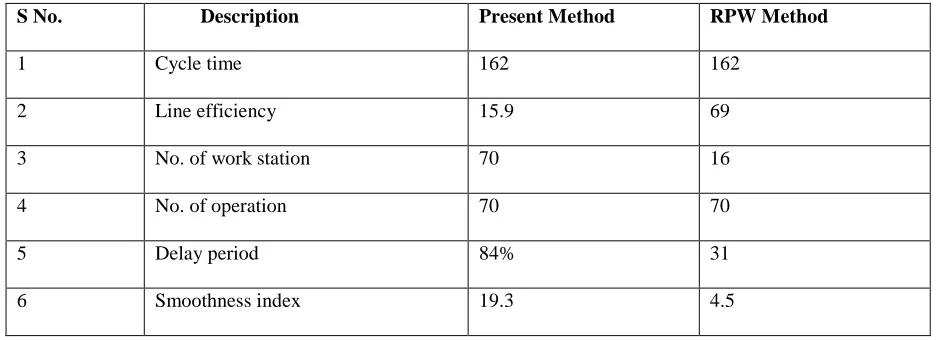
5.3 Comparison of results between given data from reference paper and RPW Method
Table No.5.4 Comparison between present method and RPW Method
S No. Description Present Method RPW Method
1 Cycle time 162 162
2 Line efficiency 15.9 69
3 No. of work station 70 16
4 No. of operation 70 70
5 Delay period 84% 31
6 Smoothness index 19.3 4.5
VI. CONCLUSION
This research work totally based on TYPE-1 problem in which cycle time will constant and workstation may vary. All the calculations made on both data’s and results took in the form of EFFICIENCY,DELAY PERIOD and
SMOOTHNESS INDEX.
A simulation software named "PLANT SIMULATION" is also used to visualize whole process of Assembly Line in practical manner which cross check mathematical calculation too.
In this case data have taken from research paper and RPW method apply on that data for comparison In last results come out is that RPW method is more efficient than all of other methods.
REFERENCES
[1]. Nils Boysen, MalteFliedner, Armin Scholl (2008) “Assembly line balancing: Which model to use when?”. Int. J. Production Economics Vol.1 , pp.509–528.
[2]. Ana S. Simaria, Pedro M. Vilarinho (2009) “2-ANTBAL: An ant colonoptimisation algorithm for balancing two-sided assembly lines”. Computers & Industrial Engineering Vol.56, pp.489–506.
[3]. Wenhui Fan, ZhenxiaoGao, WeidaXu, TianyuanXiao (2010) “Balancing and simulating of assembly line with overlapped and stopped operation”. Simulation Modelling Practice and Theory Vol.18, pp.1069–1079.
[4]. Christian Blum, Cristobal Miralles (2011) “On solving the assembly line worker assignment and balancing problem via beam search”. Computers &Operations Research Vol.38, pp.328–339.
[5]. HosseinRajabalipourCheshmehgaz, HabibollahHaron, FarahnazKazemipour, MohamadIshakDesa (2012) “Accumulated risk of body postures in assembly line balancing problem and modeling through a multi-criteria fuzzy-genetic algorithm”. Computers & Industrial Engineering, Vol.63, pp.503–512
http: // www.ijrtsm.com© International Journal of Recent Technology Science & Management 17
[7]. Becker, C., Scholl, A. 2009. Balancing assembly lines with variable parallel workplaces: problem definition and effective solution procedure. Eur J Oper Res, 199: 359–374.
[8]. Boysen, N., Fliedner, M., Scholl, A. 2007. A classification of assembly line balancing problems. Eur J Oper Res, 183: 674–693.
[10]. Cortes, P., Onieva, L., Guiadix, J. 2010. Optimising and simulating the assembly line balancing problem in a motorcycle manufacturing company: a case study. Int J Prod Res, 48: 3637–3656.
[11] Dimitriadis, SG. 2005. Assembly line balancing and group working: a heuristic procedure for workers‟ groups operating on the same product and workstation. ComputOper Res, 33 2757– 2774.
[12] Dolgui, A., Finel, B., Guschinsky, NN., Levin, GM., Vernadat, FB. 2006. MIP approach to balancing transfer lines with blocks of parallel operations. IIIE Trans, 38: 869–882.
[13] Erel, E., Gokcen, H. 1999. Shortest - route formulation of mixed model assembly line balancing problem. Eur J Oper Res, 116 : 194 – 204. Fonseca, DJ., Guest, CL., Elam, M., Karr, CL. 2005. A fuzzy logic approach to assembly line balancing. Mathware& Soft Computing, 12:57-74.